Analysis of Different Rare Metals, Rare Earth Elements,
and other Common Metals in Groundwater of South West
Bank/Palestine by ICP/MS-Data and Health Aspects
Fuad Al-Rimawi1, Khalid Kanan1, Mutaz Qutob2,3*
1Faculty of Science and Technology, Al-Quds University, East Jerusalem, Palestine; 2Department of Earth and Environmental Stud-ies, Faculty of Science and Technology, Al-Quds University, East Jerusalem, Palestine; 3Aquatic and Aquaculture Research Labora-tory, Al-Quds University, East Jerusalem, Palestine.
Email: *[email protected]
Received July 15th, 2013; revised August 19th, 2013; accepted September 23rd, 2013
Copyright © 2013 Fuad Al-Rimawi etal. This is an open access article distributed under the Creative Commons Attribution License,
which permits unrestricted use, distribution, and reproduction in any medium, provided the original work is properly cited.
ABSTRACT
Ground water samples are collected from south West Bank/Palestine and analyzed for different rare elements (Rb, Zr, U, P, Ti, V), rare earth elements (La, Ce, and Nd), and other common trace metals (Li, Na, Mg, Ca, Sr, Ba, K, Bi) that most of them usually have no maximum acceptable limits as either they are considered not to be toxic to human health or there is no sufficient data about their toxicity to human health. This study was conducted to determine the water quality of ground water which is used for drinking in the study area. Water samples from ten groundwater wells were obtained in three different dates of the year (November 2012, March 2013, and April 2013). Three water samples were obtained from each well for each sampling date; so a total of 90 water samples were collected from the ten wells. The results obtained from this study suggest a possible risk to the population of the study area given the high concentration of some metals that have no maximum allowed concentration, and the fact that for many people in the study area, ground water is a main source of their water supply.
Keywords: Rare Metals; Rare Earth Elements; WHO Limits; ICP/MS; Ground Water; West Bank
1. Introduction
The great importance of water for man makes the accu- rate management of this natural resource a priority in order to preserve its sustainability. Water analysis plays a decisive role in regulations that determine the water qual- ity levels for specific uses e.g., for drinking water [1]. Water analysis applicability is also extended to the study of water origin and evolution, taking into account the natural and anthropic influences, e.g. water-water and wa- ter-rock interactions, groundwater exploitation regulation (protection and recharge of aquifers), contamination proc- esses, etc. It is often assumed that natural ground water from deep wells is clean and healthy [2]. This is usually true with regards to bacteriological composition. How- ever, a large variety of solutes are transferred to the water via complex pathways and processes, such as atmospheric and terrestrial sources. The result is the occurrence of different components in the water, which define the hy-
drochemical fingerprint. This fingerprint permits identi- fication of water, the media and the interactions between them, including those associated with anthropic activities. The concept is comparable to individual fingerprint iden- tification. High concentrations of many chemical elements can occur in ground water due to variations in the re- gional geology and water/rock interactions [3-6]. Inor- ganic chemical quality of ground water is, however, rarely adequately tested before the wells are put into production [7].
Occurrence of trace elements in ground water is very sensitive to geological changes and, in many cases, to anthropic influences [7]. Hence, the advances in analyti- cal techniques facilitate the application of the hydro- chemical fingerprint concept. Inductively coupled plasma- mass spectrometry (ICP-MS) is particularly suitable for this purpose due to the possibility of rapid multi-element analysis in combination with excellent detection limits [8-11]. The ICP-MS allows one to obtain complete in- formation on the trace elements occurring in water, in-
cluding those present in sub-ppb concentrations. The ana- lytical capability of ICP-MS in this field has led to con- sideration of this technique for routine water analysis.
Several studies have shown that wells in areas with particular geological features yield water that does not meet established drinking water norms without any in- fluence from anthropogenic contamination e.g. Misund et al., 1999 [7]; Frengstad etal., 2000 [12], Reimann etal. 2003 [13]. This work is a continuation of a previous work where heavy metal contamination of the groundwater of south West Bank in Palestine was assessed by analysis of different heavy metals (Tl, Pb, Bi, Cr, Mn, Co, Ni, Cu, Zn, Mo, Al, Ag, and Cd) and results showed that 93% of all samples analyzed contained one or more of the 13 metals studied each in varying concentration, and some metals (Pb Cd, and Al) are found to be higher than the allowed WHO limits in some samples. The present paper reports analytical results for some rare elements (Rb, Zr, U, P, Ti, V, La, Ce, and Nd) as well as other common elements (Ca, Mg, K, Sr, Ba, and Bi) which most of them have no maximum allowed concentrations by WHO or any other regulation agencies. The current study also document that quite a number of elements for which no drinking water guideline values or maximum acceptable concentration limits have been established can occur at unpleasantly high levels in natural well waters (e.g. Li, Na, Mg, Ca, Sr, Ba, K, Bi).
2. Experimental
2.1. Study Area
West Bank is divided into eleven districts: Bethlehem, Hebron, Jenin, Jericho, Jerusalem, Nablus, Qalqilya, Ra- mallah and Al-Bireh, Salfit, Tubas, and Tulkarm. The districts are sub-divided into 89 municipalities, and there are local councils that manage all infrastructure and basic services in the towns and villages.
2.1.1. Geography and Geology
South of West Bank including Jerusalem, Beitlehem, and Hebron have a highly varying topography and altitude; with the highest point at 1011 m above sea level and the lowest at 150 m above sea level. In terms of geology, the majority of the study area is rocky mainly comprised of carbonate sediment such as limestone, chalky limestone and dolomite with marl. The geological rock age forma- tions range from Turonian to Upper Cenomanian [14].
2.1.2. Climate
Water samples were obtained from south of West Bank/ Palestine including three areas: Jerusalem, Beitlehem, and Hebron. The climate of the study area ranges from arid to semi-arid with an increase in aridity towards the Negev
desert in the south and the Jordan valley in the east. The monthly average temperature of the study area ranges from 7.5˚C - 10˚C in the winter to 22˚C in the summer. The minimum temperature is −3˚C in January and the maximum is 40˚C in August. Most of the rain falls dur- ing December through February, although there may be rain from mid-October to the end of April. Water short- age is a serious problem facing the study area due to the arid and semi-arid climatic conditions [14].
2.1.3. Groundwater: Aquifers and Wells
The West Bank lies over the Mountain aquifer which is divided into the eastern aquifer, the northeastern aquifer, and the western aquifer. The eastern aquifer and part of the northeastern aquifer flow east towards the Jordan River. The western aquifer and part of the northeastern aquifer flow westerly towards the Mediterranean Sea [15, 16]. In the study area, there are 24 wells [17].
2.2. Sampling and Analysis
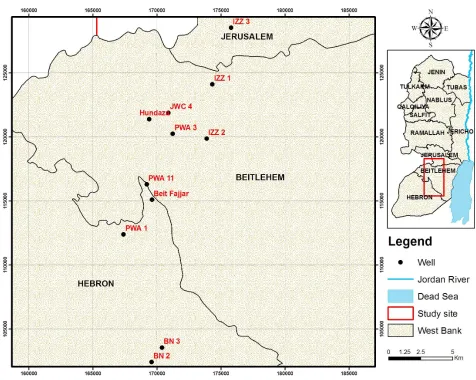
Ten groundwater wells were selected as representative wells of the study area. Figure 1 shows location of the wells in the study area analyzed in this study. Three sam-ples were obtained from each well. The selected wells were sampled three times in three different dates of 2012 and 2013 (November 2012, March 2013, and April 2013). A total of 90 water samples were collected from the ten wells. The water samples were collected in 1-liter high density polyethylene bottles (pre-cleaned with 10% nitric acid followed by repeated rinsing with bi-distilled water), stabilized with ultrapure nitric acid (0.5% HNO3), pre- served in a cool place (about 4˚C) and transported to the lab of Al-Quds University for further analysis. The sam- ples were then analyzed for trace elements content by ICP/MS (Agilent technologies 7500 series).
Figure 1. Map of West Bank and the study area showing location of the ground wells analyzed in this study.
the precision of the method for the analysis of these heavy metals. Calibration curves for all metals analyzed were constructed by plotting the ratio of the intensity of the analyte metal to that of the internal standard (Y) vs. concentration of the trace metal (in ppb), and results showed that the calibration curves are linear with corre-lation coefficient (r2) greater than 0.999 for the trace metals analyzed.
quadrupole mass analyzer with 0.8 amu resolution at 10% height, an octapole reaction system (ORS), and electron multiplier detector.
The operating conditions are as follows: nebulizer gas (argon) flow rate: 0.9 L/min, auxiliary gas (argon) flow 0.3 L/min, plasma (Argon) gas flow: 15 L/min, reaction gas flow (helium) 4 mL/min, lens voltage 7.25 V, ICP RF power: 1100 W, CeO/Ce = 1%, and Ce+2/Ce+1 = 1%. The Agilent Technologies 7500 Series ICP-MS (Agilent
7500) can measure trace elements as low as one part per trillion (ppt) and quickly scan more than 70 elements to determine the composition of an unknown sample with a MassHunter Workstation software automates the analysis and accurately interprets the resulting data. The ICP/MS instrument consists of an on-board peristaltic pump that controls the flow of sample solution into and waste (drain) out of the instrument, a nebulizer (Micro Mist nebulizer) that uses a stream of argon to disperse the sample, an ICP Argon plasma torch using Argon as plasma gas, auxillary gas and nebulizer (carrier) gas, two pumps for evacuation,
2.3. Statistical Analysis
Data were analyzed using Origin 9 software. Statistical differences were tested using one way ANOVA. Differ-ences were considered significant at p values ≤ 0.05.
3. Results and Discussion
3.1. Concentration of the Analyzed Elements
3.1.1. Rare Elements
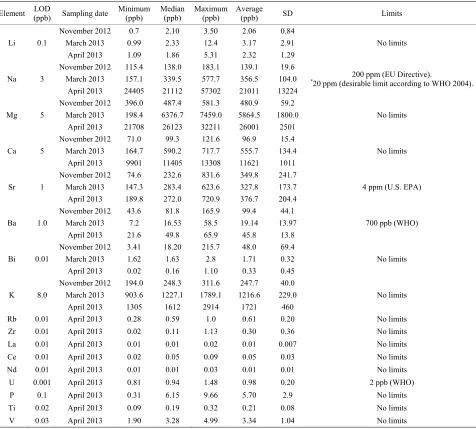
in Table 1, and are three times the standard deviation estimated from six replicate measurements of the blank (1% v/v HNO3). The detection limits by ICP-MS range between 0.01 and 8.0 ppb for the trace elements analyzed in this study. Table 1 summarizes concentrations (mini-mum, median, maxi(mini-mum, average, and standard devia-tion) of the trace elements (Li, Na, Mg, Ca, Sr, Ba, Bi, K which are analyzed on November 2012, March 2013 and April 2013) as well as rare elements (Rb, Zr, La, Ce, Nd, U, P, Ti, V which are analyzed in April 2013) for the groundwater samples analyzed in this study. It provides additional information on water standards (WHO, Euro-pean Union, US EPA) for some elements analyzed in this study (Na, Ba, U, and Sr). One of the largest differences in opinion between the authorities exists for U, for which
[image:4.595.62.538.308.737.2]the EU has not defined any maximum acceptable limit, while WHO (1998) has set a limit of 2 ppb, based on toxicological considerations [18]. The concentration of U in the water samples for the 10 ground wells analyzed in this study was found to be in the range of 0.81 to 1.48 ppb with a median of 0.94 and average of 0.98 ppb. Al- though all water samples have U within the acceptable limits, it has been detected in all samples analyzed in this study. Uranium is present in the environment as a result of leaching from natural deposits, release in mill tailings, emissions from the nuclear industry, the combustion of coal and other fuels and the use of phosphate fertilizers that contain uranium. Its presence in drinking water is most commonly from natural sources. Uranium occur- rence in groundwater has been already reported in many
Table 1. Concentration (in ppb) of different elements detected in groundwater wells analyzed in this study.
Element (ppb) LOD Sampling date Minimum (ppb) Median(ppb) Maximum(ppb) Average(ppb) SD Limits
November 2012 0.7 2.10 3.50 2.06 0.84
March 2013 0.99 2.33 12.4 3.17 2.91
Li 0.1
April 2013 1.09 1.86 5.31 2.32 1.29
No limits
November 2012 115.4 138.0 183.1 139.1 19.6
March 2013 157.1 339.5 577.7 356.5 104.0
Na 3
April 2013 24405 21112 57302 21011 13224
200 ppm (EU Directive).
*20 ppm (desirable limit according to WHO 2004).
November 2012 396.0 487.4 581.3 480.9 59.2 March 2013 198.4 6376.7 7459.0 5864.5 1800.0 Mg 5
April 2013 21708 26123 32211 26001 2501
No limits
November 2012 71.0 99.3 121.6 96.9 15.4
March 2013 164.7 590.2 717.7 555.7 134.4
Ca 5
April 2013 9901 11405 13308 11621 1011
No limits
November 2012 74.6 232.6 831.6 349.8 241.7
March 2013 147.3 283.4 623.6 327.8 173.7
Sr 1
April 2013 189.8 272.0 720.9 376.7 204.4
4 ppm (U.S. EPA)
November 2012 43.6 81.8 165.9 99.4 44.1 March 2013 7.2 16.53 58.5 19.14 13.97 Ba 1.0
April 2013 21.6 49.8 65.9 45.8 13.8
700 ppb (WHO)
November 2012 3.41 18.20 215.7 48.0 69.4 March 2013 1.62 1.63 2.8 1.71 0.32 Bi 0.01
April 2013 0.02 0.16 1.10 0.33 0.45
No limits
November 2012 194.0 248.3 311.6 247.7 40.0 March 2013 903.6 1227.1 1789.1 1216.6 229.0 K 8.0
April 2013 1305 1612 2914 1721 460
No limits
Rb 0.01 April 2013 0.28 0.59 1.0 0.61 0.20 No limits
Zr 0.01 April 2013 0.02 0.11 1.13 0.30 0.36 No limits
La 0.01 April 2013 0.01 0.01 0.02 0.01 0.007 No limits
Ce 0.01 April 2013 0.02 0.05 0.09 0.05 0.03 No limits
Nd 0.01 April 2013 0.01 0.01 0.03 0.01 0.01 No limits
U 0.001 April 2013 0.81 0.94 1.48 0.98 0.20 2 ppb (WHO)
P 0.1 April 2013 0.31 6.15 9.66 5.70 2.9 No limits
Ti 0.02 April 2013 0.09 0.19 0.32 0.21 0.08 No limits
regions; in a survey of 130 sites (approximately 3700 samples) in Ontario, Canada, conducted between 1990 and 1995, the mean of the average uranium concentra- tions (range 0.05 - 4.21 μg/litre) in treated drinking-water was 0.40 ppb [19]. A study in Finland examined a popu- lation receiving drinking-water containing uranium with a median concentration of 28 ppb [20]. In a study of 476 Norwegian groundwater samples, 18% had uranium con- centrations in excess of 20 ppb [12]. Concentrations in excess of 20 ppb have been reported in groundwater from parts of New Mexico, USA [21], and central Australia [22]. Intake through drinking-water is normally low; how- ever, in circumstances in which uranium in present in a drinking-water source, the majority of intake can be through drinking-water [23].
No drinking water standards are defined by EU, WHO or US EPA for Rb, Zr, La, Ce, Nd, P, Ti, and V. Several of these elements have documented health effects [13]. For others, for example the rare earth elements, knowl- edge about health effects are rather limited [24]. How- ever all of these elements are detected in all groundwater samples analyzed in this study. Additionally, some of these elements are unexpectedly and surprisingly detected with high concentrations e.g. P, V; the concentration of P ranges from 0.31 to 9.66 ppb with an average of 5.70 ppb, and the concentration of V ranges from 1.90 to 4.99 ppb with an average of 3.34 ppb. The concentration of Rb, Zr, La, Ce, Nd, and Ti was found to be in the range of 0.28 - 1.0 (average = 0.61 ppb), 0.02 - 1.13 (average = 0.30 ppb), 0.01 - 0.02 (average = 0.01 ppb), 0.02 - 0.09 (av-erage = 0.05 ppb), 0.01 - 0.03 (av(av-erage = 0.01 ppb), 0.09 - 0.32 (average = 0.21 ppb), respectively. In addition to the potential pollution of groundwater with these rare elements, the concentrations of these elements such Bi, and rare earth elements, which are extremely low in na- tural waters, are of particular interest to fingerprint the groundwater sources [25].
3.1.2. Common Elements
Concerning Na, Mg, Ca, Sr, and Li, they are elements of primarily geogenic origin. Their presence in groundwater is due to rock-water interaction over time and/or weath- ering of silicate and carbonate minerals in particular [13]. Of these elements, only sodium and strontium has maxi- mum acceptable limits, while the rest (Mg, Ca, and Li) have no limits. However, several of the elements that have no maximum allowed limits in drinking water are deemed to have health effects [13]. Furthermore, there are a number of elements that are rather toxic and/or car- cinogenic for which no maximum allowed limit has been defined, probably often under the assumption that “natu- ral concentrations in water must be very low” (WHO, 1993; statement with regard to Be) [26]. Our results
showed that the concentrations of some elements ana- lyzed cover between one and three orders of magnitude. For many of these elements, little is known about health effects at drinking water concentrations. In this respect, it is important to analyze and monitor regularly such ele- ments that have no maximum acceptable limits in drink- ing water.
Sodium exists in ground water naturally as a result of rock-water interactions. Sodium ion is ubiquitous in wa- ter, owing to the high solubility of its salts and the abun- dance of Na-containing mineral deposits [27]. According to WHO 2004 [28], the desirable limit of sodium is 20 ppm, while the limit is 200 ppm according to EU Direc- tive regulations [29]. Our results showed that the con- centration of sodium ranges from 0.12 - 0.18 (average is 0.14 ppm), 0.16 - 0.58 (average is 0.36 ppm), 24.4 - 57.3 (average is 21.0 ppm) for the water samples analyzed in November 2012, March 2013, and April 2013, respec- tively. These results show that all water samples col- lected in April 2013 exceeded the desirable limit of Na according to WHO 2004 (20 ppm) while this concentra- tion is still within the limit of EU directive (200 ppm). Anyway, the concentration of sodium in ground water collected in April 2013 is relatively large which indicates that groundwater of the study area needs regular moni- toring. Although sodium is essential to human body, ex- cessive intake or very high doses of Na may cause acute effects such as nausea, vomiting, inflammatory reaction in the gastrointestinal tract, thirst, muscular twitching, and convulsions. For long-term lower level exposures, the health effect of primary concern is hypertension, cen- tral nervous system disturbances such as convulsions, confusion and pulmonary edema are possible [27]. Mag- nesium is present also naturally in ground water. There is no limit for Mg according to WHO or EU. However, regulative agencies in some countries set a limit for Mg. For example, the Bureau of Indian Standards (BIS) has set a limit of 30 ppm for Mg in drinking water [30]. As in the case of Na, the concentration of Mg in the ground water samples collected in April 2013 is high (21.7 - 32.2 ppm) and exceeded the limit of BIS for Mg in drinking water (30 ppm) for some groundwater samples (more than 60% of the analyzed water samples). Increased intake of Mg salts may cause a change in bowel habits (diarrhea), but seldom causes hypermagnesemia in persons with nor- mal kidney function. Excess Mg concentration may lead to changes in mental status, nausea, diarrhea, loss of ap- petite, muscle weakness, difficulty in breathing, extremely low blood pressure, and irregular heartbeat [31].
2013 is low (less than 1 ppm). The desirable limit of Ca is specified as 75 ppm for drinking water according to WHO [32]. Concern for excess calcium intake is directed primarily to those who are prone to milk alkali syndrome (the simultaneous presence of hypercalcemia, metabolic alkalosis and renal insufficiency) and hypercalcemia. Al- though calcium can interact with iron, zinc, magnesium and phosphorous within the intestine, thereby reducing the absorption of these minerals, available data do not suggest that these minerals are depleted when humans consume diets containing calcium above the recommended levels [32]. Water hardness has been related with cardio- vascular diseases, though it is not clear whether it is due to calcium and/or magnesium or because metals are more soluble in hard waters [33]. Strontium which behaves chemically like calcium has a geogenic origin, so it pre- sent naturally in ground water. The concentration of Stron- tium in the 90 ground water samples analyzed in this study was found to be in the range of 74.6 - 831.6 (aver- age is 349.8 ppb), 147.3 - 623.6 (average is 327.8 ppb), and 189.8 - 720.9 (average 376.7 ppb) for water samples collected in November 2012, March 2013, and April 2013, respectively. The US Environmental Protection Agency (EPA) has developed a limit of 4 ppm for strontium lev- els in drinking water [34]. However WHO does not set a maximum acceptable limit of Sr in drinking water. Ac- cording to EPA, Water that contains more than 4 ppm of Sr should not be used for drinking water or to prepare beverages, food with water as a major ingredient or in- fant formulas. Lithium which exist in the groundwater naturally was found to be in the ground water samples analyzed in this study in the range of 0.70 - 3.5, 0.99 - 12.4, and 1.09 - 5.31 ppb for the samples analyzed in November 2012, March 2013, and April 2013, respec- tively. There is no maximum acceptable limit of Li in drinking water.
Regarding the concentration of potassium in the ground water samples analyzed in this study, it ranges from 194.0 to 311.6 ppb (with an average of 247.7 ppb), 903.6 to 1789.1 ppb (average of 1216.6 ppb), and 1305.3 to 2914.6 ppb (average 1721.3 ppb) for water samples col- lected in November 2012, March 2013, and April 2013, respectively. There is no limit for K in drinking water according to WHO or EPA.
However, increased exposure to potassium could result in significant health effects in people with kidney disease or other conditions, such as heart disease, coronary artery disease, hypertension, diabetes, adrenal insufficiency and pre-existing hyperkalemia. Symptoms of hyperkalemia include weak pulse rate, irregular heartbeat and nausea [35]. Infants have also a limited renal reserve and imam- ture kidney function and may therefore be morevulner- able [36]. The concentration of Barium in the ground
water samples analyzed in this study was found to be in the range of 43.6 to 165.9 ppb ( with an average of 99.4 ppb), 7.2 to 58.5 ppb (average of 19.14 ppb), and 21.6 to 65.9 ppb (average 45.8 ppb) for water samples collected in November 2012, March 2013, and April 2013, respect tively. WHO has set a maximum allowed limit for Ba in drinking water of 700 ppb [18]. Ba in drinking-water is likely to be associated with groundwater of low pH from granite-like igneous rocks, alkaline igneous and volcanic rocks and manganese-rich sedimentary rocks. Concentra- tions are, therefore, expected to be relatively stable [37]. When people are exposed to Ba for short periods at levels above the maximum contaminant level, they may experi- ence gastrointestinal disturbances and muscular weak- ness. Additionally, Ba has the potential to cause high blood pressure when exposed to levels above the limit for long periods of time [37]. Concerning the concentration of Bismuth in the ground water samples analyzed in this study, our results showed that the it ranges from 3.41 to 215.71 ppb (with an average of 48.02 ppb), 1.62 to 2.82 ppb (average of 1.71 ppb), and 0.02 to 1.10 ppb (average 0.33 ppb) for water samples collected in November 2012, March 2013, and April 2013, respectively. Although there are no limits for Bi in drinking water by WHO, EPA or any other agency, it has been detected in all wa- ter samples analyzed in this study.
3.2. Effect of Sampling Date on the Content of the Analyzed Elements
Statistical analyses were conducted to test if there is sig- nificant difference in the concentration of the studied elements in the groundwater wells as a function of the sampling date (November 2012, March 2013, and April 2013), and results confirmed that there is a significant difference, denoting that element concentration in the wells vary significantly with sampling time. As it is seen
in Table 1, the highest concentration of Li varies from
tion with significant variations. For Ba, the highest con- centration in November 2012 is 165.9 while it is 58.5 ppb in March 2013. For Sr, the highest concentration was found to be 831.6 ppb in November 2012 while it is 623.6 ppb in March 2013.
4. Conclusion
High concentrations are observed for a number of ele- ments for which no maximum allowed concentration val- ues have been proposed (e.g., Li, Sr, Bi, Ba, V). These elements may warrant a toxicological assessment. These elements need urgent attention from a health perspective. Public authorities might be well advised to establish maximum allowed limits for such elements. This study demonstrates the necessity of documenting natural ele- ment concentrations and variation in drinking water re- sources on a regional scale. This must be carried out for as many elements as can be analyzed with today’s tech- niques in different geological settings, to provide finger- prints of the different types of water.
5. Acknowledgements
The authors are grateful for the German research funding organisation (Deutsche Forschungsgemeinschaft), DFG for their financial support through TRION project.
REFERENCES
[1] EU (European Union) Directive 98/83/EC on the Quality of Water intended for Human Consumption. OJ, L330, December 1998.
[2] D. Banks, A. K. Midtgard, G. Morland, C. Reimann, T. Strand, K. Bjorvatn and U. Siewers, “Is Pure Groundwa- ter Safe to Drink? Natural ‘Contamination’ of Ground- water in Norway,” GeologyToday, Vol. 14, No. 3, 1998,
pp. 104-113.
http://dx.doi.org/10.1046/j.1365-2451.1998.014003104.x [3] B. T. Hart and T. Hines, “Trace Elements in Rivers,” In:
B. Salbu and E. Steinnes, Eds., Trace Elements in Natural Waters, CRC Press, Boca Raton, 1995, pp. 203-221.
[4] C. Reimann, G. E. M. Hall, U. Siewers, K. Bjorvatn, G. Morland, H. Skarphagen and T. Strand, “Radon, Fluoride and 62 Elements as Determined by ICP-MS in 145 Nor- wegian Hard Rock Groundwater Samples,” ScienceTotal Environment, Vol. 192, No. 1, 1996, pp. 1-19.
http://dx.doi.org/10.1016/0048-9697(96)05272-2
[5] C. Reimann, U. Siwers, H. Skarphagen and D. Banks “Influence of Filtration on Concentrations of 62 Elements Analysed on Crystalline Bedrock Groundwater by ICP- MS,” ScienceTotalEnvironment, Vol. 234, No. 1-3, 1999,
pp. 155-173.
http://dx.doi.org/10.1016/S0048-9697(99)00165-5 [6] S. Hesske, A. Parriaux and M. Bensimon, “Geochemistry
of Spring Waters in Molasse Aquifers: Typical Mineral Trace Elements,” EclogaeGeologicaeHelvetiae, Vol. 90,
No. 1, 1997, pp. 151-171.
[7] A. Misund, B. Frengstad, U. Siewers and C. Reimann, “Natural Variation of 66 Elements in European Mineral Waters,” Science TotalEnvironment, Vol. 243, No. 244,
1999, pp. 21-41.
http://dx.doi.org/10.1016/S0048-9697(99)00307-1 [8] I. Kim and G. Kim, “Large Fluxes of Rare Earth Ele-
ments through Submarine Groundwater Discharge (SGD) from a Volcanic Island, Jeju, Korea,” MarineChemistry,
Vol. 127, No. 1-4, 2011, pp. 12-19.
http://dx.doi.org/10.1016/j.marchem.2011.07.006
[9] R. P. Janssen and W. Verweij, “Geochemistry of Some Rare Earth Elements in Groundwater, Vierlingsbeek, The Netherlands,” WaterResearch, Vol. 37, No. 6, 2003, pp.
1320-1350.
http://dx.doi.org/10.1016/S0043-1354(02)00492-X [10] G. G. Gruau, A. Dia, G. Olivie-Lauquet, M. Davranche
and G. Pinay, “Controls on the Distribution of Rare Earth Elements in Shallow Groundwaters,” Water Research,
Vol. 38, No. 16, 2004, pp. 3576-3586. http://dx.doi.org/10.1016/j.watres.2004.04.056
[11] M. A. Rasheed, B. A. Radha, P. L. Srinivasa Rao, M. Lakshmi, J. Bala Chennaiah and A. M. Dayal, “Evalua- tion of Potable Groundwater Quality in Some Villages of Adilabad in Andhra Pradesh, India,” JournalofEnviron- mentalBiolog, Vol. 33, 2012, pp. 689-693.
[12] B. Frengstad, A. K. Midtgard, D. Banks, J. R. Krog and U. Siewers, “The Chemistry of Norwegian Groundwaters. III. The Distribution of Trace Elements in 476 Crystalline Bedrock Groundwaters as Analysed by ICP-MS Tech- niques,” ScienceoftheTotalEnvironment, Vol. 246, No.
1, 2000, pp. 21-40.
http://dx.doi.org/10.1016/S0048-9697(99)00413-1 [13] C. Reimanna, K. Bjorvatnb, B. Frengstada, Z. Melakuc, R.
Tekle-Haimanotc and U. Siewersd, “Drinking Water Qua- lity in the Ethiopian Section of the East African Rift Val- ley I—Data and Health Aspects,” TheScienceoftheTotal Environment, Vol. 311, No. 1-3, 2003, pp. 65-80.
http://dx.doi.org/10.1016/S0048-9697(03)00137-2 [14] “Environmental Profile for the West Bank, Volume 3:
Hebron District,” Applied Research Institute, Jerusalem, 1995.
[15] A. Abed and S. Wishahi, “Geology of Palestine: The West Bank and Gaza Strip. Palestine,” Palestine Hydrol- ogy Group, 1999.
[16] F. M. Anayah and M. N. Almasri, “Trends and Occur- rences of Nitrate in the Groundwater of the West Bank, Palestine,” AppliedGeography, Vol. 29, No. 4, 2009, pp.
588-601. http://dx.doi.org/10.1016/j.apgeog.2009.01.004 [17] PHG, “Water For Life,” Water, Sanitation and Hygiene
Monitoring Program (WaSH MP), 2007/2008.
[18] WHO, “Guidelines for Drinking-Water Quality, Adden- dum to Vol. 1. Recommendations,” 2nd Edition, World Health Organisation, Geneva, 1998, pp. 10-11.
1996.
[20] P. Kurttio, A. Auvinen, L. Salonen, H. Saha, J. Pekkanen, I. Makeläinen, S. B. Vaisanen, I. M. Penttila and H. Ko- mulainen, “Renal Effects of Uranium in Drinking Water,”
EnvironmentalHealthPerspectives, Vol. 110, No. 4, 2002,
pp. 337-342. http://dx.doi.org/10.1289/ehp.02110337 [21] A. C. Hakonson-Hayes, P. R. Fresquez and F. W. Whic-
ker, “Assessing Potential Risks from Exposure to Natural Uranium in Well Water,” JournalofEnvironmentalRa- dioactivity, Vol. 59, No. 1, 2002, pp. 29-40.
http://dx.doi.org/10.1016/S0265-931X(01)00034-0 [22] J. Fitzgerald, D. Cunliffe, S. Rainow, S. Dodds, S. Hos-
tetler and G. Jacobson, “Groundwater Quality and Envi- ronmental Health Implications, Anangu Pitjantjatjara Lands, South Australia. Canberra,” Bureau of Rural Sci- ences, 2000.
[23] WHO, WHO/SDE/WSH/03.04/118/Rev/1, Background Document for Development of WHO Guidelines for Drinking Water Quality, 2012.
[24] S. Hirano and K. T. Suzuki, “Exposure, Metabolism, and Toxicity of Rare Earths and Related Compounds,” Envi- ronHealthPerspective, Vol. 104, No. 1, 1996, pp. 85-95.
[25] P. L. Smedley and D. G. Kinniburgh, “A Review of the Source, Behavior and Distribution of Arsenic in Natural Waters,” AppliedGeochemistry, Vol. 17, No. 5, 2002, pp. 517-568.
http://dx.doi.org/10.1016/S0883-2927(02)00018-5 [26] WHO, “Guidelines for Drinking Water Quality,” World
Health Organisation, Geneva, 1993.
[27] US EPA, “Consumer Factsheet on: Nitrates/Nitrites,” 2003.
http://www.epa.gov/safewater/dwh/c-ioc/nitrates.html [28] WHO, “Guidelines for Drinking Water Quality,” 3rd
Edition, Vol. 1, Recommendations, Geneva, 2004.
[29] European Union, “Council Directive 98y83yEC of 3 No- vember 1998 on the Quality of Water Intended for Hu- man Consumption,” Official Journal of the European Community, Vol. L330, 1998, pp. y32-y54.
[30] BIS (Bureau of Indian Standards), “Specification for Drinking Water, Indian Standard (IS: 10500),” New Delhi, 1993.
[31] T. H. Jaing, I. H. Hung, H. T. Chung, C. H. Lai, W. M. Liu and K. W. Chang, “Acute Hypermagnesemia: A Rare Complication of Antacid Administration after Bone Mar- row Transplantation,” Clinica Chimica Acta, Vol. 326, No. 1-2, 2002, pp. 201-203.
http://dx.doi.org/10.1016/S0009-8981(02)00308-X [32] WHO, “Calcium and Magnesium in Drinking-Water:
Public Health Significance,” Library Cataloguing-in-Pub- lication Data, Geneva, 2009.
[33] W. M. Edmunds and P. L. Smedley, “Groundwater Geo- chemistry and Health. Overview,” In: J. D. Appleton, R. Fuge and J. G. H. Mc. Call, Eds., Enviromental Geo- chemistry and Health with Special Reference to Devel- oping Countries, Geological Society, Special Publication, Vol. 113, 1996, pp. 91-105.
[34] US Environmental Protection Agency, “Strontium,” 2012. http://www.epa.gov/rpdweb00/radionuclides/strontium.ht ml
[35] J. L. Seifter, “Potassium Disorders,” In: L. Goldman, D. Ausiello and C. Medi, Eds., Cecil Medicine, 23rd Edition, Chapter 118, Saunders Elsevier, Philadelphia, 2007. [36] WHO, “Potassium in Drinking Water: Background Docu-
ment for Development of WHO Guidelines for Drinking Water Quality,” Geneva, 2009.