Achieving the trade targets of
Millennium Development Goal 8: Status
in the least developed countries of Asia
and the Pacific
Mikic, Mia and Ramjoue, Melanie
UN ESCAP
1 June 2010
Online at
https://mpra.ub.uni-muenchen.de/27451/
ESCAP Trade and Investment Division Staff Working Paper 03/09
Abstract:
This paper examines the progress made so far in achieving the trade targets of Millennium Development Goal 8 (“Building a Global Partnership for Development”) with respect to the Least Developed Countries (LDCs) of Asia and the Pacific. The paper uses data from the OECD, WTO and UNDP, among others, to measure the MDG indicators 8.6, 8.7 and 8.9 with respect to these countries, thereby quantifying some of the impacts in these countries of recent global and national policy changes in the areas of market access, tariff preferences for LDCs and Aid for Trade. This paper concludes that while the market access commitments of the Hong Kong WTO Ministerial Declaration of 2005 have largely been met and LDCs of the Asia-Pacific benefit disproportionately from Aid for Trade, the overall share of LDC exports as a part of total world exports has not increased over the past decade. In its conclusion, this paper suggests that other factors such as non-tariff barriers and product competitiveness play a significant role and should become policy priorities of better targeted Aid for Trade.
Keywords: MDG 8, least developed countries (LDCs), Asia, Pacific, market access, tariff-free, quota-free, MDG indicators 8.6, 8.7 and 8.9, supply capacity, aid for trade.
****
Disclaimer: TID Staff Working Papers should not be reported as representing the views of the United Nations. The views expressed in this TID Staff Paper are those of the author(s) and do not necessarily represent those of the United Nations. Staff Working Papers describe research in progress by the author(s) and are published to elicit comments for further debate. They are issued without formal editing. The designation employed and the presentation of the material in the TID Staff Paper do not imply the expression of any opinion whatsoever on the part of the Secretariat of the United Nations concerning the legal status of any country, territory, city or area or of its authorities, or concerning the delimitation of its frontiers or boundaries.
Mia Mikic and Melanie Ramjoué1 Trade and Investment Division ESCAP
Bangkok, Thailand
Copyright © UNESCAP 2009 All rights reserved
www.unescap.org/tid
1
The authors are grateful to Mr. Sangmo Jeon for his assistance in the compilation of statistical data and background information. The opinions, figures and estimates presented here are those of the authors who bear responsibility for any remaining errors and omissions. The authors can be contacted at [email protected] and [email protected].
Achieving the Trade Targets of Millennium Development Goal 8:
Status in the Least Developed Countries of Asia and the Pacific
*30 December 2009, revised 1 June 2010
Contents
I. Introduction...5
Global progress on MDG 8 trade targets...5
Taking stock of progress on MDG 8 for Asia-Pacific LDCs...6
II. Trade targets and indicators of MDG 8...7
III. Improving demand-side conditions: enhancing market access for LDC exports...8
Market access for LDCs on a most-favoured nation basis (MFN)...8
Market access for LDCs through reciprocal preferential trade agreements...9
Preferential market access provided unilaterally...10
Growth of LDC exports...17
IV. Improving supply-side conditions: increasing Aid for Trade...18
Data on Aid for Trade...18
Recipients of Aid for Trade...18
V. Conclusions and Policy Recommendations...23
On Market Access...23
On Aid for Trade...23
References...24
Annexes...25
Annex 1. Proportion of Total Developed Country Imports (By Value And Excluding Arms) From Developing Countries and From The Least Developed Countries, Admitted Free of Duty (in percentage)... 26
Annex 2. Average Tariffs Imposed by Developed Countries on Agricultural Products From Developing Countries ... 27
Annex 3. Average Tariffs Imposed by Developed Countries on Industrial Products From Developing Countries ... 28
Annex 4. Average Tariffs Imposed by Developed Countries on Textiles From Developing Countries... 29
List of Figures
Figure 1. Share Of Asia-Pacific Ldc Merchandise Exports Directed To Developed Country
Markets ... 11
Figure 2. Difference In Proportion Of Duty-Free Access To Developed Countries’ Markets Between Individual Ldcs In Asia-Pacific And All Ldcs………...……….12
Figure 3. Variations Across Products For Asia-Pacific Ldcs Duty-Free Access In The Developed Country Markets (In Percentage) ... 13
Figure 4. Tracking Exports Of The Ldcs Of The Asia-Pacific Region (All Products Except Arms) Admitted To Developed Country Markets Duty-Free (In Percentage) ... 14
Figure 5. Average Tariffs Imposed By Developed Market Economies On All Products Except Arms From Developing And Least Developed Countries, As Compared With Ldc In Asia –Pacific ... 15
Figure 6. Average Tariffs Imposed By Developed Market Economies On Agricultural Products From Developing And Least Developed Countries, As Compared With Ldc In Asia – Pacific ... 16
Figure 7. Average Tariffs Imposed By Developed Market Economies On Industrial Products From Developing And Least Developed Countries, As Compared With Ldc In Asia – Pacific ... 17
Figure 8. Aid For Trade: Regional And Sector Distribution, 2002-2005 Average, 2006, 2007 ... 19
Figure 9 . Total Disbursement Ratio Of Aid For Trade To Asia Pacific’s Ldcs In 2007... 21
Figure 10. Aid For Trade Disbursement Ratio For Trade Policy And Regulations In 2007 ... 21
Figure 11. Aid For Trade Disbursement Ratio For Economic Infrastructure In 2007 ... 22
Figure 12. Aid For Trade Disbursement Ratio For Building Productive Capacity In 2007 ... 22
List of Tables Table 1. Features of The LCDS of Asia and the Pacific... 6
Table 2. MDG 8: Trade Targets and Indicators ... 7
Table 3. Status of Asia-Pacific LDC Membership in the WTO ... 9
Table 4. Participation of LDCs in Preferential Trade Agreements... 10
Table 5. LDCs Remain Marginalized in World Trade ... 17
Table 6. Top Ranked Recipients of Aid for Trade in 2007 Are Asian ... 19
Abbreviations and acronyms
DDA Doha Development Agenda
ESCAP Economic and Social Commission for Asia and the Pacific
LDC Least Developed Countries
LLDC Landlocked Developing Countries
MDGs Millennium Development Goals
MFN Most-Favored Nation
ODA Official Development Assistance
OECD Organisation for Economic Co-operation and Development
UNCTAD United Nations Conference on Trade and Development
UNDP United Nations Development Programme
I. Introduction
In the year, 189 nations adopted the United Nations Millennium Declaration, from which the eight Millennium Development Goals (MDG) are derived. Of these eight goals, the first seven commitments, including eradicating poverty, achieving universal primary education and combating diseases, were made primarily by national Governments in favor of their constituents. In contrast, the eighth MDG (MDG 8) is a commitment by all countries to cooperate and share resources to achieve these goals. Indeed, all countries recognized that given the historic inequities and the interdependent nature of the global economy, developing countries in particular require support from the international community as a whole in order to achieve the first seven MDGs. Accordingly, MDG 8 calls for a global partnership for development and proposes a number of concrete measures of improvements of this partnership in the areas of official development assistance (ODA), trade, external debt, and access to essential medicines and technology, in order to generate the resources, opportunities and skills needed for countries to achieve the first seven MDGs.
Global progress on MDG 8 trade targets
With the 2015 target year for achieving the MDGs only five years away, how much progress has been made in reaching a global partnership for development, in particular in the area of trade? At the global level, there are still wide gaps between the MDG 8 targets and the current state of progress (United Nations,
2008 and 2009).2 The most significant implementation gap is due to the slow progress of the Doha Round
of trade negotiations, which started in 2001 and is yet to be concluded. The 2001 Doha Ministerial Declaration promised to rebalance WTO rules in favor of developing countries, including by achieving duty- and quota-free market access with universal product coverage for exports of least developed countries to developed countries. So far, some progress has been made in the area of Non-Agricultural Market Access on tariff reduction formulas, as well as in the area of trade in services. Still, if and when the round is completed, the results of the round may prove to be less favorable to developing countries than the name Doha Development Agenda would suggest and the 2001 Doha Ministerial Declaration originally called for.
A second major reason behind the implementation gap for MDG 8 is the global economic crisis which started in 2008, and continued throughout 2009 and into the first quarter of 2010 in some sub-regions. The budget constraints caused by falling fiscal revenues and stimulus package expenditures have limited countries’ capacity to significantly increase their official development assistance (ODA) to poorer countries, or forego tariff revenues by lowering their own tariffs or providing preferential treatment to LDCs. While OECD data3 suggests that official development assistance (ODA) to developing countries in fact rose from US$107.9 billion in 2005 to US$128.6 in 2008, most developed countries are still far from reaching the United Nations target of 0.7 per cent of gross national income for official development assistance.
In addition, a significant number of protectionist and trade-distorting measures have been implemented by countries seeking to safeguard national industries and jobs (WTO, 2009 and Global Trade Alert, 2009; United Nations, 2009). Such measures included increased import tariffs, non-tariff barriers (including administrative measures, subsidies and anti-dumping measures) as well as potentially trade-distorting domestic subsidies and national stimulus packages. While a global return to protectionism and a resulting widespread reduction of international trade seems to have been avoided, such policies have caused more disharmony in the international trading system. In addition, the effect of these measures is contrary to the aim of MDG 8 as they lead to less transparent policies, and less accessible markets.
2
In contrast to other MDGs, the targets of MDG 8 are not numerically defined. Rather, the targets of MDG 8 are general declarations of intent, as outlined in Table 2 below.
3
Taking stock of progress on MDG 8 for Asia-Pacific LDCs
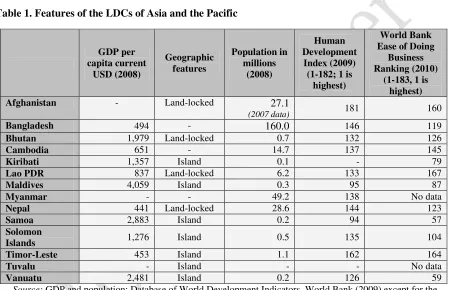
[image:7.595.75.525.254.544.2]While the multilateral negotiations aiming towards a “global partnership for development” are stalled, some progress has nevertheless been made towards MDG 8 in the area of duty-free quota-free access for LDCs and increased Aid for Trade. The focus of this paper is to examine what progress has been achieved for the LDCs of Asia and the Pacific. Indeed, many of this region’s LDCs have yet to be integrated into the global economy so as to benefit from international trade in the same way as other Asian developing countries have over the past four decades. Several factors contribute to this lack of integration into global trade. Perhaps the simplest and most difficult factor to overcome is the geographic location. As illustrated in Table 1, of the 14 least developed countries in the Asia-Pacific region, 11 are isolated from the benefits of international trade due to being locked in by land or by sea, thus causing high trade costs (Asian Development Bank, 2009).
Table 1. Features of the LDCs of Asia and the Pacific
GDP per capita current USD (2008) Geographic features Population in millions (2008) Human Development Index (2009) (1-182; 1 is
highest)
World Bank Ease of Doing
Business Ranking (2010)
(1-183, 1 is highest)
Afghanistan - Land-locked 27.1
(2007 data) 181 160
Bangladesh 494 - 160.0 146 119
Bhutan 1,979 Land-locked 0.7 132 126
Cambodia 651 - 14.7 137 145
Kiribati 1,357 Island 0.1 - 79
Lao PDR 837 Land-locked 6.2 133 167
Maldives 4,059 Island 0.3 95 87
Myanmar - - 49.2 138 No data
Nepal 441 Land-locked 28.6 144 123
Samoa 2,883 Island 0.2 94 57
Solomon
Islands 1,276 Island 0.5 135 104
Timor-Leste 453 Island 1.1 162 164
Tuvalu - Island - - No data
Vanuatu 2,481 Island 0.2 126 59
Source: GDP and population: Database of World Development Indicators, World Bank (2009) except for the population of Afghanistan, which is based on the ESCAP (2009); Human Development Index: UNDP (2009); World Bank, Doing Business 2010 Report (2010).
II. Trade targets and indicators of MDG 8
Of the six sub-targets identified for MDG 8, “improving the global partnership for development,” three pertain directly to trade (see Table 2).4 Target 8.a, the main trade-related target of MDG 8, calls for the further development of an open, rule-based, predictable, non-discriminatory trading and financial system, while two subsidiary targets, 8.b and 8.c address the special needs of LDCs, Landlocked Developing Countries (LLDCs) and small island developing states, respectively. The non-trade targets of MDG 8 aim to strengthen international cooperation to shore up the financial health of poor countries, as well as improve access to medicine and to technology under more equitable terms.
Table 2. MDG 8: Trade targets and indicators
Targets Indicators
Trade targets
8a: Develop further an open, rule-based, predictable, non-discriminatory trading and financial system
Trade and non-trade targets
8b: Address the special needs of the least developed countries
8c: Address the special needs of landlocked developing countries and small island developing States
Non-trade targets
8d:Deal comprehensively with the debt problems of developing countries through national and international measures in order to make debt sustainable in the long term
8e: In cooperation with pharmaceutical companies, provide access to affordable essential drugs in developing countries
8f: In cooperation with the private sector, make available the benefits of new technologies, especially information and communications
Trade indicators
8.6 Proportion of total developed country imports (by value and excluding arms) from developing countries and least developed countries, admitted free of duty
8.7 Average tariffs imposed by developed countries on
agricultural products and textiles and clothing from developing countries
8.8 Agricultural support estimate for OECD countries as a
percentage of their gross domestic product
8.9 Proportion of ODA provided to help build trade capacity
Source: United Nations Development Programme (UNDP), www.undp.org/mdg/goal8.shtml
In adopting the above listed targets and indicators, countries recognized that in order for trade to serve as an engine of growth, improvements to the current global trading system are required both on the demand and supply sides. On the demand side, it is crucial to improve access to markets that can absorb products and services from the developing and least developed countries by removing tariff and non-tariff barriers.
On the supply side, the last few years have seen an increased emphasis on addressing trade-capacity constraints in developing countries through Aid for Trade. Indeed, decades worth of experience with preferential schemes such as the Generalized System of Preferences (GSP) have proven that merely
4
improving market access is insufficient as long as countries lack the productive capacity to utilize the awarded market access. Developing countries need assistance on the supply side to improve capacity and build new skills to produce goods and services and to more efficiently reach global markets. As a result, one of the indicators used to measure progress towards MDG 8 is the proportion of ODA allocated to building the supply side and productive capacity of the developing countries, including through Aid for Trade.
Part III examines the extent to which progress on the demand side has been achieved, and how such progress benefits the LDCs of Asia and the Pacific. Part IV reviews recent improvements of supply-side capacity.
III. Improving demand-side conditions: enhancing market access for LDC exports
Market access conditions are typically determined by the tariff and non-tariff measures (NTMs) imposed by trading partners. Avenues for improving the market access conditions facing LDCs encompass the traditional avenue of removing tariffs and NTMs through multilateral trade negotiations under the WTO, preferential trade liberalization between two or more countries through various trade agreements, and unilateral (non-reciprocal) preferences given by trading partners, for example under the Generalized System of Preferences Scheme (GSP). Each of these avenues is explored below.
Market access for LDCs on a most-favoured nation basis (MFN)
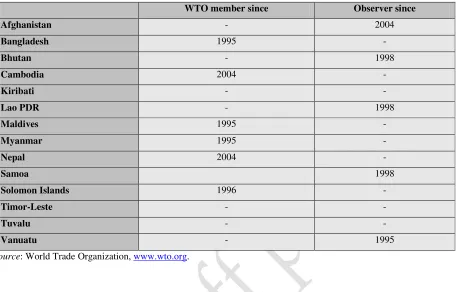
Out of 14 LDCs in the Asia-Pacific region, six joined the WTO since its establishment in 19955 (see Table 3). Five out of the 14 LDCs are currently or were in the past negotiating their accession and are thus entitled to observer status.
WTO accession is still the only means of gaining market access on a Most Favoured Nation (MFN) basis to the markets of the 153 developed and developing members of the WTO.6 The WTO agreements also provide for special and differential treatment for developing countries and especially LDCs, and offer the most stability and predictability of all trading rules achieved to date. The WTO’s Dispute Settlement Agreement has established mechanisms for the interpretation of trade law and the resolution of trade disputes, thereby ensuring the enforceability of trade rules. The WTO thus offers low-income countries a forum in which trade disputes, including involving large trading partners, can be resolved on the basis of law rather than political weight.
In addition, WTO membership can yield further benefits which are difficult to quantify but may be equally important. For example, by complying with the transparency and reporting requirements under the WTO, countries can anchor, strengthen and clarify their national trade policies and provide better information to industry, thereby sending positive signals to foreign investors and to the domestic private sector.
5
Bangladesh, Myanmar and Maldives were previously members of the General Agreement on Tariffs and Trade
(GATT) and automatically became members of the WTO upon its creation; Cambodia, Nepal and Solomon Islands joined later.
6
Table 3. Status of Asia-Pacific LDC membership in the WTO
WTO member since Observer since
Afghanistan - 2004
Bangladesh 1995 -
Bhutan - 1998
Cambodia 2004 -
Kiribati - -
Lao PDR - 1998
Maldives 1995 -
Myanmar 1995 -
Nepal 2004 -
Samoa 1998
Solomon Islands 1996 -
Timor-Leste - -
Tuvalu - -
Vanuatu - 1995
Source: World Trade Organization, www.wto.org.
Market access for LDCs through reciprocal preferential trade agreements
Given the slow pace of the WTO accession process, as well as the delayed conclusion of the Doha Development Round negotiations, some LDCs have negotiated directly with other countries to obtain preferential market access. Indicator 8.7, which addresses the level of tariffs faced by LDCs in developed country markets, targets both MFN tariffs and preferential tariffs. However, it does not differentiate between reciprocal and non-reciprocal preferential tariffs, so it is difficult to assess the contribution of PTAs in lowering the tariffs faced by LDCs.
The ESCAP secretariat has been tracking Preferential Trade Agreements through its Asia-Pacific
Trade and Investment Agreements Database (APTIAD).7 The APTIAD database reveals that while half of
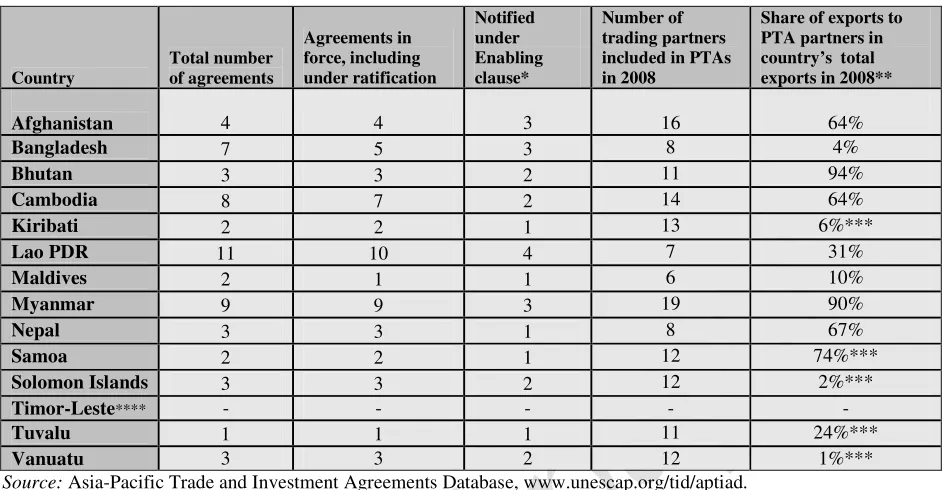
the region’s LDCs are not WTO members, all except one belong to one or more preferential trading blocs. Table 4 provides information on the participation of these countries in preferential trade arrangements, and lists the share of exports of the region’s LDCs which are covered by such arrangements. The low numbers for many countries suggest that while preferential trade agreements are important and also are typically beneficial in other areas such as the elimination of non-tariff barriers, they cannot replace a reduction of tariffs by developed countries which remain the primary export markets for LDC products.
7
APTIAD is complementary to the Regional Trade Agreements database managed by the WTO as it includes
Table 4. Participation of LDCs in preferential trade agreements Country Total number of agreements Agreements in force, including under ratification Notified under Enabling clause* Number of trading partners included in PTAs in 2008
Share of exports to PTA partners in country’s total exports in 2008**
Afghanistan 4 4 3 16 64%
Bangladesh 7 5 3 8 4%
Bhutan 3 3 2 11 94%
Cambodia 8 7 2 14 64%
Kiribati 2 2 1 13 6%***
Lao PDR 11 10 4 7 31%
Maldives 2 1 1 6 10%
Myanmar 9 9 3 19 90%
Nepal 3 3 1 8 67%
Samoa 2 2 1 12 74%***
Solomon Islands 3 3 2 12 2%***
Timor-Leste**** - - - - -
Tuvalu 1 1 1 11 24%***
Vanuatu 3 3 2 12 1%***
Source: Asia-Pacific Trade and Investment Agreements Database, www.unescap.org/tid/aptiad.
* Excluding early announcements and including the Bay of Bengal Initiative for Multisectoral Technical and Economic Cooperation (BIMSTEC), an agreement which is signed but not implemented. None of the preferential trade agreements were notified under GATS Article V.
** Based on mirror data except for Bangladesh.
*** Based on limited data coverage (only trade with Australia and New Zealand is reported)
**** Timor-Leste is pursuing a membership in the Association of Southeast Asian Nations (ASEAN) and became a member of the ASEAN Regional Forum in 2005.
Preferential market access provided unilaterally
In many cases, additional market access preferences beyond MFN treatment are granted unilaterally to LDCs (in other words, on a non-reciprocal basis). Traditionally, such preferential treatment was granted exclusively by developed countries (for example under the Generalized System of Preferences which started as early as the 1960s and was initially a mainly geopolitical instrument). In the Hong Kong WTO Ministerial declaration of 2005, the developed country members, and developing country members declaring themselves in a position to do so8 committed to providing duty-free and quota-free (DFQF) access to 100 per cent of LDC export products, though countries facing difficulties in achieving 100 per cent were allowed to provide 97 per cent with the obligation to take steps to progressively achieve compliance with the 100 per cent target. However, this 97 per cent commitment refers to individual tariff lines, not total export values.9 This difference is important in view of the concentration of LDC exports on only a few products.
8
Such developing countries include Singapore and Hong Kong, China for all products. Several other developing countries, such as Republic of Korea, Egypt and Mauritius, have granted duty-free quota-free access for a more limited range of products, while others still have granted duty-free quota-free access to a particular group of LDCs (e.g. India and China.) See http://www.wto.org/english/thewto_e/minist_e/min05_e/brief_e/brief16_e.htm.
9
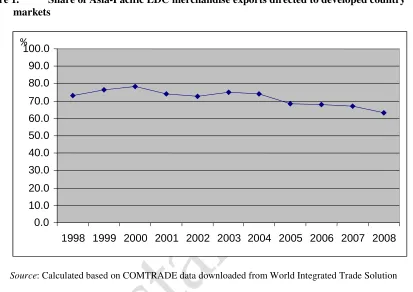
Such duty-free access to developed markets is especially important to the LDCs of Asia and the Pacific because developed country markets remain the most important export destination for goods produced in the LDCs of the Asia-Pacific region, despite a rise in South-South trade in recent years. As illustrated in Figure 1, over the past ten years, between 60 per cent and 80 per cent of all exports from the 14 LDCs of the Asia-Pacific region were destined to developed country markets.
Figure 1. Share of Asia-Pacific LDC merchandise exports directed to developed country markets
Source: Calculated based on COMTRADE data downloaded from World Integrated Trade Solution
Globally, 79 per cent10 of exports of LDCs to the markets of developed countries received duty-free access in 2007 (United Nations, 2008). As illustrated in Annex I, there has been little progress in increasing duty-free access since 2005 (United Nations 2009, pp. 27-30). In fact, the duty-free access for LDC exports fell by 0.44 per cent from 2005 to 2007, while it increased for all developing country by 3 per cent (see also Annex 1). Furthermore, the duty-free proportion for Asian LDCs remains much lower than for the African or small island LDCs.
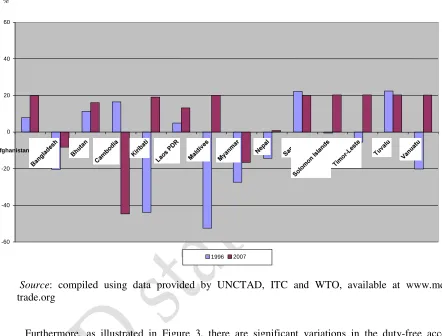
Based on data for individual countries in Annex I, Figure 2 shows the percentage point difference in size of proportion of each country’ imports with duty-free admittance to developed country markets relative to the proportion of the world-wide LDC group in 1996 and 2007. For example, in 1996 the proportion of Afghanistan’s export to developed markets accepted duty-free was by almost 8 percentage points larger than the average of the all LDCs, and by 2007 this difference increased to almost 20 percentage points. In contrast, Bangladesh was at a deficit in its share of the duty-free access to the market compared to the average for all LDCs in both years, although the difference was reduced from 20.3 to 8.3 percentage points. Similar to Bangladesh, exports from Cambodia and Myanmar were also treated less preferentially than the
10
This number is compiled based on the proportion of total imports (by value and excluding arms) by developed countries from least developed countries which are admitted free of duty. It should be noted, however, that imports are considered duty-free whenever the statutory tariff rates for the goods are zero. This does not mean that the duties actually paid are zero, as other restrictions, such as stringent rules of origin, may exclude the duty-free access. The actual share of duty-free imports could thus be lower than those presented in this paper.
%
0.0 10.0 20.0 30.0 40.0 50.0 60.0 70.0 80.0 90.0 100.0
LDC average in 2007, while Kiribati, Maldives, Nepal, Timor-Leste and Vanuatu experienced improvement from 1996 to 2007 relative to the average of all LDCs.
Figure 2. Difference in Proportion of Duty-free Access to Developed Countries’ Markets Between Individual LDCs in Asia-Pacific and all LDCs
Source: compiled using data provided by UNCTAD, ITC and WTO, available at www.mdg- trade.org
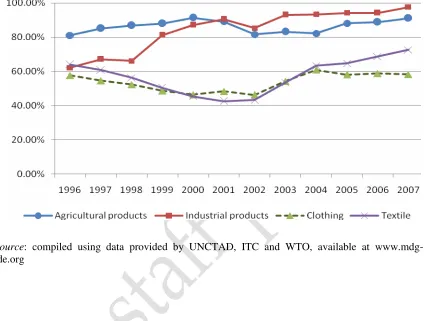
Furthermore, as illustrated in Figure 3, there are significant variations in the duty-free access granted to Asia-Pacific LDC exporters across various groups of products. Agricultural products have maintained a high proportion of duty-free access, but were nevertheless surpassed by industrial products whose duty-free proportion rose sharply in the late 1990s. Clothing exported from LDCs gets only limited duty-free treatment – less than 60 per cent of imports from Asia-Pacific LDCs were accepted duty-free in the period of 1996 to 2007. In contrast, the product group of textiles (intermediate goods) records an increase in the proportion of duty-free access, especially after 2001, but still trails industrial and agricultural products.
%
-60 -40 -20 0 20 40 60
Afghanistan
Figure 3. Variations across products for Asia-Pacific LDCs duty-free access in the developed country markets (in percentage)
Source: compiled using data provided by UNCTAD, ITC and WTO, available at www.mdg- trade.org
Figure 4. Tracking exports of the LDCs of the Asia-Pacific region (all products except arms) admitted to developed country markets duty-free (in percentage)
Source: Annex I, compiled using data provided by UNCTAD, ITC and WTO, available at www.mdg-trade.org
Over the past decade, several advanced developing countries have also started providing unilateral market access preferences to LDCs. This is a significant development in the context of increased South-South trade especially in the Asia-Pacific region (UNCTAD, 2008). The Republic of Korea, China and India have now all instituted duty-free tariff preference schemes for LDCs.11
The difficulty of unilateral preferential schemes is that this status is enjoyed on a non-reciprocal basis, with the duration, extent in terms of preferential margins and sectoral coverage depending on the policies of the granting countries. These case-by-case rules provide no stability or predictability for LDCs, and can therefore not substitute for WTO membership.
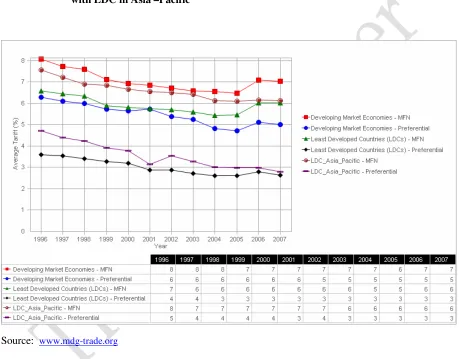
As a result of both WTO membership and the proliferation of preferential trade agreements, tariffs applicable to LDC exports have decreased significantly over the past 10 years. The tables in Annexes II, III and IV detail the information on average tariffs (both MFN and preferential rates) imposed by developed countries on four separate categories of export products of Asia-Pacific LDCs: agricultural products, industrial products, textiles, and clothing. Figure 5 compares the developments in MFN and preferential tariff rates for all products for three country categories - developing market economies, all LDCs and LDCs in Asia and the Pacific. It illustrates that progress in the reduction of MFN tariffs for all groupings halted in 2004, and that only preferential tariffs continued to fall for LDCs. At this highly aggregated level of trade,
11
this implies that LDCs were able to improve margins of preference vis-à-vis developing countries at large in the developed countries markets. Asia-Pacific LDCs face higher preferential tariffs on all product categories than all LDCs on average, and in the case of industrial tariffs face higher tariffs than all developed market economies, indicating that they are perceived as more competitive than the other LDCs. However, since 2004, the advantage of other LDCs has eroded to the point where by 2007, the preferential tariff rate difference was practically insignificant.
Figure 5. Average Tariffs Imposed by Developed Market Economies on All Products except Arms from Developing and Least Developed Countries, as compared with LDC in Asia –Pacific
Source: www.mdg-trade.org
Figure 6. Average Tariffs Imposed by Developed Market Economies on Agricultural Products from Developing and Least Developed Countries, as Compared with LDC in Asia –Pacific
Figure 7. Average Tariffs Imposed by Developed Market Economies on Industrial Products from Developing and Least Developed Countries, as Compared with LDC in Asia-Pacific
Source: www.mdg-trade.org
Growth of LDC exports
While the above analysis on market access for LDCs appears encouraging, the reality of exports by LDCs is less so. Indeed, while market access has improved over the past decade, the share of exports of Asian LDCs as part of all world exports remains very low and has shown little growth over the past decade (Table 5): exports from the world’s 49 LDCs account for barely over 1 per cent of world trade. This data suggests that factors beyond market access must be limiting LDCs’ exports. Part IV examines Aid for Trade as one of the factors that is most likely to influence export growth.
Table 5. LDCs remain marginalized in world trade
2001 2006 2008 2001 2006 2008
Merchandise (%) Services (%)
LDCs 0.58 0.86 1.07 0.5 0.5 0.5
LDCs Asia 0.24 0.25 0.24 0.16 0.14 0.15
Developing
countries 25.5 32 33.5 18.9 21.8 22
[image:18.595.63.515.625.710.2]IV. Improving supply-side conditions: increasing Aid for Trade
As the limitations of preferential market access have become apparent and the effectiveness of traditional forms of aid has been challenged, more emphasis has been placed on addressing trade-capacity constraints in developing countries through Aid for Trade. The Hong Kong WTO Ministerial Declaration of 2005 adopted the goal of increasing trade competitiveness on the supply side, including through so-called Aid for Trade. Such aid often seeks to alleviate common hurdles developing countries such as high trade costs, need for infrastructure and low competitiveness. Aid for Trade usually targets one or several of the following areas:
1) Productive capacity (including trade development): investing in industries and sectors so that countries can diversify exports and build on comparative advantages;
2) Infrastructure: building the roads, ports, and telecommunications that link domestic and global markets;
3) Technical assistance: helping countries to develop trade strategies, negotiate more effectively, and implement outcomes; and
4) Adjustment assistance: helping with the costs associated with tariff reductions, preference erosion, or declining terms of trade.
Data on Aid for Trade
At present, the most advanced tracking of Aid for Trade flows is conducted by the OECD and the WTO. In their report Aid for Trade at a Glance 2009, Aid for Trade is tracked by four monitoring and evaluation mechanisms that are composed of partner self-assessment, donor self-assessment, global aid for trade flows and performance indicators. The traditional Creditor Reporting System (CRS) database of the OECD, which covers 90% of all ODA flows and has the most reliable and longest ranging database, has less detailed information in trade-related technical assistance and trade development.
Recipients of Aid for Trade
According to the data in OECD/WTO’s Aid for Trade at a Glance 2009, Asian countries received 45.1 per
Table 6. Top ranked recipients of Aid for Trade in 2007
Top AfT recipients in 2007 Share in total AfT (%) Rank in the world
India 7.7 1
Viet Nam 6.6 2
Afghanistan 5.3 3
(Iraq) 4.4 4
Indonesia 3 6
Bangladesh 2.6 9
Top Asian developing countries (total
share) 29.6
On the recipient side, eight of the LDCs of Asia and the Pacific have adopted formal policies to increase their competitiveness in trade. Bangladesh, Cambodia, Myanmar and Nepal are fully mainstreaming trade policy objectives into their national development strategies, while Afghanistan, Lao PDR, Maldives and Vanuatu are take initial steps in that direction.
Figure 8. Aid for trade: regional and sector distribution, 2002-2005 average, 2006, 2007
[image:20.595.101.494.466.653.2]Table 7 below shows recent Aid for Trade flows into countries in Asia and the Pacific as well as the sub-categories they were allocated to. These four sub-sub-categories are trade policy and regulations, economic infrastructure, building productive capacity and trade related adjustments. In 2007, the countries in Asia and the Pacific received Aid for Trade commitments averaging US$136.2 million; however, as shown in Figure 9, the percentage of disbursements is quite small at an average 52.7 per cent. Five countries, Afghanistan, Cambodia, Myanmar, Nepal and Samoa were able to receive close to or above the committed amount of aid (Afghanistan, Nepal and Samoa received 181.8 per cent, 146.1 per cent and 127.2 per cent of pledged commitments, respectively). In contrast, two countries, Bangladesh and Lao PDR, receive none of the committed aid, while Maldives, the country benefiting from the largest commitment of Aid for Trade, received only 25.4 per cent of the committed aid. More research is required to explain this data.
Table 7. Distribution of Aid for Trade-Commitments and Disbursements in million USD in 2007 (based on 2006 constant price)
Commitments/ Disbursement
Total Trade Policy & Regulations (e.g. trade facilitation, regional trade agreements, multilateral trade negotiations) Economic Infrastructure (e.g. transport, communications, energy supply) Building Productive Capacity (e.g.
financial services, business, industry, agriculture, tourism) Trade-Related Adjustment (e.g. budget support for trade reforms and adjustments)
Asia 10,723.5 - 168.2 - 5,948.0 - 4,607.2 - 0.0 -
Oceania 274.3 - 2.6 - 184.0 - 884..0 - 3.7 -
AVG. LDCs in AP
136.2 71.8 1.8 1.4 52.6 30.9 80.3 38.6 0.06 0.85
Afghanistan 23.6 42.9 1.1 1.3 7.7 24.6 14.8 17.1 - -
Bangladesh 13.8 0.0 0.1 0.0 - - 13.7 - - -
Cambodia 145.1 116.4 8.3 1.5 84.2 50.2 52.5 57.9 0.0 6.8
Lao PDR 62.2 1.2 0.2 0.2 45.7 0.5 6.2 0.5 - -
Maldives 653.6 166.2 2.8 0.3 227.1 94.4 423.6 71.5 - -
Myanmar 27.3 25.7 1.0 1.0 2.6 7.1 23.7 17.6 - -
Nepal 69.4 101.4 0.4 2.1 50.6 28.4 48.3 70.9 - -
Samoa 94.5 120.2 0.8 4.8 33.2 42.1 59.9 73.3 0.5 -
Source: OECD Creditor Reporting System
Figure 9. Total disbursement ratio of Aid for Trade to Asia Pacific’s LDCs in 2007
Total Disbursement Ratio
0 20 40 60 80 100 120 140 160 180 200
[image:22.595.132.485.142.377.2]Afghanistan Bangladesh Cambodia Lao PDR Maldives Myanmar Nepal Samoa
Figure 10. Aid for Trade Disbursement Ratio for Trade Policy and Regulations in 2007
Trade Policy & Regulations Disbursement Ratio
0 100 200 300 400 500 600 700
Figure 11. Aid for Trade Disbursement Ratio for Economic Infrastructure in 2007
0 50 100 150 200 250 300 350
Afghanistan Bangladesh Cambodia Lao PDR Maldives Myanmar Nepal Samoa
Figure 12. Aid for Trade Disbursement Ratio for Building Productive Capacity in 2007
0 20 40 60 80 100 120 140 160
Afghanistan Bangladesh Cambodia Lao PDR Maldives Myanmar Nepal Samoa
In addition to the above documented Aid for Trade flows, a number of projects for improving trade competitiveness in Asia and the Pacific have been implemented through international organizations such as the Asian Development Bank or the United Nations Economic and Social Commission for Asia and the Pacific (ESCAP). Such projects include Greater Mekong Subregion programs which have invested in strengthening transport corridors.
[image:23.595.142.450.348.526.2]V. Conclusions and Policy Recommendations
On Market Access
• The LDCs of Asia and the Pacific have fared relatively well, especially as compared to LDCs in
other regions: in the aggregate, they receive broader duty-free access and more Aid for Trade than LDCs in other regions. Still, as tariffs in most areas have fallen overall, the preferential access that LDCs had previously enjoyed has been to some extent eroded.
• While duty-free and quota-free access is important, attention must also be given to non-tariff and non-border measures, such as sanitary and phyto-sanitary measures, which frequently restrict LDC exports in the areas of agricultural products and industrial goods. More transparency is needed to determine the number and extent of non-tariff barriers used by developed countries to limit imports from developing countries and LDCs.
• Despite the improved market access provided by developed countries, the share of LDC exports in
world exports remains flat: LDCs have made few actual gains in world markets. This trend may be explained in part by the increasing competition some LDCs now face for their main exports (such as ready-made garments) by countries like China. In addition, the current global economic crisis has highlighted the vulnerability of economies such as Cambodia’s which rely heavily on a limited number of export items. Aid for Trade should assist these and other countries to achieve greater stability through export diversification.
• The current targets and indicators fail to address services trade, which has become increasingly competitive for developing countries and may in the future become a revenue earner for LDCs as well.
• The data compiled by the OECD and WTO does not adequately reflect the rise of aid and
preferential treatment schemes offered by developing countries (including Republic of Korea, China and India) to LDCs. With rising South-South trade especially in Asia and the Pacific, such preferences gain increasing significance and warrant further research.
On Aid for Trade
• Over the past few years, Aid for Trade as a sub-set of official development assistance has become entrenched, and the different categories of Aid for Trade have become affirmed. As a result, data availability is improving. This trend should be encouraged, as it helps donors and recipients to formulate effective aid and trade policies.
• The importance of Aid for Trade, and in particular the subset Aid for Trade Facilitation, is now widely recognized, especially for geographically disadvantaged countries. In addition, research suggests that trade policy formulation can positively affect domestic governance, such as overall market transparency and corruption.
• In the context of the global economic crisis, an overwhelming challenge is to maintain momentum
References
Asian Development Bank (2009).Aid for Trade in the Asia and the Pacific: An Update (Manila: ADB).
ESCAP (2009).Statistical Yearbook for Asia and the Pacific (Bangkok: United Nations).
Global Trade Alert (2009).The Unrelenting Pressure of Protectionism: The Third GTA Report, available
at www.globaltradealert.org (London: Centre for Economic Policy Research).
Khan, Mostafa Abid and Farhad, Mohammad (2009). “Duty-free market access in the Republic of Korea: Potential for least developed countries and Bangladesh” ARTNeT Working Paper Series, No. 62, March, available at http://www.unescap.org/tid/artnet/pub/wp6209.pdf
Mikic, Mia and Qiu, Ying (2006).Is there a Need for “Market Access” Plus Indicators? in Asia-Pacific Trade and Investment Review, Vol. 2, No. 2, December (Bangkok: United Nations).
OECD/WTO (2009).Aid for Trade at a Glance 2009: Maintaining Momentum.(Paris: OECD)
Ratna, Rajan Sudep (2009). “Promoting South-South Trade: Recent Developments and Options” ARTNeT Policy Brief No.17, available at http://www.unescap.org/tid/artnet/pub/polbrief17.pdf
UNCTAD (2008),South-South Trade in Asia: the Role of Regional Trade Agreements (Geneva: United Nations).
UNDP (2009). Aid For Trade and Human Development (New York: UNDP).
UNDP (2009). Human Development Report 2009 (New York: UNDP).
UNDP Regional Centre in Colombo (2008). South-South Regionalism and Trade Cooperation in the Asia-Pacific Region (Colombo: UNDP).
United Nations (2008).Delivering on the Global Partnership for Achieving the Millennium Development Goals. MDG Gap Task Force Report 2008 (New York: United Nations).
United Nations (2009). Strengthening the Global Partnership for development in a Time of Crisis. MDG Gap Task Force Report 2009 (New York: United Nations)
World Economic Forum (2009).The Global Competitiveness Report 2009-2010 (Geneva: World
Economic Forum).
WTO (2009). “Report from the Director-General to the Trade Policy Review Body on the Financial and Economic Crisis and Trade Related Developments”, JOB(09)/30, 26 March, available at www.wto.org
Websites
OECD CRS: www.oecd.org/dac/stats/idsonline
UN ESCAP: www.mdgasiapacific.org
UNDP: www.undp.org/mdg
MDG-TRADE: www.mdgmonitor.org/goal8.cfm
Annex
Annex 1. Proportion of Total Developed Country Imports (By Value And Excluding Arms) From Developing Countries And From The Least Developed Countries, Admitted Free of Duty (in percentage) ...26 Annex 2. Average Tariffs Imposed By Developed Countries on Agricultural Products From
Developing Countries ...27 Annex 3. Average Tariffs Imposed By Developed Countries on Industrial Products From
Developing Countries ...28 Annex 4. Average Tariffs Imposed By Developed Countries on Textiles From Developing
Countries...29 Annex 5. Average Tariffs Imposed By Developed Countries on Clothing From Developing
Annex I. Proportion of total developed country imports (by value and excluding arms) from developing countries and from the least developed countries, admitted free of duty (in percentage)
1996 1997 1998 1999 2000 2001 2002 2003 2004 2005 2006 2007
Developing Market Economies
54.20 55.28 54.22 63.23 64.91 63.98 68.52 70.82 75.80 75.89 77.18 78.98
Least Developed Countries (LDCs)
77.62 76.80 77.72 72.22 69.85 70.70 73.91 77.52 80.25 80.39 79.06 79.81
LDCs -Asia 54.23 56.41 54.65 53.21 53.39 55.18 52.16 59.03 64.94 62.16 65.12 65.80
Afghanistan 85.38 90.40 90.65 86.47 99.34 98.04 68.86 92.56 99.21 99.63 99.80 99.62
Bangladesh 57.27 55.95 56.77 57.11 57.51 58.44 61.20 70.38 74.65 70.91 71.80 71.55
Bhutan 88.90 81.24 90.10 66.35 81.14 40.45 77.44 82.49 92.76 89.62 90.74 95.85
Cambodia 94.09 61.67 36.11 34.05 31.74 34.54 34.77 36.89 41.41 34.93 34.69 35.07
Kiribati 33.80 42.31 51.42 19.39 8.34 6.02 8.77 6.52 34.15 67.45 59.01 98.87
Laos PDR 82.55 83.44 82.20 87.02 90.08 96.25 95.65 95.79 97.39 97.82 95.02 93.01
Maldives 25.08 15.48 12.54 26.73 23.93 24.44 22.17 21.83 28.61 62.80 75.52 99.86
Myanmar 50.27 53.15 51.82 50.22 46.75 51.74 18.78 27.91 33.83 51.89 52.05 63.19
Nepal 63.30 62.23 56.45 51.51 44.15 44.61 44.78 43.19 61.45 71.02 75.59 80.63
Samoa 99.80 99.95 99.42 99.64 98.78 98.54 96.92 97.88 98.65 99.47 99.41 99.76
Solomon Islands 77.09 79.57 70.59 67.70 74.37 72.24 69.46 72.83 78.68 98.93 99.38 100.00
Timor-Leste 72.13 99.18 99.78 98.02 98.44 96.38 86.35 87.40 99.61 92.54 99.99 99.99
Tuvalu 100.00 100.00 100.00 100.00 96.66 97.37 100.00 100.00 100.00 99.85 99.78 100.00
Vanuatu 57.48 81.14 83.92 77.50 59.36 81.09 76.52 58.17 57.91 55.78 30.03 99.95
Source: Compiled using UNCTAD/ITC/WTO data available at www.mdg-trade.org.
Annex II . Average tariffs imposed by developed countries on agricultural products from developing countries
1996 1997 1998 1999 2000 2001 2002 2003 2004 2005 2006 2007
MFN Prefe renti al
MFN Prefe renti al
MFN Prefe renti al
MFN Prefe renti al
MFN Prefe renti al
MFN Prefe renti al
MFN Prefe renti al
MFN Prefe renti al
MFN Prefe renti al
MFN Prefe renti al
MFN Prefe renti al
MFN Prefe renti al Developing
Market Economies
12.95 10.42 12.16 9.88 12.13 9.87 11.07 9.46 10.70 9.24 10.69 9.17 11.07 9.42 11.03 9.38 11.29 9.10 11.15 8.81 10.80 8.52 10.69 8.35
All LDCs 7.12 3.95 6.74 3.88 6.66 3.67 5.37 3.76 5.26 3.71 5.27 2.74 5.24 2.81 5.24 2.81 5.40 3.15 5.51 3.09 5.41 2.78 5.41 2.06
Afghanistan 2.48 2.43 2.54 2.48 2.53 2.48 2.52 2.40 2.51 2.39 2.51 2.36 2.24 1.95 2.23 1.94 0.84 0.42 0.84 0.42 0.86 0.42 0.86 0.26
Bangladesh 10.15 7.26 9.94 7.18 9.78 6.03 9.57 5.61 9.34 5.49 9.34 3.74 10.22 3.56 10.25 3.50 10.50 3.96 10.60 3.58 11.40 3.95 10.75 3.40
Bhutan 23.89 19.23 22.74 18.24 22.54 16.46 20.37 12.47 19.94 12.13 19.93 4.28 13.63 3.68 14.13 3.70 16.80 7.30 14.87 4.95 16.82 6.92 17.50 5.04
Cambodia 6.80 5.57 6.51 5.66 6.18 4.86 4.70 2.37 4.58 2.28 4.57 0.39 12.28 0.26 12.28 0.29 12.47 0.46 12.41 0.33 12.49 0.42 12.54 0.31
Kiribati 7.39 2.05 7.02 1.88 6.84 1.72 5.86 1.72 5.69 1.69 5.69 0.70 6.28 1.27 6.30 1.24 5.42 1.07 5.41 1.05 5.38 1.04 5.36 0.01
Laos PDR 2.92 1.19 2.53 1.18 2.50 1.10 1.40 0.90 1.37 0.88 1.37 0.67 1.36 0.75 1.35 0.75 1.01 0.40 0.95 0.34 0.84 0.35 1.03 0.26
Maldives 9.60 6.60 9.30 6.56 9.18 6.35 8.71 7.05 8.44 6.68 8.44 5.70 8.32 5.83 8.30 5.81 8.34 5.83 9.15 6.65 9.16 6.65 8.34 5.68
Myanmar 11.64 11.39 9.24 9.06 9.06 8.88 10.19 9.74 9.30 8.86 9.38 5.94 9.13 9.07 9.41 9.27 9.70 9.55 9.78 9.57 10.75 10.40 10.69 8.46
Nepal 3.49 2.44 3.40 2.38 3.41 2.27 9.19 1.05 2.93 1.00 2.91 0.81 3.47 0.88 3.40 0.84 3.49 1.39 3.51 1.38 3.75 1.01 3.84 0.25
Samoa 12.21 3.32 11.54 3.24 11.42 3.04 9.81 3.71 9.57 3.49 9.57 1.84 9.75 1.87 9.84 1.82 9.61 1.62 9.56 1.60 9.98 1.61 9.91 0.39
Solomon Islands 8.39 2.91 7.93 2.82 7.78 2.66 6.40 2.42 6.20 2.59 6.20 2.50 5.68 2.35 5.68 2.36 5.68 2.28 5.70 2.14 5.71 2.15 5.69 2.00
Timor-Leste 1.83 1.83 1.42 1.42 1.40 1.40 0.15 0.15 0.14 0.14 0.14 0.14 0.93 0.93 0.95 0.94 0.95 0.81 0.96 0.74 0.84 0.61 0.58 0.29
Tuvalu 4.35 3.69 4.21 3.60 4.06 2.42 3.81 0.06 3.64 0.05 3.64 0.05 5.78 0.91 5.78 0.91 5.80 0.81 5.53 0.81 5.53 0.81 4.74 0.66
Vanuatu 15.95 12.10 15.16 12.16 15.16 11.91 12.42 9.92 12.28 9.90 12.28 2.21 11.67 2.17 11.58 2.15 11.76 1.99 11.82 1.88 11.82 1.84 11.77 0.72
Source: Compiled using UNCTAD/ITC/WTO data available at www.mdg-trade.org.
Annex III. Average tariffs imposed by developed countries on industrial products from developing countries
1996 1997 1998 1999 2000 2001 2002 2003 2004 2005 2006 2007
MFN Prefe renti al
MFN Prefe renti al
MFN Prefe renti al
MFN Prefe renti al
MFN Prefe renti al
MFN Prefe renti al
MFN Prefe renti al
MFN Prefe renti al
MFN Prefe renti al
MFN Prefe renti al
MFN Prefe renti al
MFN Prefe renti al Developing
Market Economies
3.25 1.97 3.23 1.95 2.86 1.72 2.38 1.46 2.29 1.40 2.28 1.49 2.19 1.28 2.15 1.24 2.10 1.14 2.08 1.11 2.06 1.10 1.92 0.99
All LDCs* 3.77 1.14 3.77 0.94 3.61 0.89 3.40 0.35 3.38 0.35 .3.38 0.16 3.22 0.30 3.24 0.27 3.22 0.27 3.20 0.27 3.19 0.26 3.21 0.23
Afghanistan 16.03 15.12 16.00 15.01 15.86 14.90 15.59 14.90 15.59 14.90 15.58 14.84 13.07 12.30 13.01 12.18 1.60 0.14 1.57 0.12 1.48 0.10 1.38 0.04
Bangladesh 6.36 3.11 6.24 3.00 5.52 2.74 5.63 0.74 5.56 0.73 5.48 0.65 5.40 0.66 5.42 0.53 5.42 0.54 5.41 0.53 5.41 0.53 5.37 0.49
Bhutan 2.89 0.70 2.86 0.56 2.19 0.51 2.05 0.50 1.86 0.49 1.84 0.47 1.88 0.48 1.88 0.44 1.87 0.44 1.86 0.44 1.88 0.43 1.80 0.42
Cambodia 17.34 8.91 17.47 7.85 13.58 7.31 16.76 6.85 16.54 6.80 16.31 6.61 16.07 6.63 16.04 6.20 16.03 6.20 15.96 6.18 15.96 6.17 16.08 6.00
Kiribati 6.32 0.67 6.28 0.63 6.23 0.58 6.12 4.73 6.12 4.73 6.12 0.53 1.94 0.54 1.94 0.54 1.94 0.54 1.93 0.54 1.93 0.54 1.95 0.02
Laos PDR 13.46 10.61 13.45 10.30 12.43 10.24 13.04 10.21 12.98 10.20 12.92 10.00 15.49 12.84 15.48 12.72 8.88 6.12 8.89 6.14 5.51 2.77 5.43 2.71
Maldives 9.55 8.21 9.53 8.18 9.30 8.11 9.28 3.72 9.27 3.68 9.28 2.81 7.17 2.25 7.17 2.25 7.16 2.24 7.15 2.24 7.16 2.24 5.55 1.04
Myanmar 4.12 2.45 4.45 2.71 3.37 2.25 3.64 0.95 3.62 0.94 3.58 0.81 3.52 2.50 3.55 2.43 3.56 2.46 3.55 2.46 3.54 2.01 3.31 2.24
Nepal 3.87 0.53 3.62 0.51 3.39 0.50 2.97 0.48 2.93 0.48 2.91 0.12 2.43 0.18 2.37 0.16 2.32 0.17 2.31 0.16 2.46 0.23 2.45 0.23
Samoa 3.01 0.45 3.00 0.45 2.98 0.44 2.78 0.65 2.77 0.65 2.77 0.05 2.51 0.40 2.51 0.40 2.52 0.40 2.43 0.40 2.43 0.40 2.43 0.35
Solomon Islands 6.00 2.18 5.97 1.45 5.90 1.43 5.84 2.64 5.83 2.62 5.84 1.35 4.41 1.31 4.40 1.30 4.39 1.30 4.39 1.29 4.38 1.29 4.38 1.09
Timor-Leste 2.29 2.22 2.26 2.20 1.92 1.89 1.04 1.01 0.96 0.94 0.96 0.93 1.30 1.27 1.30 1.26 1.27 0.86 1.24 0.80 1.20 0.73 1.20 0.25
Tuvalu 3.62 2.01 3.39 1.38 3.15 0.34 2.82 0.17 2.76 0.17 2.65 0.10 3.05 0.40 3.12 0.38 3.07 0.33 2.98 0.26 2.97 0.26 3.00 0.27
Vanuatu 2.68 0.33 2.63 0.31 2.59 0.27 2.50 1.22 2.49 1.22 2.49 0.24 1.71 0.32 1.71 0.32 1.72 0.33 1.72 0.32 1.72 0.32 1.76 0.08
Source: Compiled using UNCTAD/ITC/WTO data available at www.mdg-trade.org.
Annex IV. Average tariffs imposed by developed countries on textiles from developing countries
1996 1997 1998 1999 2000 2001 2002 2003 2004 2005 2006 2007
MFN Prefe renti al
MFN Prefe renti al
MFN Prefe renti al
MFN Prefe renti al
MFN Prefe renti al
MFN Prefe renti al
MFN Prefe renti al
MFN Prefe renti al
MFN Prefe renti al
MFN Prefe renti al
MFN Prefe renti al
MFN Prefe renti al Developing
Market Economies
9.25 7.28 9.14 7.19 8.89 6.96 8.42 6.59 8.28 6.55 8.11 6.60 7.66 5.98 7.46 5.81 7.32 5.16 7.24 5.25 7.24 5.19 7.21 5.05
All LDCs* 7.66 4.58 7.57 4.55 7.34 4.38 6.93 4.27 6.78 4.12 6.63 3.84 6.72 3.81 6.56 3.50 6.22 3.20 6.23 3.21 6.24 3.19 6.19 3.14
Afghanistan 21.28 19.10 21.21 19.10 21.18 19.09 20.84 19.09 20.81 19.07 20.74 17.84 21.93 17.87 21.82 17.81 4.44 0.50 4.70 0.50 4.70 0.49 4.69 0.49
Bangladesh 8.19 4.59 8.00 4.48 7.72 4.28 7.33 4.17 7.19 3.98 7.04 3.28 6.89 3.73 6.75 3.21 6.62 3.13 6.53 3.14 6.53 3.14 6.52 3.05
Bhutan 8.12 3.99 8.07 3.95 7.92 3.82 7.77 3.70 7.61 3.56 7.44 2.44 7.18 3.18 6.97 2.61 6.79 2.47 6.76 2.47 6.76 2.47 6.75 2.47
Cambodia 9.92 6.11 9.77 6.01 9.43 5.67 8.97 5.52 8.81 5.29 8.64 4.53 8.45 4.82 8.29 4.23 8.15 4.13 8.00 4.08 8.00 4.08 8.03 4.02
Kiribati 14.29 8.16 14.24 8.11 13.98 7.91 12.91 7.94 13.98 9.07 13.37 8.00 12.80 7.73 12.19 7.41 11.64 6.96 11.61 6.96 11.62 6.94 11.61 6.94
Laos PDR 25.33 20.50 25.18 20.45 25.06 20.35 24.79 20.31 24.73 20.25 24.64 19.90 24.34 19.86 24.12 19.26 8.11 3.31 8.04 3.31 7.97 3.24 7.85 3.12
Maldives 6.55 4.40 6.45 4.34 6.10 4.10 5.51 3.93 5.39 3.68 5.26 2.72 5.43 3.19 5.31 .3.04 5.20 3.00 5.24 3.02 5.24 2.95 5.19 2.79
Myanmar 9.14 5.05 9.05 5.28 8.84 5.08 8.39 4.99 8.27 4.89 8.14 4.40 7.63 6.73 7.44 6.47 7.41 6.43 7.38 6.43 7.38 5.91 7.36 6.40
Nepal 4.97 2.73 4.91 2.73 4.75 2.63 4.32 2.54 4.16 2.42 4.02 0.96 5.11 0.87 4.88 0.73 4.68 0.63 4.79 0.63 5.23 0.63 5.22 0.63
Samoa 7.80 3.27 7.72 3.25 7.53 3.11 7.32 2.97 7.16 2.87 6.87 2.14 6.69 2.57 6.60 2.21 6.39 2.09 6.29 2.09 6.29 2.09 6.14 1.99
Solomon Islands 14.69 10.03 14.55 9.64 14.06 9.18 13.39 9.00 13.15 8.81 12.84 7.83 12.48 7.89 12.10 7.50 11.75 7.35 10.00 5.75 9.99 5.74 11.68 7.42
Timor-Leste 8.30 8.14 8.22 8.05 7.94 7.82 7.52 7.39 7.33 7.20 7.11 7.00 6.83 6.72 6.92 6.81 6.84 5.63 6.73 4.20 6.70 3.82 6.63 2.86
Tuvalu 10.02 4.50 9.91 4.49 9.71 4.40 9.02 4.15 8.87 4.08 8.67 3.27 8.33 4.48 7.95 2.99 7.63 3.57 7.24 2.37 7.24 2.37 7.24 2.37
Vanuatu 18.08 13.36 17.94 12.79 17.28 12.09 16.58 11.86 16.29 11.63 15.92 10.65 15.52 10.42 15.02 9.91 14.66 9.73 11.98 7.26 11.98 7.26 14.45 9.73
Source: Compiled using UNCTAD/ITC/WTO data available at www.mdg-trade.org.
Annex V . Average tariffs imposed by developed countries on clothing from developing countries
1996 1997 1998 1999 2000 2001 2002 2003 2004 2005 2006 2007
MFN Prefe renti al
MFN Prefe renti al
MFN Prefe renti al
MFN Prefe renti al
MFN Prefe renti al
MFN Prefe renti al
MFN Prefe renti al
MFN Prefe renti al
MFN Prefe renti al
MFN Prefe renti al
MFN Prefe renti al
MFN Prefe renti al Developing
Market Economies
14.06 11.42 13.93 11.33 13.77 11.17 13.44 10.88 13.16 10.75 12.97 11.27 12.45 10.02 12.15 9.65 11.90 8.58 11.76 8.30 11.76 8.23 11.80 8.181
All LDCs* 14.05 8.13 13.95 8.12 13.83 8.01 13.50 7.90 13.36 7.78 13.26 7.68 13.10 7.43 12.93 6.97 12.31 6.42 12.29 6.41 12.29 6.41 12.29 6.42
Afghanistan 46.56 42.19 46.45 42.13 46.34 42.04 46.21 42.02 46.11 41.91 46.01 41.38 45.84 41.79 45.76 41.12 11.02 6.46 10.92 6.46 10.92 6.46 10.92 6.46
Bangladesh 13.88 7.88 13.75 7.83 13.52 7.69 13.28 7.59 13.05 7.43 12.83 7.24 12.61 7.16 12.38 6.38 12.15 6.30 12.04 6.29 12.04 6.29 12.05 6.29
Bhutan 14.94 8.78 14.73 8.73 14.48 8.53 14.18 8.39 13.93 8.22 13.66 7.99 13.45 7.29 13.21 7.07 12.98 7.02 12.88 6.95 12.88 6.95 12.88 6.95
Cambodia 13.62 7.52 13.49 7.47 13.32 7.32 12.99 7.23 12.77 7.09 12.54 6.90 12.32 6.82 12.10 6.05 11.87 5.97 11.77 5.97 11.76 5.97 11.76 5.97
Kiribati 15.06 9.37 14.88 9.33 14.71 9.24 14.43 9.16 14.27 9.08 14.11 8.06 13.92 8.00 13.76 7.96 13.60 7.49 13.51 7.49 13.51 7.49 13.51 7.49
Laos PDR 41.88 35.75 41.75 35.70 41.65 35.64 41.41 35.61 41.28 35.56 41.14 35.49 41.04 35.55 40.90 34.86 12.55 6.66 12.46 6.67 12.45 6.67 12.46 6.67
Maldives 12.61 6.69 12.48 6.64 12.30 6.48 11.99 6.37 11.78 6.24 11.56 6.09 11.33 6.01 11.11 5.22 10.90 5.15 10.79 5.15 10.79 5.15 10.79 5.15
Myanmar 14.64 8.57 14.50 8.52 14.31 8.38 13.99 8.27 13.75 8.10 13.54 7.94 13.34 11.53 13.09 11.11 12.88 10.99 12.76 10.96 12.76 10.96 12.76 10.96
Nepal 12.30 6.76 12.22 6.72 11.96 6.46 11.62 6.29 11.49 6.16 11.38 5.80 10.95 5.94 10.74 5.26 10.53 5.18 10.44 5.18 10.96 5.21 10.96 5.21
Samoa 13.64 6.69 13.52 6.68 13.30 6.57 12.89 6.45 12.63 6.33 12.39 6.20 12.07 5.93 11.83 5.58 11.57 5.47 11.47 5.47 11.47 5.47 11.47 5.46
Solomon Islands 14.54 7.89 14.41 7.93 14.19 7.72 13.79 7.58 13.51 7.42 13.21 7.26 12.91 7.12 12.64 6.54 12.33 6.40 12.23 6.40 12.23 6.40 12.64 6..50
Timor-Leste 12.44 12.38 12.38 12.33 11.85 11.82 11.30 11.26 10.92 10.88 10.50 10.47 10.05 10.01 10.03 10.00 9.64 8.92 9.62 6.44 9.74 5.11 9.42 2.87
Tuvalu 13.38 8.86 13.20 8.76 12.95 8.56 12.60 7.37 12.36 7.22 12.13 6.13 11.86 7.77 11.62 5.87 11.39 6.95 11.29 5.32 11.29 5.32 11.29 5.32
Vanuatu 16.98 10.38 16.85 10.36 16.65 10.27 16.28 10.18 16.03 10.05 15.83 9.97 15.60 9.88 15.34 9.30 15.13 9.25 15.03 9.23 15.03 9.23 15.03 9.23
Source: Compiled using UNCTAD/ITC/WTO data available at www.mdg-trade.org.