Active Noise Control in a Luxury
Vehicle
by
Nikos Zafeiropoulos
A thesis submitted in partial fulfillment for the degree of Doctor of Philosophy
in the
College of Science and Technology School of Computer Science and Engineering
ABSTRACT
COLLEGE OF SCIENCE AND TECHNOLOGY SCHOOL OF COMPUTING SCIENCE AND ENGINEERING
Doctor of Philosophy
ACTIVE NOISE CONTROL IN A LUXURY VEHICLE
by Nikos Zafeiropoulos
Glossary xxi
List of publications xxv
Acknowledgements xxvii
1 Introduction 1
1.1 Noise vibration and harshness attributes . . . 1
1.2 Interior road noise . . . 2
1.3 Passive control of structure-borne road noise . . . 5
1.4 Characteristics of structure-borne road noise . . . 6
1.5 Variability of structureborne road noise . . . 7
1.6 Active control of structure-borne road noise . . . 8
1.7 The evolution of active road noise control . . . 9
1.7.1 Principles of active noise control . . . 9
1.7.2 Introduction to feedback active road noise controllers. . . 10
1.7.3 Review of feedback active road noise controllers. . . 13
1.7.4 Introduction to feedforward active road noise controllers . 15 1.7.5 Review of feedforward active road noise controllers . . . . 17
1.8 Active control of engine noise and commercially available systems 23 1.9 Research objectives and contributions . . . 24
1.10 Thesis structure. . . 25
2 The sound field inside a vehicle 29 2.1 Introduction. . . 29
2.2 Chapter outline . . . 30
2.3 Acoustic frequency response functions . . . 30
2.3.1 Acoustic frequency response functions in a vehicle . . . . 30
2.3.2 Cabin acoustic responses for a volume velocity excitation 31 2.3.3 Electro-acoustic frequency response functions . . . 34
2.4 Electro-acoustics impulse responses . . . 39
2.5 Vibro-acoustic frequency response functions . . . 41
2.5.1 Structural mobility frequency response function. . . 41
2.5.2 Structural mobility matrix. . . 42
2.5.3 Vibro-acoustic frequency response functions . . . 46
2.5.4 Vibro-acoustic FRFs for impact forces on the front axle . 47 2.6 Methods for structure-borne road noise analysis . . . 50
2.6.2 Incoherent structural road sources . . . 54
2.7 Structureborne road noise responses . . . 56
2.8 Summary . . . 60
3 Physical simulator of road noise 63 3.1 Chapter outline . . . 64
3.2 Technique development of physical simulation of structure-borne road noise . . . 65
3.2.1 Quarter vehicle excitation . . . 65
3.2.2 Whole vehicle excitation . . . 67
3.2.3 Comparison between multiple coherence functions based on force and acceleration reference signals . . . 69
3.2.4 Comparison of road noise and simulated road noise with shaker . . . 74
3.3 Summary . . . 75
4 Signal analysis of road noise 77 4.1 Chapter outline . . . 78
4.2 Coherence analysis . . . 79
4.2.1 Introduction to road noise analysis . . . 79
4.2.2 Coherence analysis of quarter vehicle . . . 81
4.2.3 Coherence analysis of half vehicle. . . 83
4.2.4 Multiple coherence of whole vehicle. . . 85
4.3 Evaluation of a reduced set of acceleration signals. . . 86
4.3.1 Multiple coherence analysis . . . 86
4.3.2 Non-causal prediction of feedforward ARNC performance 89 4.4 Summary . . . 91
5 Road noise synthesis 93 5.1 Chapter outline . . . 94
5.2 Multiple reference LMS algorithm . . . 94
5.3 Road noise synthesis with multireference LMS algorithm . . . 95
5.4 Front subframe mounts as reference inputs to the system. . . 97
5.5 Rear subframe mounts as reference inputs . . . 98
5.6 Subframe mounts as references . . . 99
5.7 Control arms and subframe mounts as references . . . 101
5.8 Summary . . . 103
6 Active Road Noise Control 105 6.1 Chapter Outline . . . 106
6.2 Feedforward Active Road Noise Control . . . 106
6.2.1 MIMO Filtered reference LMS algorithm . . . 106
6.3 Active Road Noise Control strategy. . . 111
6.4 Comparison of reference sensor number and location . . . 111
6.5 Simulink model of ARNC . . . 112
6.5.1 One directions reference signals . . . 112
6.5.1.1 Case 1: Subframe mounts z-axis . . . 113
6.5.1.3 Case 3: Subframe mounts and suspension dampers
z-axis . . . 116
6.5.1.4 Case 4: Subframe rear mounts z-axis . . . 118
6.5.1.5 Case 5: Suspension and subframe only z-axis . . 120
6.5.2 Two directions reference signals. . . 122
6.5.2.1 Case 7: Front mounts z-axis and rear subframe rear mounts y,z-axis . . . 122
6.5.2.2 Case 8: Front mounts y,z-axis and rear subframe rear mounts z-axis . . . 123
6.5.2.3 Case 9: Front suspension y, z-axis and rear sub-frame rear mounts z-axis . . . 125
6.5.2.4 Case 10: Front suspension x, z-axis and rear sub-frame rear mounts z-axis . . . 128
6.5.3 Three directions reference signals . . . 129
6.5.3.1 Case 11: Front suspension x, y, z-axis and rear subframe mounts z-axis . . . 129
6.5.3.2 Case 12: Front subframe mounts x ,y, z-axis and front mounting point at the rear subframe only z-axis . . . 131
6.5.3.3 Case 13: Front subframe and damper top x, y, z-axis and rear subframe rear mounts z-axis. . . 133
6.5.3.4 Case 14: Subframe mounts 3-directions front axle and z-axis for rear axle . . . 135
6.5.3.5 Case 15: Subframe mounts 3-directions for front and rear axle . . . 137
6.5.3.6 Case 16: Reduced set of reference signals from subframe mounts. . . 139
6.5.3.7 Case 17: Reduced set of reference signals from subframe mounts with two reference locations at the rear axle . . . 140
6.6 Summary . . . 142
7 Active noise control experiments on a road-noise simulator 145 7.1 Chapter outline . . . 146
7.2 Experimental ARNC on a Bentley vehicle . . . 146
7.2.1 Purpose of ARNC physical simulation . . . 146
7.2.2 Real-time ARNC measurement setup on a Bentley vehicle 146 7.2.3 Structure of the real-time experimental study . . . 149
7.3 ARNC simulation: Excitation at the front tyres . . . 150
7.3.1 Experimental procedure for front tyres excitation . . . 151
7.3.2 Secondary path estimates . . . 152
7.3.3 Sensor arrangement on the front axle. . . 152
7.3.4 Case 1: Reference at the lower control arm and control filter lengthI=256 . . . 153
7.3.5 Case 2: Reference at the lower control arm and control filter lengthI=512 . . . 155
7.4 ARNC simulation: Excitation at the rear tyres . . . 160
7.4.1 Case 4: Reference at the rear subframe mount and control filter lengthI=512 . . . 161
7.4.2 Case 5: Reference at the rear subframe mount and control filter lengthI=1024 . . . 163
7.4.3 Case 6: Force signal as reference and control filter length I=512 and four error microphones . . . 165
7.4.4 Case 7: Reference at the front subframe mount and control filter lengthI=750 andfs=8 kHz . . . 168
7.4.5 Case 8: Reference at the front subframe mount and control filter lengthI=256 andfs=2 kHz . . . 169
7.4.6 Case study 9: Reference at the rear subframe mount and control filter lengthI=128 andfs=2 kHz . . . 171
7.5 ARNC physical simulation: Excitation at the four tyres . . . 174
7.5.1 Case study 10: Reference location at the rear subframe mount of the rear axle . . . 174
7.5.2 Case study 11: Reference accelerometer at the front sub-frame mount of the rear axle . . . 176
7.5.3 Case study 12: Reference accelerometer at the lower con-trol arm at the front axle . . . 178
7.5.4 Case study 13: Reference accelerometer at the lower con-trol arm at the front axle andfs=2 kHzI = 128-taps . . 180
7.6 Multichannel active road noise . . . 182
7.7 Summary . . . 185
8 Conclusion and future work 189 8.1 Summary . . . 189
8.2 Structure-borne road noise. . . 190
8.3 ARNC technology . . . 191
8.4 List of contributions in structure-borne road noise NVH . . . 193
8.5 List of contributions in ARNC technology . . . 194
8.6 Future work . . . 197
8.7 Concluding remarks . . . 199
A Appendix A 201 A.1 Instrumentation for NVH measurements . . . 201
A.2 Hardware arrangement for ARNC. . . 202
A.2.1 Audio amplifier . . . 202
A.2.2 Real-time controller: ADWin Gold II. . . 203
A.2.3 Real-time controller: Causal systems TigerANC Lite II . 204
1.1 Interior NVH sound attributes. Taken from [Williams (2014)].. . 2
1.2 Structure-borne and airborne paths into the vehicle’s cabin. Taken from [Cerrato (2009)]. . . 3
1.3 Structure-borne (SB) and airborne (AB) contributions to the in-terior noise spectrum at the driver’s headrest at 90 km/h. −: Total noise level, −: Structure-borne road noise contribution, −: Airborne road noise contribution. Taken from [Williams (2014)]. 3
1.4 Interior road noise at 90 km/h. −: Measured interior road noise at the driver’s headrest. −: Sum of airborne and structure-borne road noise contributions. −: Sum of other unreferenced noise contributions. . . 4
1.5 Interior road noise at 90 km/h. −: Measured interior road noise at the driver’s headrest. −: Sum of airborne, structure-borne and other noise contributions. . . 5
1.6 Variability in a vibro-acoustic path at measured at the driver’s headrest for 100 vehicles. Taken from [Kompella and Bernhard (1993)]. . . 7
1.7 Drawings of Paul Lueg’s apparatus.. . . 9
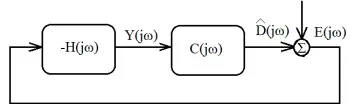
1.8 Block diagram of a single channel feedback ARNC system. E(ω): error input signal typically from a sensor at the cancelling point.
H(ω): control filter. Y(ω): control signal that drive the trans-ducer. D(ω): primary noise disturbance. ˆD(ω): estimated noise from the controller. . . 11
1.9 Feedback ARNC system of Honda Motors. Taken from [Sano et al. (2001)]. . . 12
1.10 Block diagram of a single channel feedforward ARNC system.
X(ω): reference input signals typically from a sensor at the noise source. H(ω): control filter. Y(ω): control signal that drive the transducer. D(ω): primary noise disturbance. ˆD(ω): estimated noise from the controller. . . 15
1.11 Alternative block diagram of a single channel feedforward ARNC system. . . 16
1.12 Block diagram of a single channel adaptive feedforward controller.
x(n): reference input signal typically from a sensor at the noise source. w(n): control filter. y(n): control signal that drive the transducer. d(n): primary noise disturbance. dˆ(n): estimated noise from the controller. c(n), ˆc(n): secondary path impulse and its estimate. e(n): error signal. . . 16
1.13 Feedforward ARNC system of Lotus-Harman. Taken from [Har-man (2014b)]. . . 17
2.1 Microphone and volume velocity arrangement for acoustic FRF measurement inside the cabin. s1, s2: volume velocity source
locations. . . 31
2.2 FRFs between two volume velocity source locations and the mi-crophones at the headrests. −: Dashboard corner. −: Driver’s pedal. . . 32
2.3 Coherences and FRFs between two volume velocity source loca-tions at the dashboard and the under the driver’s pedal and the two microphones at the rear headrests. The microphones loca-tions at the front headrests are noted as: LHR: Left hand rear. RHR: Rear hand rear. −: FRF.−: Coherence. . . 33
2.4 Loudspeaker and microphone placement inside the cabin. The LMS Siemens SCADAS DAQ systems was generating the white noise signals that was driving the audio amplifier and also mea-suring the microphone responses that were referenced back to the white noise signal, in order to obtain the electro-acoustic FRFs. The four loudspeakers are noted as s1, s2, s3, s4 and the twelve
microphones as m1,m2,m3, ..., m12. •: Microphone positions. 34
2.5 Magnitude and phase responses of FRFs between the left hand front (LHF) woofer and the microphones in the cabin. The mi-crophone positions are noted as LHFin/out: left hand front in-ner/outer, RHF: right hand front inin-ner/outer, LHR: left hand rear inner/outer RHR: right hand rear inner/outer. . . 35
2.6 Magnitude responses of FRFs between the right hand front (RHF) woofer and the microphones in the cabin. . . 36
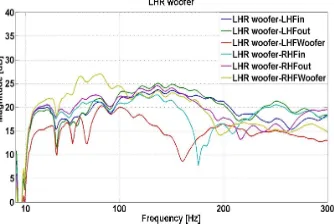
2.7 Magnitude responses of FRFs between the left hand rear (LHR) woofer and the microphones in the cabin. . . 37
2.8 Magnitude responses of FRFs between the right hand rear (RHR) woofer and the microphones in the cabin. . . 38
2.9 Magnitude responses of FRFs between the rear subwoofer and the microphones in the cabin. . . 39
2.10 Impulse response functions (IRFs) between the two front woofers and the microphones in the cabin. . . 40
2.11 Impulse responses between the two rear woofers and the micro-phones in the cabin. . . 41
2.12 Impulse response functions (IRFs) between subwoofer at the rear parcel self and the microphones in the cabin. . . 41
2.13 Multiple Input Multiple Output system (MIMO) that can be
de-scribed by mobility frequency response function. The forcesf1, f2, f3, ..., fi
are the inputs to the system and the velocity responsesv1, v2, v3, ..., vj
2.14 Local dynamic stiffness measured between the body side at the suspension damper top and the two suspension locations at the
z-axis. −: Dynamic stiffness at the excitation point on the body side. −: Dynamic stiffness between the excitation point on the body side and first control arm. −: Dynamic stiffness between the excitation point on the body side and second control arm. . . 46
2.15 Front axle with multilink suspension system. The main parts of the structure are highlighted that were also included in the impact FRF testing. . . 48
2.16 Vibro-acoustic FRFs between the excitation point on the front axle structure the four headrests microphones. . . 49
2.17 Source path receiver model (a): sources at the axle (b): receiver responses, (c): connections between the axle and the body struc-ture. The forces at various points on the axle are denoted as fa
and the forces at various connection points are presented as fc.
The vibration paths between the tyre and the connections are showed as transfer mobilities Yac and the point mobilities at the
connections are noted as Ycc. The vibro-acoustics paths between
the connections and the interior sound pressure Hcb and the
pri-mary paths of structure-borne noise are noted asHba. The error
between the estimated sound pressures, ˆpb and the measured road noise responses pb is denoted ase. . . 51
2.18 System diagram for Transfer Path Analysis and ARNC. fa: road
forces, Hba: vibro-acoustic paths, T: Structural transfer paths
from the source to the reference sensor locations, W: control fil-ter matrix, C: electro-acoustic paths from the loudspeakers to the microphones at the headrests,x: vibrational responses as ref-erence inputs to the controller, y: control signals that drive the loudspeakers in the cabin, pb, ˆpb: are the measured and synthe-sised road noise spectra and e: the residual error signals at the cancellation point in the cabin. . . 53
2.19 Interaction between various vibrational sources through structural transmission paths in a multisource environment. The vibrational responses at each source are notedui and the measured responses
by the sensors as vj. The stuctural paths between thei-inputs at
the sources and the j-output responses at the reference locations are noted as gij. . . 55
2.20 Physical installation of the accelerometers on the front axle. ◦: An accelerometer mounted on the wheel side. . . 56
2.21 Structure-borne road noise response at the interior in a Bentley Flying Spur measured at the four headrests positions and an ac-celeration response at one of the suspension arms at the front axle. The measurement was conducted at a rough surface for providing high excitation inputs at the tyres. −: 50 km/h,−: 60 km/h −: 80 km/h, −: 100 km/h. . . 57
2.22 Spectrograms of the four microphone responses at 50 km/h for a 20 dB(A) amplitude spam.. . . 58
2.24 Tyre cavity control, with a modified structural path at the front axle. −: Before passive treatment. −: After passive treatment. . 59
2.25 Tyre cavity resonant frequency drift over time and coast down speed sweep from 100 km/h to 50 km/h at the driver’s headrest. 60
3.1 Static test bench for physical simulation of structure-borne road noise. . . 66
3.2 Microphone responses at the four headrests for an input force from 0 to 250 Hz applied to the left hand front wheel. −: Microphone responses at the inbound facing side of the vehicle. −: Microphone responses at the outbound facing side of the vehicle. . . 67
3.3 Forces applied at the diagonal of the front tyres and the corre-sponding sound pressure responses at the headrests of the front seats.. . . 68
3.4 Forces applied to the diagonal of the rear tyres and the corre-sponding sound pressure responses at the headrests of the rear seats.. . . 69
3.5 Accelerometer locations at front and rear axles. The two front locations are symmetrical at the front suspension and one at the rear subframe mount at the rear axle. : One dimensional ac-celerometers . . . 70
3.6 Multiple coherence between two types of the vibration signals (forces and accelerations) and the microphones at the headrests.
−: Four forces as reference signals. −: Three acceleration as reference signals. . . 71
3.7 Accelerometer locations at front and rear axles. The two front locations are symmetrical at the front suspension and one at the rear subframe mount at the rear axle. . . 71
3.8 Multiple coherence between the vibration sensors (force gauges, accelerometers) and the microphones at the headrests. −: Four force signals as references. −: Five acceleration signals as references. 72
3.9 Five acceleration signals measured at the front and rear axle. . . 73
3.10 Comparison of interior noise at the four headrests. −: Simulated road noise with shaker transducers. −: Road noise measurement over a rough surface. . . 74
4.1 The road forces f result to vibrations that are measured by the accelerometer signals,x1,...,xk. The road noise responsedinside
the cabin is the superposition of all the output signals from the noise transfer paths. . . 79
4.2 Sensor arrangement on the vehicle. The red dots indicate the mea-surement locations of the sensors. Accelerometers were mounted close the front wheel and four microphones were measuring the noise at the headrests. . . 79
4.3 Measured and virtual uncorrelated power spectral densities of the left hand front suspension. . . 80
4.4 Front microphones responses and coherence functions at 60 km/h. 82
4.6 Coherence map between each accelerometer signals mounted at the front axle of the vehicle and the four microphones for a coast down from 100 km/h down to 60 km/h. . . 84
4.7 Coherence map between each accelerometer signals mounted at the rear axle of the vehicle and the four microphones for a coast down from 100 km/h down to 60 km/h. . . 85
4.8 Multiple coherence functions between the four microphones and three cases of accelerometer signal inputs. Black line:Whole vehi-cle acceleration signals. Blue line: Front axle acceleration signals. Red line: Rear axle acceleration signals. . . 86
4.9 Multiple coherence functions between the two front microphones and the four accelerometer signals at 60km/h. . . 87
4.10 Multiple coherence functions two rear microphones and the four accelerometer signals at 60km/h. . . 88
4.11 Multiple coherence functions between the two front microphones and the four accelerometer signals. at 100 km/h . . . 88
4.12 Multiple coherence functions between the two rear microphones and the four accelerometer signals at 100 km/h.. . . 89
5.1 Multireference adaptive filtering problem with adaptive FIR fil-ters. Taken from [Widrow et al. (1975)]. . . 97
5.2 Comparison between measured road noise spectra, synthesised/es-timated with LMS and the difference between them (error signal).
−: Road noise. −: Estimated front and rear subframe mount con-tribution. −: Estimation error. . . 98
5.3 Comparison between measured road noise spectra, synthesised/es-timated with LMS and the difference between them (error signal).
−: Road noise. −: Estimated front and rear subframe mount con-tribution. −: Estimation error. . . 99
5.4 Comparison between measured road noise spectra, synthesised/es-timated with LMS and the difference between them (error signal).
−: Road noise. −: Estimated front and rear subframe mount con-tribution. −: Estimation error. . . 100
5.5 Comparison between measured road noise spectra, synthesised/es-timated with LMS and the difference between them (error signal).
−: Road noise. −: Estimated front and rear subframe mount con-tribution. −: Estimation error. . . 101
5.6 Comparison between measured road noise spectra, synthesised/es-timated with LMS and the difference between them (error signal).
−: Road noise. −: Estimated front and rear subframe mount con-tribution. −: Estimation error. . . 102
5.7 Comparison between the estimated attenuation between the co-herence limit and multireference adaptive filtering. −: Multiple coherence. −: Adaptive filtering error. . . 103
6.1 Simulink model for simulation and prediction of ARNC systems. 113
6.2 The locations of the accelerometers in the vehicle structure and the directions of the reference signals. : One direction. . . 113
6.4 The locations of the accelerometers in the vehicle structure. : One direction reference signals. . . 115
6.5 Interior noise at the four headrests. −: ARNC off. −: ARNC on. 116
6.6 The locations of the accelerometers in the vehicle structure. : One dimensional accelerometers. . . 117
6.7 Interior noise at the four headrests. −: ARNC off. −: ARNC on. 118
6.8 The locations of the accelerometers in the vehicle structure. : One dimensional accelerometers. . . 119
6.9 Interior noise at the four headrests. −: ARNC off. −: ARNC on. 119
6.10 The locations of the accelerometers in the vehicle structure. : One dimensional accelerometers. . . 120
6.11 Interior noise at the four headrests. −: ARNC off. −: ARNC on. 121
6.12 The locations of the accelerometers in the vehicle structure. •: One direction reference signals. : Two directions reference signals.122
6.13 Interior noise at the four headrests. −: ARNC off. −: ARNC on. 123
6.14 The locations of the accelerometers in the vehicle structure. : One direction reference signals. •: Two directions reference signals.124
6.15 Interior noise at the four headrests. −: ARNC off. −: ARNC on. 125
6.16 The locations of the accelerometers in the vehicle structure. •: One direction reference signals. : Two DoF reference signals. . 126
6.17 Interior noise at the four headrests. −: ARNC off. −: ARNC on. 127
6.18 Interior noise at the four headrests. −: ARNC off. −: ARNC on. 128
6.19 The locations of the accelerometers in the vehicle structure. •: Tri-axial accelerometers position. : One dimensional accelerom-eters. . . 130
6.20 Interior noise at the four headrests. −: ARNC off. −: ARNC on. 130
6.21 The locations of the accelerometers in the vehicle structure. •: Three DoF reference signals. : One direction reference signals. 131
6.22 Interior noise at the four headrests. −: ARNC off. −: ARNC on. 132
6.23 The locations of the accelerometers in the vehicle structure. •: Tri-axial accelerometers position. : One dimensional accelerom-eters. . . 133
6.24 Interior noise at the four headrests. −: ARNC off. −: ARNC on. 134
6.25 The locations of the accelerometers in the vehicle structure and the DoF of the reference signals. •: Three DoF. : One DoF. . . 135
6.26 Interior noise at the four headrests. −: ARNC off. −: ARNC on. 136
6.27 The locations of the accelerometers in the vehicle structure. •: Tri-axial accelerometers position. . . 137
6.28 Interior noise at the four headrests. −: ARNC off. −: ARNC on. 138
6.29 The locations of the accelerometers in the vehicle structure. : Two DoF reference signals. : One DoF acceleration signal. . . 139
6.30 Interior noise at the four headrests. −: ARNC off. −: ARNC on. 140
6.31 The locations of the accelerometers in the vehicle structure. : Two DoF reference signals. : One direction acceleration signal. 141
7.1 ANC configuration of the whole vehicle road noise simulator. The sensor signalsf(t),a(t) and p(t) are common inputs to the LMS SCADAS and the feedforward controller. The signal y(t) is gen-erated from the output of the adaptive controller and drives the audio amplifier unit. . . 147
7.2 ANC hardware setup in the vehicle. . . 148
7.3 ANC configuration for feedforward control in a vehicle. The sensor signals are noted as a1: for the accelerometer, m1,m2,m3,m4: for the microphones and for the loudspeakers are displayed as s1,
s2,s3and s4.. . . 148
7.4 Block diagram of a single channel adaptive feedforward controller, wheref1(t),f2(t) are two uncorrelated forces applied on the front
tyres, a(t) is acceleration signal that is fed to the control filter matrixH andcl1,cl2,cl3,cl4 are the cancellation paths from the
loudspeakers to the headrest location of the attenuated signal el(t).151
7.5 Comparison between secondary path estimates. : Measured with the dual channel FFT analysis. . . 152
7.6 Reference sensor at the control arm of the suspension. : Accel-eration signal from the z-axis. . . 153
7.7 Cancellation zones at the three passengers headrest marked with.
• and uncontrolled zone at the driver’s headrest with. . . 153
7.8 ARNC at the four headrests for front tyres excitation, when only the front tyres are excited by the shakers.−: ARNC off. −: ARNC on. . . 154
7.9 ARNC performance at the four headrests. . . 154
7.10 Averaged ARNC performance at the four headrests. . . 155
7.11 Interior noise at the four headrests, when only the front tyres are excited by the shakers. −: ARNC off. −: ARNC on . . . 156
7.12 ARNC performance at the four headrests. . . 156
7.13 Averaged ARNC performance at the four headrests. . . 157
7.14 Interior noise at the four headrests, when only the front tyres are excited by the shakers. −: ARNC off. −: ARNC on. . . 159
7.15 ARNC performance at the four headrests. . . 159
7.16 Averaged ARNC performance at the four headrests. . . 160
7.17 Reference sensors at the subframe mounts of the rear axle. ,: Acceleration signals from the z-axis. . . 161
7.18 Interior noise at the four headrestswhen only the rear tyres are excited by the shakers. −: ARNC off. −: ARNC on . . . 161
7.19 ARNC performance at the four headrests. . . 162
7.20 Averaged ARNC performance at the four headrests. . . 163
7.21 Interior noise at the four headrests, when only the rear tyres are excited by the shakers. −: ARNC off. −: ARNC on. . . 164
7.22 ARNC performance at the four headrests. . . 164
7.23 Averaged ARNC performance at the four headrests. . . 165
7.24 Interior noise at the four headrests, when only the rear tyres are excited by the shakers. −: ARNC off. −: ARNC on . . . 166
7.25 ARNC performance at the four headrests. . . 166
7.27 Interior noise at the four headrests, when rear the front tyres are
excited by the shakers. −: ARNC off. −: ARNC on . . . 168
7.28 ARNC performance at the four headrests, when only the rear tyres are excited by the shakers. . . 168
7.29 Averaged interior noise. −: ARNC off. −: ARNC on. . . 169
7.30 Averaged ARNC performance at the four headrests. . . 169
7.31 Interior noise at the four headrests, when the rear tyres are excited by the shakers.. −: ARNC off. −: ARNC on . . . 170
7.32 ARNC performance at the four headrests. . . 170
7.33 ARNC performance at the four headrests. . . 171
7.34 ARNC performance at the four headrests. . . 171
7.35 Interior noise at the four headrests, when only the rear tyres are excited by the shakers. −: ARNC off. −: ARNC on. . . 172
7.36 ARNC performance at the four headrests. . . 172
7.37 Averaged ARNC performance at the four headrests. . . 173
7.38 Interior noise at the four headrests, when all the tyres are excited by the shakers. −: ARNC off. −: ARNC on. . . 174
7.39 ARNC performance at the four headrests. . . 175
7.40 Averaged ARNC performance at the four headrests. . . 175
7.41 Interior noise at the four headrests, when all the tyres are excited by the shakers. −: ARNC off. −: ARNC on. . . 177
7.42 ARNC performance at the four headrests. . . 177
7.43 Averaged ARNC performance at the four headrests. . . 178
7.44 Interior noise at the four headrests, when all the tyres are excited by the shakers. −: ARNC off. −: ARNC on. . . 178
7.45 ARNC performance at the four headrests. . . 179
7.46 Averaged ARNC performance at the four headrests. . . 180
7.47 Interior noise at the four headrests, when all the tyres are excited by the shakers. −: ARNC off. −: ARNC on. . . 181
7.48 Averaged ARNC performance at the four headrests. . . 181
7.49 Averaged ARNC performance at the four headrests. . . 182
7.50 Hardware equipment for ARNC inside the vehicle. The arrang-ment of the units can be seen with the corresponding signals that flow in and out from the controller. . . 182
7.51 Multiple coherence functions for the four microphones at the head-rests. . . 183
7.52 Interior noise at the four headrests at 50 km/h. −: ARNC off. −: ARNC on. . . 184
A.1 Instrumentation for the road noise simulator. The LMS Scadas for data acquisition is shown that was used for data acquisition and also as a signal generator for driving the shaker transducers. The set-up of the multichannel controller is also shown with a signal conditioner that was interfered between the controller and the ICP sensor in the car. . . 201
A.2 Hardware for ARNC.. . . 202
A.3 The Monacor 404 four channel audio amplifier. . . 203
1.1 Interior NVH attributes. . . 1
1.2 Structureborne road noise frequency bands and their structural source. . . 6
4.1 Predicted ARNC performance for each of the four microphone at the headrests. The calculation is based on the four reference acceleration signals for the frequency range of 0-500 Hz. . . 90
4.2 Predicted ARNC performance for each of the four microphone at the headrests. The calculation is based on twenty reference signals for the frequency range of 0-500 Hz. . . 90
6.1 Total reduction for 0-500 Hz. LHF: Left hand front, RHF: Right hand front headrest, LHR: Left hand rear, RHR: Right hand rear. 114
6.2 Total reduction for 0-500 Hz. LHF: Left hand front, RHF: Right hand front headrest, LHR: Left hand rear, RHR: Right hand rear. 116
6.3 Total reduction for 0-500 Hz. LHF: Left hand front, RHF: Right hand front headrest, LHR: Left hand rear, RHR: Right hand rear. 118
6.4 Total reduction for 0-500 Hz. LHF: Left hand front, RHF: Right hand front headrest, LHR: Left hand rear, RHR: Right hand rear. 120
6.5 Total reduction for 0-500 Hz. LHF: Left hand front, RHF: Right hand front headrest, LHR: Left hand rear, RHR: Right hand rear. 121
6.6 Total reduction for 0-500 Hz. LHF: Left hand front, RHF: Right hand front headrest, LHR: Left hand rear, RHR: Right hand rear. 123
6.7 Total reduction for 0-500 Hz. LHF: Left hand front, RHF: Right hand front headrest, LHR: Left hand rear, RHR: Right hand rear. 125
6.8 Total reduction for 0-500 Hz. LHF: Left hand front, RHF: Right hand front headrest, LHR: Left hand rear, RHR: Right hand rear. 127
6.9 Total reduction for 0-500 Hz. LHF: Left hand front, RHF: Right hand front headrest, LHR: Left hand rear, RHR: Right hand rear. 129
6.10 Total reduction for 0-500 Hz. LHF: Left hand front, RHF: Right hand front headrest, LHR: Left hand rear, RHR: Right hand rear. 131
6.11 Total reduction for 0-500 Hz. LHF: Left hand front, RHF: Right hand front headrest, LHR: Left hand rear, RHR: Right hand rear. 133
6.12 Total reduction for 0-500 Hz. LHF: Left hand front, RHF: Right hand front headrest, LHR: Left hand rear, RHR: Right hand rear. 134
6.13 Total reduction for 0-500 Hz. LHF: Left hand front, RHF: Right hand front headrest, LHR: Left hand rear, RHR: Right hand rear. 136
6.14 Total reduction for 0-500 Hz. LHF: Left hand front, RHF: Right hand front headrest, LHR: Left hand rear, RHR: Right hand rear. 138
6.15 Total reduction for 0-500 Hz. LHF: Left hand front, RHF: Right hand front headrest, LHR: Left hand rear, RHR: Right hand rear. 140
6.16 Total reduction for 0-500 Hz. LHF: Left hand front, RHF: Right hand front headrest, LHR: Left hand rear, RHR: Right hand rear. 142
6.17 Best reference signal combinations and the corresponding average reduction across the four headrests.. . . 143
7.1 Total reduction for 0-500 Hz. LHF: Left hand front, RHF: Right hand front headrest, LHR: Left hand rear, RHR: Right hand rear. 155
7.2 Total reduction for 0-500 Hz. LHF: Left hand front, RHF: Right hand front headrest, LHR: Left hand rear, RHR: Right hand rear. 158
7.3 Total reduction for 0-500 Hz. LHF: Left hand front, RHF: Right hand front headrest, LHR: Left hand rear, RHR: Right hand rear. 160
7.4 Total reduction for 0-500 Hz. LHF: Left hand front, RHF: Right hand front headrest, LHR: Left hand rear, RHR: Right hand rear. 163
7.5 Total reduction for 0-500 Hz. LHF: Left hand front, RHF: Right hand front headrest, LHR: Left hand rear, RHR: Right hand rear. 165
7.6 Total reduction for 0-500 Hz. LHF: Left hand front, RHF: Right hand front headrest, LHR: Left hand rear, RHR: Right hand rear. 167
7.7 Total reduction for 0-500 Hz. LHF: Left hand front, RHF: Right hand front headrest, LHR: Left hand rear, RHR: Right hand rear. 169
7.8 Total reduction for 0-500 Hz. LHF: Left hand front, RHF: Right hand front headrest, LHR: Left hand rear, RHR: Right hand rear. 171
7.9 Total reduction for 0-500 Hz. LHF: Left hand front, RHF: Right hand front headrest, LHR: Left hand rear, RHR: Right hand rear. 174
7.10 Total reduction for 0-500 Hz. LHF: Left hand front, RHF: Right hand front headrest, LHR: Left hand rear, RHR: Right hand rear. 176
7.11 Total reduction for 0-500 Hz. LHF: Left hand front, RHF: Right hand front headrest, LHR: Left hand rear, RHR: Right hand rear. 178
7.12 Total reduction for 0-500 Hz. LHF: Left hand front, RHF: Right hand front headrest, LHR: Left hand rear, RHR: Right hand rear. 180
7.13 Total reduction for 0-500 Hz. LHF: Left hand front, RHF: Right hand front headrest, LHR: Left hand rear, RHR: Right hand rear. 182
7.14 Total reduction for 0-500 Hz. LHF: Left hand front, RHF: Right hand front headrest, LHR: Left hand rear, RHR: Right hand rear. 184
7.15 Best road noise simulation cases for tyre cavity and road rumble ARNC. . . 187
A.1 Technical specifications of the Monacor audio amplifier. . . 203
A.2 Technical specifications of the Monacor audio amplifier. . . 204
Abbreviations
ADC Analog to Digital Conversion
ANC ActiveNoise Control/Cancellation
ARNC ActiveRoad Noise Control
AVC ActiveVibrationControl/Cancellation
DAC Digital to Analog Conversion
DAQ DataAcquisitionSystem
DSP Digital SignalProcessing
DoF Degrees of Freedom
EOC Engine Order Control
FIR FiniteImpulse Response
FPAA Field Programme Analog Arrays
FRF FrequencyResponse Function
IRF Impulse ResponseFunction
LHF LeftHand Front
LHR LeftHand Rear
LMS Least MeanSquare
MIMO Multiple InputMultiple Output
MISO Multiple InputSingleOutput
SISO SingleInputSingleOutput
NTF NoiseTransferFunction
PCA PrincipalComponent Analysis
RHF RightHand Front
RHR RightHand Right
SVD Singular Value Decomposition
Signal Conventions
d(n) desired, disturbance signal
v(n) white noise signal
Ts Sampling period
TF F T Time period of an FFT
fs Sampling frequency
F(k) Spectral factor
x(n) reference signal
X(z) z-transform ofx(n)
X(k) Discrete Fourier Transform ofx(n)
r(n) filtered reference signal
R(z) z-transform ofr(n)
R(k) Discrete Fourier Transform ofr(n)
Rxd(t) Cross-correlation between the reference and the disturbance signal
Rxx(t) Autocorrelation of the reference signal
Rss(t) Autocorrelation of the primary excitation
Sxd(k) Discrete Fourier Transform ofRxd(t)
Sxx(k) Discrete Fourier Transform ofRxx(t)
Symbols
An modal amplitude
c speed of sound in air
D coupling term
Ep time averaged acoustic potential energy
fs sampling frequency
G Green’s function, secondary plant transfer funtion
g secondary plant impulse response
i index
I number of control filter’s coefficients
j √−1
k wavenumber, number of reference signals
K number of reference signals and microphones
l, L number of error signals and microphones
m, M number of control signals and loudspeakers
N FFT block length
p sound pressure
r distance
Ts sampling period
w control filter coefficients
Greek letters
ζ damping ratio
µ step-size
τ time delay
ψn, ψm mode shape (eigenfunction)
ω angular frequency
Two peer reviewed conference papers and one journal publication were inspired from several parts of this PhD thesis and are presented in the following list:
•N. Zafeiropoulos, A.T. Moorhouse, A. Mackay, U. Senapati (2013). A compar-ison of two in-situ transfer path analysis methods, International Conference on Recent Advances in Structural Dynamics.
• N. Zafeiropoulos, M. Ballatore, A.T. Moorhouse, A. Mackay (2015). Active control of structure-borne road noise based on the separation of front and rear structural road noise related dynamics, SAE International Journal of Passenger Cars-Mechanical Systems, 2015, 8. Jg., Nr. 2015-01-2222.
• N. Zafeiropoulos, A.T. Moorhouse, M. Ballatore, A. Mackay (2015). Active control of road noise: the relation between the reference sensor locations and the effect on the contoller’s performance, Proceedings of the 22nd,International Institute of Acoustics and Vibration (IIAV)
I would like to take the opportunity to express my great gratitude to my supervi-sor Professupervi-sor Andy Moorhouse for several reasons. First, for allowing me to take part in a such interesting PhD study and introducing me to vibro-acoustics and in particular in TPA methods. Secondly, for his academic guidance, support, proof reading the thesis and last but not least for encouraging me throughout difficult and stressful moments. I am also grateful and thankful to my tech-nical manager from Bentley Motors Ltd, Dr. Marco Ballatore for his support, technical advices and also introducing me to vehicle structural dynamics. It is always great to work with people that are enthusiast, passionate and also want the maximum performance. I want also to express my warm thanks to Andy Mackay for bringing me in Bentley Motors, for his fruitful discussions and also sharing his experiences with ARNC technology for vehicles that have been an important feedback in many cases. An industrially funded project is not fea-sible without people with vision and technology interests that will provide the funding for a research project such as a doctorate study. Therefore I would like to acknowledge Uday Senapati, former Head of Whole Vehicle NVH of Bentley Motors, who created this project initially and hired me. Also, Marco Tarabra, my NVH manager for his great support and his help with budget issues. A spe-cial thanks to Jonathan Layfield, Head of Whole Vehicle Physics, who has been extremely supportive and also interested in the technical side of this Phd. I also appreciate the support of Bentley NVH team, especially Bob Kenyon, Francesco Naclerio, Dave Wilcox and Greg Wilshaw, who have been very helpful for set-ting and performing measurements with the vehicle. I would like to thank also some people that have significantly influence me to pursue a PhD, Dr. Stelios Koukoulas for introducing me in electrical/electronic engineering and stochastic processes, Dr. Stelios Potirakis for been a great mentor from my early years as an undergraduate student, Dr. Khaldoon Al-Naimi for been very supportive to purchase a PhD and Professor Finn Jacobsen for teaching physical acoustics with his unique simplistic way and also recommending me to Salford University. Lastly, I would like to thank Professor Colin Hansen and Professor Yiu Lam for their reviews. My sincere thanks to my sister, Dr. Aristea Zafeiropoulou for her support these three years and also for her great efforts in proof reading the thesis. I would like express appreciation to my mother, Georgia Dimitropoulou for been always supportive to achieve my goals.
present situation if I say that the first industrial revolution,
the revolution of the dark satanic mills, was the devaluation
of the human arm by the competition of machinery. . . The
modern industrial revolution [i.e., the computer revolution] is
similarly bound to devalue the human brain. . . The answer, of
course, is to have a society based on human values other than
buying and selling. To arrive at this society, we need a good
deal of planning and a good deal of struggle. . . ”
Nobert Wiener ,”Cybernetics: Or the Control and
Communication in the Animal and the Machine” (1948)
Introduction
1.1
Noise vibration and harshness attributes
Modern vehicles are required to achieve specific targets in terms of acoustic per-formance, in order to become more attractive products, by improving sound quality and vehicle refinement. The sound character has become a crucial ele-ment of the developele-ment process of the vehicle. Several mechanical parts of the vehicle are designed and tuned in order to meet the targeted Noise Vibration & Harsheness (NVH) specifications. Apart from the sound character, vehicle re-finement, which includes the noise and vibration levels, is also key to the overall NVH performance. The levels of interior noise depend on various mechanical sources that act on the vehicle structure and couple with the sound field in the compartment. Interior noise can also be generated due to the poor sound in-sulation of the cabin. All the previously mentioned sound and vibration issues belong to the interior NVH area and they are categorised in table (1.1) according to their frequency range and their sources.
NVH term Frequency range [Hz] Source
Powertrain noise 20 Hz - 3 kHz engine, driveline, exhaust Road noise (structure-borne) 20 Hz - 800 Hz tyre cavity noise, structure Road noise (airborne) 20 Hz - 2.5 kHz tyre noise, air leaks, Wind noise 50 Hz - 5kHz exterior design, styling
Table 1.1: Interior NVH attributes.
The overall noise spectra in the vehicle’s compartment can be decomposed to the three major sound attributes: powertrain, road and wind noise (figure
1.1). Powertrain noise covers the areas of the vehicle’s engine, transmission and exhaust systems. The mechanical noises from the powertain sources vary in a broad frequency range as a function the engine speed and throttle loading conditions. In particular, engine noise is of harmonic nature since it is defined as the sum of the fundamental frequency plus its harmonics. Air conditioning systems and other ancillaries impact also to the total noise levels depending on the driving condition and their settings. In a luxury vehicle these disturbances are kept at a very low noise level as they can strongly influence the customer’s perception in terms of the overall sound quality of the vehicle.
Figure 1.1: Interior NVH sound attributes. Taken from [Williams(2014)].
The primary noise sources such as the engine and the vehicle’s structure are mostly concerntrated at low frequencies, typically below 500 Hz. In many modern vehicles dominant cavity booms (single frequency) can be created from the engine calibration settings or from the transmission systems, which can excite higher order acoustic modes of the cabin. In the case of road noise is caused by the tyre-road surface interaction that dominates mostly at low-mid frequencies. On the other hand, wind noise is broadband and it starts to be strongly perceivable at speeds above 100 km/h as it dominates the interior sound pressure levels.
1.2
Interior road noise
At high speeds the cavities at the tread patent of the rolling tyres are excited by their interaction with the road surface and road noise is radiated that can be transmitted through airborne paths into the vehicle compartment. Figure 1.2
[image:33.596.242.427.175.281.2]presents the two transmission mechanisms, airborne and structureborne of road noise inside the vehicle.
Figure 1.2: Structure-borne and airborne paths into the vehicle’s cabin. Taken from [Cerrato(2009)].
Advanced NVH methods are used to analyse the road noise data and iden-tify the various noise transmission paths that contribute to the interior road noise. Figure 1.3 illustrates an example of the airborne and structure-borne contributions from the front and rear part of the vehicle with data that were acquired with microphones close to the four wheels and accelerometers mounted at the front and rear axle.The structure-borne contributions of the front part are very close to the total noise level at driver’s headrests 100-300 Hz, whereas at frequencies above 700 Hz airborne road noise starts to dominate.
Figure 1.3: Structure-borne (SB) and airborne (AB) contributions to the interior noise spectrum at the driver’s headrest at 90 km/h. −: Total noise level, −: Structure-borne road noise contribution, −: Airborne road noise
The airborne paths in the vehicle body can be identified with advanced NVH measurement technique in order to apply sound insulation treatment. In the case of structure-borne road noise the transmission emerges from the tire through the suspension and body structure into the cabin. As a consequently, acoustic treatments are not so effective on this type of noise. Detailed analysis of the vehicle structural-acoustic interaction is required at a simulation and mea-surement level before applying any NVH solutions on the vehicle. Identification and ranking of the structural sources can be performed with the use of TPA (Transfer Path Analysis) [Plunt (1999)], [Elliott et al. (2013), Yoo and Chang
(2005)]. The main assumption of TPA is that the vehicle is modelled as a Mul-tiple Input MulMul-tiple Output (MIMO) vibro-acoustic system with several inputs are acting on the vehicle and cause interior road noise as output. TPA highlights also the most sensitive structural or airborne paths for various road input condi-tions, this type of analysis is referred ascontribution analysis. Multiple coherence analysis can be alternatively used to find the total road noise contributions and also the incoherent road noise contributors as figure 1.4demonstrates [Williams
(2014)]. Additionally, the incoherent noise components that are not referenced
Figure 1.4: Interior road noise at 90 km/h. −: Measured interior road noise at the driver’s headrest. −: Sum of airborne and structure-borne road noise
contributions. −: Sum of other unreferenced noise contributions.
with accelerometers and microphones at the chassis and around the wheels can be separated with the use of multiple coherence method [Williams(2014)]. These components are generated from other noise sources such as wind noise that are incoherent with the road noise components. Wind noise some effects the interior noise spectrum at very low frequencies and also above 1 kHz [Cerrato (2009)]. Very low frequency interior noise can be a wind noise component that is referred as buffeting noise and it is caused by a small leakage path around the door or windows. If we compare the summation of the road noise contributions in figure
structural vibrations of front axles (1.3). Therefore at speeds from 50 km/h up to 100 km/h road noise reduction is important as it can improve significantly the refinement of the vehicle, since noise resonances can become annoying at these speeds and degrade the subjective NVH performance of a luxury vehicle.
Figure 1.5: Interior road noise at 90 km/h. −: Measured interior road noise at the driver’s headrest. −: Sum of airborne, structure-borne and other noise
contributions.
1.3
Passive control of structure-borne road noise
The application of passive NVH control techniques on structure-borne road noise is not a trivial task, since design changes on the vehicle’s structure are difficult to apply and most of the time not cost effective . Usually structure-borne road noise is treated by tuning the global and local dynamic stiffnesses of the vehi-cle structure during the design stage of the body structure [Kim et al. (2014)], [Duncan et al.(2011)]. Modern vehicle design techniques focus on the optimisa-tion of the structural behaviour of the most sensitive structural parts in terms of road noise. The performance of the passive damping that is applied on the floor panel is estimated with numerical methods [Subramanian et al. (2003)], [Mohanty et al. (2000)]. Other local vibrations that are related to road noise cam be controlled by tuned mass dampers [Aubert and Howle(2007)] that block the road noise forces on sensitive vibro-acoustic paths. At the same time ad-vanced NVH measurement techniques such as in-situ TPA [Elliott et al. (2013)] methods can identify these weaknesses within the structure and can allow to perform structural changes on the dynamic properties of chassis components in order to improve the levels of refinement in terms of road noise [Dohm et al.
mass and compliance need to be increased for reducing the road noise levels, then the steering performance can be potentially effected. Another example of the influence of road noise NVH solutions on the vehicle’s performance metrics is the mass increase usually below 150 Hz for the control of global vibration lev-els of the whole vehicle structure. This type of solution can have serious effect on the fuel consumption and thus on CO2 emissions. As a result, active noise control technologies have the potential to offer useful NVH solutions in cases, in which the standardised NVH solutions begin to compromise other important characteristics of the vehicle.
1.4
Characteristics of structure-borne road noise
Structure-borne road noise is the outcome of different mechanisms that are ex-cited from high levels of road-force inputs. Road noise is mostly perceivable while drving over rough asphalts, where the friction between the tire and the asphalt is high. Another issue is that road-forces are able to provide enough energy to the vehicle structure that can excite global and local vibrations that couple with the acoustic field of the cabin. The perceived sound can be analysed in terms of the various sources that contribute to the sound pressure response in the cabin. Previous studies have characterised road noise in terms of subjective perception [Gauterin (1994b)]. The outcome of [Gauterin(1994b)] has resulted in a metric that ranks the NVH performance of the vehicle and at the same time charecterises a vehicle in terms of the road noise perception [Gauterin(1994a)]. Similar assessments are currently used in the automotive industry for the sub-jective evaluation of road noise and vary between manufacturers according to the sound character of the vehicle. In table1.2the frequency bands of each road noise component with their corresponding structural source are presented.
Name Frequency range [Hz] Structural source Boom/drum 10-70 Global vibrations Rumble 70-170 Body, axle vibrations Tyre Cavity 180-230 Tyre resonances Midfrequency 230-500 Local body vibrations
1.5
Variability of structureborne road noise
An important parameter of structure-borne road noise is that it has shown a va-riety of different levels and frequencies in the same vehicle model due to compo-nent tolerances and vehicle assembly. Kompella [Kompella and Bernhard(1993)] found that the manufacturing variability strongly affects the low frequency vibro-acoustic behaviour of the vehicle. As a consequence, vehicles are highly sensitive to changes or small variations in the assembly of the vehicle. The following figure presents the same vibro-acoustic system that is measured across 100 vehicles of the same model, typically sharp resonances in this frequency response function result to audible road noise components as we will discuss later in chapter2.
Figure 1.6: Variability in a vibro-acoustic path at measured at the driver’s headrest for 100 vehicles. Taken from [Kompella and Bernhard(1993)].
Modern vehicle numerical modelling techniques [Durand et al. (2005)] take into account the statistical variations in the vibro-acoustic paths with the use of stochastic models as suggested by [Rustighi et al. (2008)] and [Durand et al.
(2008)]. As a result these modern prediction tools can provide a guidance to the NVH design at the early stage of the vehicle. However, still accurate CAE methods that can correlate well with measured road noise data are not so far available at least in the literature.
It is also worth highlighting that passive NVH control techniques are not able to control changes in the road noise spectrum or any other uncertainties in the vibro-acoustic behavior of the vehicle over time. On the other hand active control techniques can potentially compensate for all these changes and uncertainties, since the adaptive algorithms are able to adapt to variations in the vehicle’s structure-borne NVH performance. Previous work by Lotus [Mackay and Kenchington (2004)] and from other researchers in the field [Park et al.
fact demonstrates the improvements that adaptive noise control solutions can offer to a wide range of vehicles in terms of noise reduction without constraining the mechanical design of the vehicle. The cost depends on the volumes and the accelerometer sensor pricing as modern DSP are already integrated in the audio systems. In terms of reliability of the controller this depends on the hardware platform, as currently adaptive ANC system are already implemented in several vehicle for powertrain noise reduction. The only thing that needs to be addressed is the fault detection of the accelerometer sensor that provides the input signals of the controller.
1.6
Active control of structure-borne road noise
During the last 30 years, several research groups as well automotive manufactur-ers have investigated whetheractive noise control (ANC) can offer an alternative to existing passive noise control techniques. This is mainly due to the fact that ANC does not require any changes in the structural design of the vehicle only access to the loudspeaker system and some sensors at specific locations of the vehicle. In addition to this active systems are very effective in the modal area of small cavity similar to the one of an automotive vehicle. In the early 90s, Nissan Motors managed to integrate noise cancellation systems for engine noise reduction into a production vehicle [Hasegawa et al. (1992)]. In Europe, Lo-tus Engineering has demonstrated ARNC andengine order control/cancellation
(EOC) in a wide range of vehicles for different automotive manufacturers, but none of these vehicles have yet been released in the market with ANC. Up until now, ARNC technology has not been applied to any production vehicle, mainly due to cost requirements. However, recent advances indigital signal processoring
1.7
The evolution of active road noise control
1.7.1 Principles of active noise control
The concept of active noise control is based on the destructive interference of two sound waves: the first is the primary noise field whereas the second is gen-erated by the loudspeaker system in the cavity. Active noise control or active noise cancellation is a noise control technique that is mostly effective at low fre-quencies. A loudspeaker is used for emitting the canceling sound, also referred as
[image:39.596.239.427.419.730.2]”antinoise”, whereas a microphone sensor measures the sound pressure at the lo-cation where the noise is to be minimised. An electronic controller that contains the ANC filters generates the appropriate control signals that drive the loud-speaker units. This technique has a limited frequency range mainly due to the latency in the control loop and also the sound field becoming diffused at higher frequencies. Active noise control was first introduced as a concept by Paul Lueg in [Lueg(1936)], who presented a system that controlled sinusoidal sounds. Fig-ure (1.7) present the configuration of Lueg’s apparatus, where a microphone for measuring the noise source, an amplifier and a loudspeaker are usedto generate the secondary sound field.
An array of sensors and loudspeakers is used for reducing either to total acoustic potential energy in the sound field, global control meaning the average mean-square pressure across the space of an enclosure or only at specific locations in the field, local control [Nelson and Elliott (1991)]. The same principles of control can be also used for vibrational system in order to reduce the vibration levels across a structure, this type of technology is referred as active vibration control. The type of control depends on the number of microphone sensors that are measuring the sound pressure in the enclosed cavity and also the number of modes that contribute to the sound field at low frequencies. If the system is based on a large number of microphones, then a good approximation of the acoustic energy in the cavity at low frequencies can be achieved. As a consequence, global control of the sound is generally possible if there is low modal density in the cavity at low frequencies and the control sources couple directly with acoustic modes. For vehicles it has been demonstrated that the acoustic modes of the cabin can be partially controlled up to 150 Hz and above 200 Hz only zones of quiet are resulted by the presence of thecanceling sound field.
One of the conditions for effectively reducing the noise is that the sound field at the loudspeaker position must be coherent with the primary noise source. This implies that the loudspeakers need to be placed at a location in the sound field where they can couple well with the primary noise disturbance. In addition to this the sensors that are measuring the variations of the noise source need to be placed at a point in the sound field or in the structure. In the case of vibro-acoustic noise transmission, where they can provide a signal that is coherent enough with the noise in the cavity.
The selection of the reference sensors for structure-borne road reduction is a difficult task, since various structural sources act on the vehicle. The coherence between the measured vibrational signals can be low due to the cross-coupling of the sources. As a result, the coherence between the accelerometers and the microphones in the cabin might be poor. To avoid that, a set of accelerometer sensors is used to tackle this problem, in order to capture all the structural road noise sources that contribute to the sound pressure in the compartment. The discussion regarding the coherence issue will be expanded in section (1.7.4) and in chapter 4.
1.7.2 Introduction to feedback active road noise controllers
order harmonics was presented. In this thesis we mainly focus on active con-trollers of road noise, a challenging research topic in terms of vibro-acoustics, signal processing and control systems engineering. To that purpose, this sec-tion provides a detailed account of basic principal control strategies, which are used for the creation of the appropriate secondary sound field through the audio system of the vehicle. Figures1.8 and1.9 present a feedback control system.
Figure 1.8: Block diagram of a single channel feedback ARNC system. E(ω): error input signal typically from a sensor at the cancelling point. H(ω): control filter. Y(ω): control signal that drive the transducer. D(ω): primary noise
disturbance. ˆD(ω): estimated noise from the controller.
Multichannel feedback ARNC is recently developed and published by [Cheer and Elliott (2013)]. In this section we only introduce single channel feedback ARNC systems for the sake of simplicity. In figure 1.8, the signal D(jω) is the main road noise disturbance and the signal ˆD(jω) is the ”antinoise” generated by the audio system. The superposition of D(jω) with ˆD(jω) results to E(jω) that is the measured error signal by a microphone inside the vehicle’s cabin. The output Y(jω) of the controllerH(jω) can be expressed as
Y(jω) =−H(jω)E(jω), (1.1)
whereas the noise canceling sound ˆD(jω) that reaches the cancellation point through the electro-acoustic path between the audio system and the microphone
C(jω) is equal to
ˆ
D(jω) =C(jω)Y(jω). (1.2)
The error signal that is measured by the microphone can be calculated as
E(jω) =D(jω)−C(jω)H(jω)E(jω). (1.3)
The attenuation at the microphone’s location depends on the control filter design
since the poles of the filter must be negative real valued numbers to avoid insta-bilities [Nelson and Elliott(1991)]. A stronger stability condition is the Nyquist criterion as it takes into account the FRF of the acoustic plantC(jω). According to Nyquist, the open loop FRF C(jω)H(jω) must not contain the point (-1,0) in the complex plane [Elliott(2000a)]. The following function that is referred as
sensitivity function defines the objective of the control filter design
E(jω)
D(jω) =
1
1 +C(jω)H(jω) =S(jω). (1.4) Advanced feedback control design techniques such asH∞ control and IMC
(In-ternal Model Control) are used for optimising the sensitivity function S(jω) [Adachi and Sano (1996), Adachi et al. (2001), Elliott (2000a)]. H∞ control is
a mathematical method for design stable optimal controllers and IMC is a feed-back control strategy for generating a virtual reference signal instead of using an actual reference signal directly from the noise source. Sano [Sano et al. (2001)] applied feedback ARNC on a Honda vehicle based on H∞ design. The system
controlled the first acoustic mode of the cabin at 40 Hz at the driver’s seat. The setup of the Honda feedback system is presented in figure1.9, where the ARNC setup on a Honda Accord is presented.
Figure 1.9: Feedback ARNC system of Honda Motors. Taken from [Sano
et al.(2001)].
Apart from the stability and enhancement issues, the mixing between the audio and control signals of the loudspeakers needs to be carefully performed. Another significant feature of feedback systems is that the limitation of the dis-tance between the loudspeaker and microphone must be kept as small as possible, since the acoustic propagation delay can significantly limit the performance of a feedback system [Elliott and Sutton(1996)]. For example, [Adachi et al.(2001)] proved experimentally (under free field conditions) that 0.1 m distance between the actuator and the sensor is necessary in order to achieve good control at 150 Hz.
In terms of the integration with the audio system, the microphone signal that is fed to the feedback controller needs to be separated from the audio signals that drive the loudspeakers before the control and audio signals. This way the road noise disturbance and the audio spectra are separated, since both are embedded in the measured microphone signal of the cabin. Otherwise if the microphone signals are directly fed to the controller, then the control might have an effect the performance of the audio system. Sano presented a solution for the integration of feedback controllers with the vehicle’s audio system implemented in Honda vehicles [Sano et al.(2000)].
1.7.3 Review of feedback active road noise controllers
The first study of road noise cancellers is dated back in 1989, when a digital feedback controller was designed for reducing impact road noise [Costin and Elzinga (1989)]. The system was based on a headphone system mounted at the headrest of the driver. The feedback controller was designed with aproportional integral (PI) control theory that achieved 5-10 dB reduction between 20-60 Hz. Also a version of the controller with genelarised minimum variance theory was implemented that managed to cancel up to 20 dB in the same low frequency range. Another very interesting study in terms of control theory is found in [Brown(1995)], where a state space was used for developing a linear quadratic gaussian (LQG) optimal control for road noise cancellation with a single micro-phone mearusing the sound field in the cabin. Poor performance was reported in this study and the need for multiple input multiple output (MIMO) feedback design techniques was highlighted. As previously mentioned single channel feed-back controller for ARNC with fixed filter coefficients has only been developed by Honda Motors in a production line vehicle [Sano et al. (2000), Sano et al.
path between the loudspeaker and the microphone in the cabin that feeds back the sound signal to the controller.
A simulation study for road noise cancellation [Elliott and Sutton (1996)] showed that feedback systems are extremely sensitive to the acoustic plant delays, especially as the distance between the loudspeaker and the microphone increases. Adachi presented a more detailed design and analysis of feedback ANC [Adachi et al. (2001), Adachi (2003)]. The effect of the latency that is introduced by the acoustic plant is demonstrated under an ANC experiment with simulated road noise through loudspeakers in free field and varying distances between the control source and the cancellation position in the field.
In Elliott’s study was suggested that the maximum distance should not be more than 0.3 m [Elliott and Sutton (1996)], whereas Adachi proved within an experiment that 0.1 m is required in order to attenuate 10 dB(A) at 150 Hz. The successful demonstration of Adachi was also based on the use of an extremely low order system for modeling the acoustic plant of the free field thus a simple control filter. In practice however, as the distance from the loudspeaker to microphone increases in the vehicle’s cabin the complexity of the acoustic system between the transducer and the sensor increases. As a consequence, a high order control filter that compensates for the phase changes in the response of the physical system is usually required [Adachi(2003)]. As a solution to this problem, Cheer suggested a method that weights the control filtering according to the spatial distribution of the acoustic modes in the vehicle cabin [Cheer and Elliott (2012)]. However, the simulation findings were not particularly successful as the phase character-istics of the electro-acoustic path between the loudspeaker and microphone are always limiting factors for feedback strategies. As a further improvement of the suggested method, Cheer proposed an optimisation technique that calculates an
finite impulse response (FIR) filter matrix for a multichannel feedback ANC with the use of operational data [Cheer and Elliott(2013)]. A comparison study based on simulations of road noise was published recently demostrated that the MIMO feedback controller was effective from 80 Hz to 180 Hz, but with the trade-off of small enhancements at frequencies above the range [Cheer and Elliott (2014)]. As a continuation of Cheer’s work for multichannel feedback road noise control, the author performed a comparison between feedforward control with reference microphones inside the vehicle’s cabin and feedback control [Cheer and Elliott
(2015)], where good performance is obtained at the road rumble range, but above this band it has noticed that the coherence between the microphones is poor, due to other NVH attributes contributing to the sound field.
control system was based on a single channel feedback ANC implemented in a
field programmable analog array (FPAA) platform. The system was designed to cancel a very low frequency boom at 35 Hz, which created very high sound pressure levels in the cabin of a Holden Commodore station-wagon. Limited per-formance was reported as there were no attempts to optimise the loudspeaker and microphone placement.
Up until the point of writing this thesis, there have been no implementations of broadband feedback ANC for interior road noise in vehicles for the whole structureborne noise frequency range. Simulation results of new MIMO feedback ARNC design techniques have shown promising results up to 200 Hz [Cheer and Elliott (2013), Cheer and Elliott (2014)]. Recently, Honda demonstrated an interesting feedback technique of generating narrowband reference signals instead of using actual accelerometer sensors for removing some low frequencies road booms [Sakamoto and Inoue(2015)]. This method allowed Honda to use the active controller that is already integrated in their vehicles that is also capable of engine order cancellation.
1.7.4 Introduction to feedforward active road noise controllers
Modern control engineering control systems are augmented with a reference sen-sor that supplies a signal from the source. In the case of active road noise control the reference sensors are accelerometers that are positioned on the vehicle struc-ture, suspension or subframe. The feedforward topology is presented in figure
1.10.
Figure 1.10: Block diagram of a single channel feedforward ARNC system.
X(ω): reference input signals typically from a sensor at the noise source. H(ω): control filter. Y(ω): control signal that drive the transducer. D(ω): primary
noise disturbance. ˆD(ω): estimated noise from the controller.
If the reference signal from an accelerometer demoted as X(jω), then the output Y(jω) of the control filterH(jω) can be calculated as
Y(jω) =H(jω)X(jω) (1.5)
E(jω) = ˆD(jω) +C(jω)Y(jω) (1.6)
In order to find the controller’s FRF the order of the H(jω) andC(jω) can be changed as in figure 2.1.
Figure 1.11:Alternative block diagram of a single channel feedforward ARNC system.
[image:46.596.171.354.366.483.2]Feedforward controllers are usually developed based on adaptive algorithms, meaning that the control filter coefficients are adjustable. Figure2.2(a)presents the general adaptive feedforward control strategy with the use of filtered reference LMS algorithm, also known as FxLMS.
Figure 1.12: Block diagram of a single channel adaptive feedforward con-troller. x(n): reference input signal typically from a sensor at the noise source.
w(n): control filter. y(n): control signal that drive the transducer. d(n): pri-mary noise disturbance. ˆd(n): estimated noise from the controller. c(n), ˆc(n):
secondary path impulse and its estimate. e(n): error signal.
In the case of adaptive feedforward ARNC the control filter coefficients are continuously adjusted in the time domain according to the variations of the sound pressure signal e(n), which is measured by a microphone in the cabin, but also according to the variations of the filtered reference singal r(n). The latter is the result of the convolution between the measured acceleration signal
x(n) and an estimate of the electro-acoustic plant ˆc(n). The famous filtered reference LMS algorithm updates the control filter coefficientsw(n) according to the cross-correlation ofe(n) andr(n) as follow
![Figure 1.1: Interior NVH sound attributes. Taken from [Williams (2014)].](https://thumb-us.123doks.com/thumbv2/123dok_us/8708343.881283/32.596.167.356.239.356/figure-interior-nvh-sound-attributes-taken-williams.webp)
![Figure 1.2:Structure-borne and airborne paths into the vehicle’s cabin.Taken from [Cerrato (2009)].](https://thumb-us.123doks.com/thumbv2/123dok_us/8708343.881283/33.596.242.427.175.281/figure-structure-borne-airborne-paths-vehicle-taken-cerrato.webp)