International Journal of Emerging Technology and Advanced Engineering
Website: www.ijetae.com (ISSN 2250-2459,ISO 9001:2008 Certified Journal, Volume 4, Issue 10, October 2014)
717
Photovoltaic/Thermal (PV/T) System as Innovative Solution to
Increase Solar Energy Conversion Efficiency
R. K. Koech
1, G. K Arusei
2, G. K Yegon
3, J. K. Tonui
4, S. K Rotich
51,2,3,5
Department of physics, Moi University, P.O Box 3900 – 30100, Eldoret (Kenya)
4Department of physics, University of Eldoret, P.O Box 1125-30100, Eldoret (Kenya) Abstract— Photovoltaic (PV) modules and solar thermal
collectors are convectional solar systems that convert solar radiation into electricity and heat energy respectively. PV modules generate clean electricity and ideal for use in developing countries where human settlement is scattered in remote rural areas and no grid electricity is available. However, electrical conversion efficiency of commercial PV modules is still low (~20%) hence about 80% of the incoming solar energy is lost as waste heat which raises module temperature resulting into a reduction in its electrical efficiency. Hybrid photovoltaic/thermal (PV/T) solar collectors are innovative systems that generates heat and electricity simultaneously hence increases solar energy conversion efficiency of a PV module. A PV/T system is a PV module with a heat exchanger attached behind it for passing a colder fluid (usually air or water) for extracting useful heat and hence cooling the PV module. In the present work, a parametric model based on heat transfer between adjacent components of a PV/T air collector under natural flow was developed. The model was coded in FORTRAN 95 and validated from experimental data measured on a similar experimental model. The validated model was used to study theoretically the effects of some design and operating parameters on the channel wall heat flux. The results show that increasing thermal conductivity of tedlar increases the heat flux transferred from the two channel walls while increasing the thickness of the back EVA decreases the heat flux transferred from the two walls to airflow
Keywords-- heat flux, modeling, PV laminate, PV/T collector, thermal resistance.
I. INTRODUCTION
Energy is an intrinsic component in economic and human development all over the world. The energy demand has been on the rise due to the industrial and population growths in many countries worldwide. The convectional energy sources, particularly petroleum fuels, which have been the major sources of energy, are getting exhausted and their utilization has contributed greatly to global warming. The combustion of fossil fuels emits greenhouse gases
GHG), mainly CO2, which are discharged to the
atmosphere.
The GHGs accumulate in the troposphere and forms a skin layer which prevents escape of reradiated infrared radiation into the outer space but instead reflect it back causing the atmospheric temperature to increase hence global warming [1]. Thus, the challenge of any economy today is the provision of affordable energy to meet the rapidly growing demand of energy while simultaneously satisfying the increasing concern on the earth’s climate change.
Meeting the increasing energy demand in a sustainable way will not be possible without major changes in the energy supply and conversion systems. The shift to renewable energy resources, especially solar energy, is envisaged to be a practical solution to meet the world’s future energy demand as well as mitigating the adverse effects of climate change. The sun is an enormous source of energy in the universe and any known forms of energy owe its existence to the sun either directly or indirectly. The advantage of solar energy is its ability to be harnessed to provide the two widely sought forms of energy – heat and electricity, using various types of solar technologies. Photovoltaic (PV) systems are solar energy technologies which intercept sunlight and convert it into direct current (dc) electricity and are ideal for rural applications where grid electricity is not available. Solar thermal collectors, on the other hand, are solar technologies that collect the incoming solar radiation and convert it into heat through a heat transfer fluid (usually water or water) for heat production. A disparity exists on the extent of application of solar technologies between the developed and developing world. The application of both PV and solar thermal systems are high in developed countries but low in developing countries, mainly African continent, due to lack of awareness and high initial cost to majority of the rural population.
International Journal of Emerging Technology and Advanced Engineering
Website: www.ijetae.com (ISSN 2250-2459,ISO 9001:2008 Certified Journal, Volume 4, Issue 10, October 2014)
718 The waste heat is lost partly to the atmosphere, which contributes to global warming, while the remaining manifests as temperature rise in the solar cells. The rise in cell temperature, especially crystalline silicon solar cell, lowers its electrical conversion efficiency below its rating
[2] hence cooling is beneficial. Hybrid
photovoltaic/thermal (PV/T) systems are solar technologies that combine photovoltaic and solar thermal systems in one unit and are capable of producing both electrical and thermal energy simultaneously. Thus, PV/T systems are innovative solutions of increasing solar energy conversion efficiency in one unit compared to individual PV or solar thermal collector mounted side-by-side. The major benefit of PV/T system is the cooling achieved with the circulating colder fluid. The cold fluid will extract the heat from module and maintains cells’ temperatures, which in turn maintains the PV efficiency within acceptable level. The basic structure of a PV/T system consists of a PV module with a heat exchanger attached behind for heat extraction with a proper natural or forced fluid circulation. The heat extracted by the fluid is channeled through proper ducting for low temperature applications such as water-heating for domestic chores, space heating in buildings and drying in agricultural and industrial sectors.
Over the last few decades, efforts have been devoted to improving the performance of PV/T systems while reducing their costs. The early work on the PV/T systems was carried out by Wolf [3] who proposed the possibility of combined generation of heat and electricity from a PV installation for residential use. Numerous experimental and theoretical studies have been dose since the inception of PV/T system, both water- and air type PV/T systems. The focus has been on the design aspects that will results in higher efficiencies [4-10]. More recent works on PV/T systems focused mainly on design configurations and operating conditions that would result in increased electrical and thermal efficiencies [11-15]. These studies, however, have not considered the thermal resistance and hence temperature gradients across the thickness of the PV laminate. Study of this thermal resistance provides a lee-way to identify the mechanisms to increase the amount of heat extracted from the PV laminate to the flowing air in the channel. This paper presents theoretical analysis of a PV/T air system under natural flow mode. The effects of thermal resistance of the back tedlar and the thickness of the EVA adhesive between the cells and tedlar back on the heat flux to the air flow from the channel walls are presented.
The results show that increasing thermal conductivity of tedlar increases the heat flux transferred from the two channel walls while increasing the thickness of the back EVA decreases the heat flux transferred from the two walls
to airflow
.
II. THEORETICAL MODEL
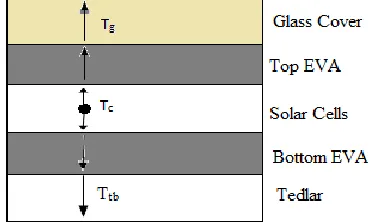
[image:2.612.327.567.276.400.2]Fig. I shows a schematic diagram of the PV/T Air system studied and the heat exchange between adjacent components of the PV/T system themselves and its surrounding.
Fig. I: Schematic diagram of a PV/T Air system
The system consists of a PV laminate, a rectangular air channel and a back insulation. The circulation of air in the
duct is by natural convection. The PV laminate consists of
the solar cells, the top glass cover and the tedlar joined together using EVA adhesive as shown in Fig. II.
[image:2.612.350.536.550.661.2]Energy balance equations between PV laminate, airflow in the duct, channel back wall and surrounding environment are usually constituted to solve for PV/T components’ temperatures and useful heat gain and have been reported in many papers [8]. These equations were used in the theoretical model developed.
International Journal of Emerging Technology and Advanced Engineering
Website: www.ijetae.com (ISSN 2250-2459,ISO 9001:2008 Certified Journal, Volume 4, Issue 10, October 2014)
719
A. Thermal Analysis
The heat transfer paths across the PV/T components are shown in Fig. III [9]. The heat transfer between the components of PV laminate is by conduction, while the heat lost at the top of the glass cover of the PV module is by radiation and convection due to wind blow above it. The heat is transferred from the channel walls to the airflow by convection and adequate back insulation is assumed making it adiabatic hence no heat loss through the back of the channel.
Fig. III: Thermal Resistance Network of the PV/T air System
The heat generated at the solar cells is partially conducted upwards through the top EVA adhesive into glass cover and downwards through the bottom EVA adhesive into tedlar back (see Fig. II). The heat conducted
upwards, qtop , is eventually lost to the ambient through the
surface of the glass cover and is calculated as:
)
(
c g pvtop
top
R
A
T
T
q
(1)Where Rtop is the thermal resistance of top EVA
adhesive, Apv is module area while Tc and Tg are the
temperatures of the cells and glass cover respectively. The thermal resistance of top EVA adhesive is given by:
g g
eva eva
si si top
k
L
t
k
t
L
K
L
R
,
,
2
/
(2)
Where Lsi, Lg and Leva,t are the thickness of silicon solar
cell, glass cover and top EVA layer respectively while ksi,
keva,t and kg are the thermal conductivities of these materials
in the same order.
The heat conducted downward, qbottom, passes through
the bottom EVA adhesive to the tedlar back which is eventually transferred by convection to airflow and by radiation into the channel back wall. It is calculated as:
)
(
c tb pvbottom
bottom
R
A
T
T
q
(3)Where Rbottom is the thermal resistance of bottom EVA
adhesive and Ttb is the tedlar temperatures. The thermal
resistance of the bottom EVA adhesive is given by
t t
b eva
b eva
si si top
k
L
k
L
K
L
R
, ,
2
/
(4)
Lt and kt are the thickness and thermal conductivity of
tedlar respectively
The useful heat gain, qu received by the airflow in the
duct is contributed by the heat convection from the channel
walls. qu is large if the amount of heat lost at the top, qt,
and that lost through the back insulation, qb, are very low:
2
1
q
q
q
u
(5)Where q1 is the heat transferred from the tedlar to
airflow and q2 is the heat transferred from the channel back
wall to air flow. The channel walls transfer heat to airflow by convection and are given respectively by:
)
(
1
A
ch
t fT
tbT
fq
(6a))
(
2
A
ch
b fT
bT
fq
(6b)Where Ac is collector area, ht-f is convective heat transfer
coefficient from tedlar to airflow, hb-f is convective heat
transfer coefficient from channel back wall to airflow, Tf is
mean air temperature in the duct and Tb is the back wall
temperature. Since the back insulation is assumed to be adiabatic, hence the heat lost by conduction through back
insulation is zero so that ht-f is considered to be equal to hb-f
[14]:
c f b f
t
h
h
International Journal of Emerging Technology and Advanced Engineering
Website: www.ijetae.com (ISSN 2250-2459,ISO 9001:2008 Certified Journal, Volume 4, Issue 10, October 2014)
720
Where hc is coefficient of heat transfer by convection
from the channel walls to air flowing in the duct. Since the airflow is by natural convection, the flow in the duct is assumed to be laminar, hence the convective heat transfer coefficient has can be evaluated by [15]:
h c
D
Nuk
h
(8)Where Nu is the Nusselt number, k is thermal
conductivity of air and Dh is hydraulic diameter. The
number expresses the ratio of convective to conductive heat transfer across the boundary layer and can be evaluated by the empirical correlation given by Hollands et al [16]:
1 5830 cos ) )) 8 . 1 (sin( cos 1708 1 44 . 1 1 3 1 6 . 1
Ra Ra Nu (9)Where is tilt angle of the collector while Ra is called
Raleigh number and is given by
Pr
2 3
g
T
l
Ra
(10)Where l is length of collector, is density of air, g is
acceleration due to gravity, µ is the dynamic viscosity of
air, is is thermal expansivity of air, T is temperature
difference between the channel walls and Pr is Prandtl number.
The hydraulic diameter for non-circular ducts is normally given as [17]:
) ( ) ( 2 H W H W Dh
(11)
Where W and H are channel width and depth
respectively.
III. RESULTS AND DISCUSSION
A. Model Validation
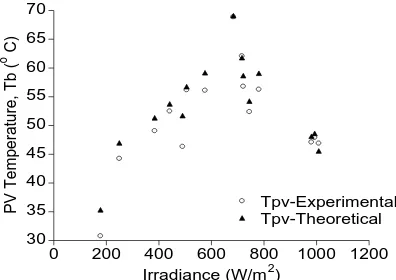
Validation of the model was done by comparing theoretical results generated from the model with experimental data measured on a similar prototype system. Fig. IV and fig. V show the comparison between the theoretical and experimental values of both the PV and the back plate temperatures.
The results show that the theoretical and experimental values agree very well.
The model was then used to analyze the performance of the PV/T systems under various design aspects and operating conditions. 30 35 40 45 50 55 60 65 70
0 200 400 600 800 1000 1200 Tpv-Experimental Tpv-Theoretical P V Te mpe ra tu re , T b (
o C
)
[image:4.612.346.544.228.368.2]Irradiance (W/m2)
Fig. IV: Validation of model using PV temperature
25 30 35 40 45 50 55 60
0 200 400 600 800 1000 1200 Tb-Experimental Tb-Theoretical B ack p lat e Te m pera tu re ,Tb (
o C
)
[image:4.612.345.539.417.560.2]Irradiance (W/m2)
Fig. V: Validation of model using back absorber plate temperature
B. Effects of Mass Flow rate
Fig. VI shows that the heat fluxes q1 and q2 increase with
International Journal of Emerging Technology and Advanced Engineering
Website: www.ijetae.com (ISSN 2250-2459,ISO 9001:2008 Certified Journal, Volume 4, Issue 10, October 2014)
721
30 40 50 60 70 80 90
20 25 30 35 40 45
0.00 0.01 0.02 0.03 0.04 0.05 0.06 0.07 q1
q2
W
al
l he
at fl
ux,
q1
W
all h
e
a
t f
lu
x,
q
2
[image:5.612.69.275.164.305.2]Mass flow rate (kgm/s)
Fig. VI: Effect of mass flow rate on heat flux
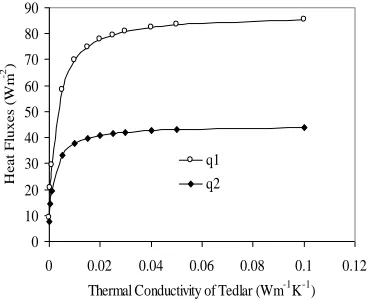
C. Effects of Thermal Conductivity of tedlar
The results in fig. VII shows that that an increase in the thermal conductivity of tedlar leads to a corresponding increase in the amount of heat transferred to the air from both surfaces of the air channel. This in turn will lead to a decrease in the PV cell temperature, which increases electrical efficiency. The results shows further that both heat fluxes tend to saturate when the thermal conductivity of tedlar is between 0.03 to 0.04 W/mK.
0 10 20 30 40 50 60 70 80 90
0 0.02 0.04 0.06 0.08 0.1 0.12
Thermal Conductivity of Tedlar (Wm-1K-1)
H
e
a
t F
luxe
s (
W
m
-2
)
q1 q2
Fig. VII: Effect of thermal conductivity of tedlar
D. Effects of thickness of bottom EVA layer
The heat fluxes q1 and q2 as depicted in Fig. VIII both
decreases with the thickness of bottom EVA layer. This is caused by the increase of thermal resistance of the EVA layer as its thickness increases.
68 70 72 74 76 78 80 82 84
37 38 39 40 41 42 43
0.000 0.002 0.004 0.006 0.008 0.010 0.012 q1
q2
H
e
a
t flu
x,
q
1
H
e
a
t f
lu
x,
q
2
[image:5.612.344.556.168.326.2]Thickness of bottom EVA layer (m)
Fig. VIII: Effect of thickness of bottom EVA layer
IV. CONCLUSION
The mechanisms to increase the wall heat flux are highly desirable for the overall efficiency of the PV/T system to be optimum. The results show that the heat transfer from the channel walls to the airflow increases as the thermal resistance of the tedler increases. Thus, in order to increases the performance or efficiency (both thermal and electrical) of a PV/T system, tedler of high thermal conductivity needs to be used. The results indicate that optimum thermal resistance occurs between 0.03 to 0.04 W/mk. On the other hand, as the thickness of bottom EVA adhesive layer increases, the heat fluxes from both walls decreases hence reduce both thermal and electrical efficiency of the PV/T systems. Hence for optimum performance of the PV/T systems, the EVA adhesive layer should be made as thin as is reasonably achievable but taking into considerable stability of bonding at high temperature due to thermal stresses.
REFERENCES
[1] Sanchez B.A. and Poschen P. The social and decent work
dimensions of a new Agreement on Climate Change. A Technical Brief (2009).
[2] Van Helden G.J, Zolingen R.J and Zondag H.A. PV thermal
systems: PV Panel supplying renewable electricity and heat. Prog. Photovolt: Res. Appl. 12 (2004): 415-426.
[3] Wolf, M. Performance analysis of combined heating and
[image:5.612.76.260.440.592.2]International Journal of Emerging Technology and Advanced Engineering
Website: www.ijetae.com (ISSN 2250-2459,ISO 9001:2008 Certified Journal, Volume 4, Issue 10, October 2014)
722
[4] Cox, C.H. and S.C. Raghuraman, Design considerations for flat-plate
photovoltaic/thermal collectors. Solar Energy, 35 (1985): 237-242.
[5] Garg, H.P., R.K. Agarwal and A.K. Bhargava, Study of a hybrid
solar system-solar air heater combined with solar cells. Energy Convers. Mgmt., 31 (1991): 471-479.
[6] Sopian, K., K.S. Yigit, H.T. Liu, S. Kakac and T.N. Veziroglu.
Performance analysis of photovoltaic thermal air heaters. Energy Convers. Mgmt., 37 (1996): 1657-1670
[7] Hegazy, A.A. Comparative study of the performances of four
photovoltaic/thermal solar air collectors. Energy Convers. Mgmt., 41 (1999): 861-881
[8] Tonui J. K. and Tripanagnostopoulos Y. Improved PV/T solar
collectors with heat extraction by forced or natural air circulation. Renewable Energy, 32(4), 2007, pp. 623–637.
[9] R. K. Koech et al. A Steady State Thermal Model For
Photovoltaic/Thermal (PV/T) System Under Various Conditions. International Journal of Scientific & Technology Research 1 ( 2012)
[10] Jin G.L, Ibrahim A., Chean Y.K, Daghigh R., Ruslan H., Mat S.
Othman M.Y and Sopian K. Evaluation of Single-Pass Photovoltaic-Thermal Air Collector with Rectangle Tunnel Absorber. American Journal of Applied Sciences, 7 (2010): 277-282.
[11] Joshi A.S, Tiwari A, Tiwari GN, Dincer I, Reddy BV. Performance
evaluation of a hybrid photovoltaic thermal (PV/T) (glass-to-glass) system. Int J. Therm. Sci; 48 (2009): 154–64.
[12] Adeli M.M , Farahat F.S. Experimental and Numerical Study for
Electrical and Thermal Performance Evaluation of a Photovoltaic Thermal (PV/T) Air collector. Proc. of the PSC 2010, 25th International Power System Conference.
[13] Barnwal, P. and Tiwari, G.N. Experimental Validation of Hybrid
Photovoltaic-Thermal (PV/T) Greenhouse Dryer under Forced Mode. Int. J. of Food Engineering, 6 (2010).
[14] Ibrahim A. Othman M.Y, Ruslan M.H,Mat S. Sopian K. Recent
Advances in flat plate photovoltaic/thermal (PV/T) solar collectors. Renewable and Sustainable Energy Reviews, 15 (2011): 352-365
[15] KamthaniaD. and Tiwari G. N. Determination of Efficiency of
Hybrid Photovoltaic Thermal Air Collectors Using Artificial Neural Network Approach for Different PV Technology. Int. J. of Information Technology, 2012, in press.
[16] Hollands K.G.T, Unny T.E, Raithby G.D., and Konicek L. Free
convection heat transfer across inclined air layers. J. Heat Transfer, 18 (1976): 443-448.
[17] Lee W.M., Infield D.G, Gottschalg R. Thermal modeling of building
integrated photovoltaic system. Proc. 17th, European PV Solar