
a t t ri b u t a b l e t o w a t e r-b o r n
e-p a t h o g e n s i n a r s e n i c-m i ti g a t e d
d ri n ki n g w a t e r i n We s t B e n g a l
a r e l a r g e ly i n d e p e n d e n t of t h e
m i c r o bi olo gi c al q u a li ty of t h e
s u p pli e d w a t e r
M o n d a l, D, G a n g u li, B, S e n Roy, S, H a l d e r, B, B a n e rj e e , N,
B a n e rj e e , M , S a m a n t a , M , Gi ri, A a n d Poly a , D
h t t p :// dx. d oi.o r g / 1 0 . 3 3 9 0 / w 6 0 5 1 1 0 0
T i t l e Di a r r h o e a l h e a l t h r i s k s a t t r i b u t a b l e t o w a t e r-b o r n e-p a t h o g e n s in a r s e n i c-m i ti g a t e d d r i n ki n g w a t e r in We s t B e n g a l a r e l a r g ely i n d e p e n d e n t of t h e m i c r o bi olo gic al q u ali ty of t h e s u p p li e d w a t e r
A u t h o r s M o n d al, D, G a n g u li, B, S e n R oy, S, H a l d er, B, B a n e r j e e , N, B a n e rj e e , M , S a m a n t a , M , Gi ri, A a n d Poly a, D
Typ e Ar ticl e
U RL T hi s v e r si o n is a v ail a bl e a t :
h t t p :// u sir. s alfo r d . a c . u k /i d/ e p ri n t/ 3 3 3 9 2 / P u b l i s h e d D a t e 2 0 1 4
fo r a n y f u r t h e r c o p y ri g h t r e s t r i c ti o n s .
Water2014, 6, 1100-1117; doi:10.3390/w6051100
water
ISSN 2073-4441www.mdpi.com/journal/water
Article
Diarrhoeal Health Risks Attributable to Water-Borne-Pathogens
in Arsenic-Mitigated Drinking Water in West Bengal are
Largely Independent of the Microbiological Quality of the
Supplied Water
Debapriya Mondal 1,2,3, Bhaswati Ganguli 4, Sugata Sen Roy 4, Babli Halder 2,5, Nilanjana Banerjee 1,2, Mayukh Banerjee 1,2,6, Maitreya Samanta 1,4, Ashok K. Giri 2 and David A. Polya 1,*
1 School of Earth Atmospheric and Environmental Sciences, University of Manchester,
Manchester M13 9PL, UK; E-Mails: [email protected] (D.M.); [email protected] (N.B.); [email protected] (M.B.); [email protected] (M.S.)
2 Molecular and Human Genetics Division, CSIR-Indian Institute of Chemical Biology,
4, Raja S.C. Mullick Road, Kolkata 700032, West Bengal, India;
E-Mails: [email protected] (B.H.); [email protected] (A.K.G.)
3 School of Environment and Life Sciences, University of Salford, Manchester M5 4WT, UK 4 Department of Statistics, University of Calcutta, 35 Ballygunge Circular Road, Kolkata 700019,
West Bengal, India; E-Mails: [email protected] (B.G.); [email protected] (S.S.R.)
5 Proteomic and Cell Signaling Lab, CSIR-Center for Cellular and Molecular Biology, Habsiguda,
Uppal Road, Hyderabad 500007, Andhra Pradesh, India
6 Department of Physiology, University of Alberta, 7-10 Medical Sciences,
Edmonton AB T6G 2H7, Canada
* Author to whom correspondence should be addressed; E-Mail: [email protected]; Tel.: +44-161-275-3818; Fax: +44-161-306-9361.
Received: 15 January 2014; in revised form: 1 April 2014 / Accepted: 16 April 2014 / Published: 29 April 2014
Abstract: There is a growing discussion about the possibility of arsenic mitigation measures in Bengal and similar areas leading to undesirable substitution of water-borne-pathogen attributable risks pathogens for risks attributable to arsenic, in part because of uncertainties in relative pathogen concentrations in supplied and end-use water. We try to resolve this discussion, by assessing the relative contributions of water supply and end-user practices to
water-borne-pathogen-attributable risks for arsenic mitigation options in a groundwater arsenic impacted area of West Bengal. Paired supplied arsenic-mitigated water and end-use drinking water samples from 102 households were collected and analyzed for arsenic and thermally tolerant coliforms [TTC], used as a proxy for microbiological water quality, We then estimated the DALYs related to key sequelae, diarrheal diseases and cancers, arising from water-borne pathogens and arsenic respectively. We found [TTC] in end-use drinking water to depend only weakly on [TTC] in source-water. End-user practices far outweighed the microbiological quality of supplied water in determining diarrheal disease burden. [TTC] in source water was calculated to contribute <1% of total diarrheal disease burden. No substantial demonstrable pathogen-for-arsenic risk substitution attributable to specific arsenic mitigation of supplied waters was observed, illustrating the benefits of arsenic mitigation measures in the area studied.
Keywords: arsenic in groundwater; mitigation; water-borne pathogens; health risk substitution; disease burden; West Bengal
1. Introduction
Millions of tube-wells have been drilled in the Bengal Delta both in West Bengal, India and in Bangladesh during the past few decades with the aim of providing pathogen-free drinking water. However, arsenic in these groundwaters constitutes a major health risk to millions of people using these waters for drinking, cooking or irrigation [1–4]. Hyperpigmentation and keratosis are amongst the most visible and widespread of the water-borne-arsenic-attributable diseases, whilst cancers of the skin, lung, bladder and liver are currently amongst the most serious [5]. To combat the arsenic crisis in West Bengal, the provision of alternative water sources is the main arsenic mitigation strategy. A key issue for public-health protection is that, in so improving water-supply services, consideration must also be given to the degree of public-health risk substitution, notably from water-borne pathogens.
There are, however, contrasting published views on the importance or otherwise of such risk substitution. Most published research on the health impacts of water and sanitation has focused on the incidence of diarrheal diseases [6] because these diseases quantitatively represent the most serious health risks arising from water-borne pathogens [7]. Esrey [8] and Clasen and Cairncross [9] both conclude that the prevalence of diarrheal diseases in developing countries, similar to (peri-)rural Bengal, is not related to improvements in water supply but rather to the status of improvements in sanitation and hygiene. In contrast, Howard et al. [10], using quantitative microbial risk assessment (QMRA) based upon measurements of pathogens in water supplies from arsenic mitigation schemes in Bangladesh, calculated that disease burden arising from water-borne pathogens, especially for waters from pond sand filters and rain water harvesting, were typically orders of magnitude more important than that arising from groundwater arsenic.
derived in turn from Esrey [8], that such substitution of water supplies would result in a 20% increase in diarrheal disease incidence. Although this 20% figure is indeed derivable from Esrey’s [8] data, it is also apparent from a cursory examination that it is associated with a large uncertainty which makes it statistically indistinguishable from 0% Esrey [8] themselves did not consider the observed difference to be significant, and concluded that the lack of significant difference arose because of confounding factors, principally related to sanitation and hygiene in end-user households. Hence Lokuge et al. [11] usage of this 20% datum is subject to question but, equally, the lack of power of Esrey’s [8] study, which covered many different countries and continents, indicates that derivation of an accurate figure might require a more geographically-focused study, explicitly considering the differences between the microbial quality of supplied water and water at the point of use.
The aim of our work, therefore, was to obtain data to help resolve these differences and, in particular, to test, in a well-constrained geographically focused groundwater-arsenic-impacted area:
(i) Can pathogen-attributable health risks arising from water at point-of-use (i.e., end-use) be predicted from the microbiological quality of supplied (as opposed to end-use, household) water? or, as Esrey [8] hypothesizes, is post-supply contamination of water (either outside and/or inside the household) more important to the microbiological quality of end-use water than the microbiological quality of the supplied water?
(ii) Have specific arsenic-mitigation measures led to a net overall increase in water-borne attributable health risks, as has been suggested by Lokuge et al. [11] for water supply improvements in nearby Bangaldesh?
The area selected for this study, Chakdha Block of Nadia District, West Bengal fulfils the requirements of being (i) geographically focused; (ii) an arsenic impacted area [1,13,14]; (iii) the site of several different arsenic mitigation strategies [15]; (iv) well studied with background information available [14–16] and (v) straightforward logistically. We calculated disability adjusted life years (DALYs) as a mean of comparing disease burden arising from the two water-borne hazards: arsenic and pathogens. These calculations require the measurement of distributions of arsenic and pathogens in drinking water. Whilst arsenic concentration can be used directly in these calculations, in the absence of a comprehensive method to estimate the specific pathogens for waterborne-pathogen-attributable health risks, we used thermally tolerant colliforms [TTC] as a proxy, being the indicator organisms for the reference pathogens used for modeling the pathogen-attributable health risks [17].
2. Materials and Methods
2.1. Sample Collection and Analysis
treatment plants typically use absorption or adsorption based chemical treatment methods on hand-pumped tubewells. No documentation of chlorination treatment for any of the water supplies was found. For the purposes of this study, “source water” is defined as the water supply from whence the drinking water was collected and “household drinking water”, abbreviated throughout to “end-use” water, is defined as the water, typically stored in a container inside the household, which was ultimately used for drinking. We noted the type of container used to store drinking water in each household and completed an observer-administered questionnaire as a part of a related study, from which, information on the type of household (mixed/mud), the level of education of the respondent and the frequency of cleaning of household water containers (weekly/daily) were collected. After collection, we stored the water samples in an ice box and transported it to the Indian Institute of Chemical Biology (IICB), Kolkata where they were either refrigerated for subsequent arsenic analysis or analyzed within 4–6 h of collection for TTC.
We estimated the abundance of TTC using an Oxfam Del Agua® portable water testing kit by a membrane filtration method. In this method, water-borne bacteria from 100 mL samples were collected on pre-sterilized membrane filters (25.4 mm diameter; 0.45 μm pore-size), the filters were then incubated in a lauryl sulfate broth media at 44 °C for 18 h and the yellow colonies formed counted and recorded as individual thermo-tolerant coliforms. To establish the precision of the method we have done replicate analysis, including by different operators, while we validated the method through a comparison with analyses of replicate samples by the All India Institute of Hygiene and Public Health (AIIHPH) by a maximum probable number (MPN) technique following that of the Environment Agency [18]. In each incubation cycle we included a negative control consisting of sterile water, processed in the same way as the samples. We analyzed water samples for total arsenic by inductively coupled plasma mass spectrometry (ICP-MS) (Agilent 7500 Series ICP-MS) at the University of Manchester following the method outlined by Mondal et al. [14].
2.2. Statistical Analysis
We calculated the overall summary statistics for [TTC]end-use and then stratified by each of the risk factors: (i) whether or not [TTC]source was zero; (ii) the type of mitigation option from which the water was collected; (iii) the type of house; (iv) the education level of the householder; (v) the type of container used to store the drinking water and (vi) the frequency of cleaning of the container. We have used cross tabulation to estimate the mean and standard deviation of [TTC]end-use stratified by these factors. Due to significant over-dispersion in the data, we used Quasi Poisson regression to model the dependence of [TTC]end-use counts on [TTC]source. We screened the predictors for inter-relationships using Pearson’s Chi-squared test of association and variables found to have strong associations (a strong association between the education of the respondent with the type of house (p < 0.005) was observed as well as the type of storage container with its cleaning frequency (p < 0.05)) were dropped as a check against multi-co-linearity.
The following model Equation (1) was fitted to the data:
E ([TTC]end-use) = λ; Var ([TTC]end-use) = ϕλ (1)
logλ = β0 + β1([TTC]source =0) + β2([TTC]source− 1)([TTC]source > 0) + γ2(Mitigation = TP) + γ3(Mitigation = DTW) + δ3(Type of house = Mud) + θ2(Container cleaning frequency = Weekly) + (γβ)2([TTC]source > 0)(Mitigation = TP) +(γβ)3([TTC]source > 0)(Mitigation = DTW) +
(γδ)([TTC]source > 0)(Type of house = Mud) + (γθ)2([[TTC]source > 0)(Container cleaning frequency = Weekly)
(2)
where E and Var denote the estimated value and variance respectively, and where β0, β1, γ2, γ3, δ3, θ2, (γβ)2, (γβ)3, (γδ) and (γθ)2 are empirically determined model parameters, the latter 4 representing interaction parameters.
Note that β1 measures the shift in the average values of [TTC]end-use depending upon whether or not TTC was present at source and β2 represents a linear effect of [TTC]source on [TTC]end-use given that [TTC]source is non-zero. Other potential confounders included in the model are the type of mitigation option employed by the family, the type of house and the frequency with which the storage container for water was cleaned. The model allows for an interaction between whether or not TTC is present at source and each of the other risk factors. We used Cook’s distance to determine influential values (typically outliers) and to test the robustness of the list of significant model parameters to the deletion of these values. We also used analysis of deviance to find the relative predictive power of each of the factors towards [TTC]end-use.
To explore the presence of a possible non linear effect of [TTC]source on [TTC]end-use, we refitted the above model after categorising [TTC]source as 0, 0–2, 2–8 and 8–80 CFU/100 mL. We also fitted a Tobit model to the [TTC]end-use values with [TTC]end-use > 0 to find the significant predictors (Tobit analysis is a technique borrowed from econometrics where it has been used to find significant predictors of expenditure on a commodity given that not all consumers may have a propensity to buy it. The parallel here is that not all households have positive [TTC]end-use). We employed Simulation Extrapolation (SIMEX) to explore the consequences of measurement error in [TTC]source resulting in misclassification error. The effect of up to 8% misclassification error in [TTC]source = 0 being classified as positive was explored. Jackknife estimates of variance were also used. We used the statistical software package R for all statistical calculations.
2.3. Risk Models and Input Parameters
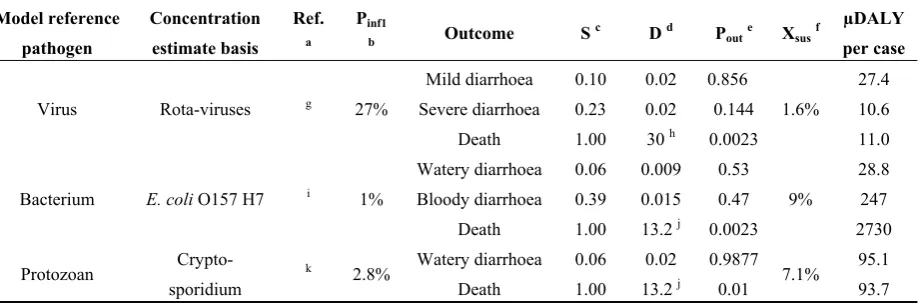
We estimated the pathogen-attributable health risks in terms of DALYs using the QMRA model of Howard [10] (Figure 1) and compared it to arsenic-attributable DALYs calculated using the risk model of Mondal [16] (Figure 2). In the absence of comprehensive dose-response data for sequela arising from exposure to water-borne pathogens and to arsenic, we have restricted our calculations to sequelae considered to be the dominant detrimental health outcomes arising from each agent, viz. diarrheal diseases for water-borne pathogens and combined skin, lung, liver and bladder cancers for arsenic.
The input parameters for the estimation of pathogen concentrations based on the E. coli
the QMRA model based on the data by Havelaar and Melse [19] and Howard [10]. The outcome, severity, duration and probability of infection data are based on the values given by Havelaar and Melse [19] while the susceptible fraction data were obtained from Howard [10] for the population of Bangladesh.
Figure 1. Schematic of the QMRA model [10] for pathogen-attributable health risks.
Figure 2. Schematic of the model for arsenic attributable health risks [16].
Disease outcome- Diarrhoea and death DALYs per infection Intake of un
boiled drinking water
Duration
Susceptible fraction [Ecoli] in water
Disability weight [TTC] in water
Annual DALY rates Risk of infection per
year, Pinf,y
Risk of infection per day, Pinf,d
[Pathogen] in water
Dose response relationship
Probability of infection or of death
Dose response relationships Probabilistic Risk
assessment for lung bladder, liver and skin
cancer
Annual death and DALY
rates Average duration of the
case until remission or death Census data
Disability weight Measured As in
the source
Exposure distribution
f (Age, Gender, Location)
[image:8.595.119.477.461.724.2]Table 1. Input parameters for exposure assessment for QMRA model.
Input variable Fitteddistribution Parametervalue Reference
[TTC]environmentalorigin lognormal 15% (7.5%, 30%) b Howard [10]
[E.Coli]:[Viruses] lognormal 105 (104, 106) b Howard [10]
[E.Coli]:[Bacteria] lognormal 105 (104, 106) b Howard [10]
[E.Coli]:[Protozoa] lognormal 106 (105, 107) b Howard [10]
Notes: a The remainder of the thermally tolerant coliforms are considered to be of faecal origin and assumed
to be E.Coli for the purposes of calculating a pathogen concentration; b Mean (5th percentile, 95th percentile).
Table 2. Microbial dose-response data based upon literature cited by Howard [10] and µDALYs per reference pathogen microbial infection after Havelaar and Melse [19].
Model reference pathogen Concentration estimate basis Ref. a Pinf1
b Outcome S
c D d P
oute Xsusf
µDALY per case
Virus Rota-viruses g 27%
Mild diarrhoea 0.10 0.02 0.856
1.6%
27.4
Severe diarrhoea 0.23 0.02 0.144 10.6
Death 1.00 30 h 0.0023 11.0
Bacterium E. coli O157 H7 i 1%
Watery diarrhoea 0.06 0.009 0.53
9%
28.8
Bloody diarrhoea 0.39 0.015 0.47 247
Death 1.00 13.2 j 0.0023 2730
Protozoan
Crypto-sporidium
k 2.8% Watery diarrhoea 0.06 0.02 0.9877 7.1% 95.1
Death 1.00 13.2 j 0.01 93.7
Notes: a Basis for infectivity estimation; b Probability of infection for a dose of 1; c Severity; d Duration; e Probability of outcome, viz. infection or death, cf. P
inf of Howard [10]; f Susceptible fraction; g Human
feeding trial of rotavirus model of Gerba [20] (cited by [10]); h Average death at age of 1 was assumed for
rotavirus infected diarrhea [2] leading to loss of 30 years of healthy life based on the data of the GBD study [21]; i Human feeding trial of Shigella dysenteri model of Holcomb [22] (cited by [10]); j The mean loss of life associated with 1 fatal case of cryptosporidiosis and E.coli O157 infection was estimated
as 13.2 years [2]; k Human feeding trial for C.parvum model of Messner[23] (cited by [10]).
The input parameters for the arsenic risk assessment model were same as described by Mondal et al. [16] with incidence rates being calculated based on the NRC [24] dose-response function, which in turn is based on the Weibull multistage model, predicting the incidence rate of arsenic induced lung, bladder, skin and liver cancer as a function of age, gender and arsenic concentration in drinking water.
3. Results and Discussion
3.1. Quality Control
Arsenic concentration in a standard water reference material (SRM 1640) was measured as 27.8 ± 0.4 µg/L (n = 3) in agreement with the certified value of 26.6 ± 0.4 µg/L. Analyses of arsenic for ARS29-32 groundwater samples, undertaken as part of an Inter Laboratory Quality Evaluation [25], were found to be within 12% of the indicative values in the range 66–330 µg/L.
[image:9.595.73.533.260.413.2]deviation between the analysis done by the method outlined here and by an MPN method at AIIHPH (n = 37) was 37%. No non-zero TTC values were found for any negative controls (n = 18).
3.2. Water Analysis
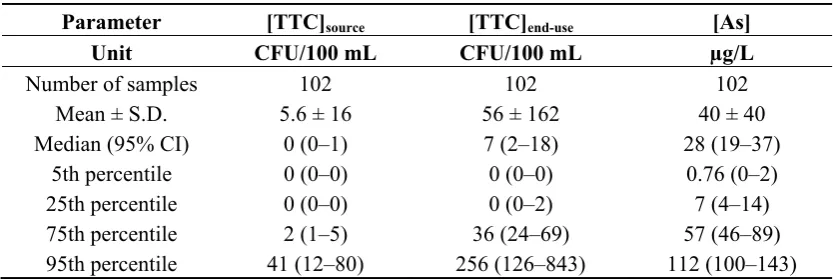
[image:10.595.89.506.372.512.2]Table 3 presents the arithmetic mean ± SD, median (95% CI) and percentiles (95% CI) for [TTC]source, [TTC]end-use and arsenic (As) in drinking water for the whole study area. We found [TTC]end-use to be typically greater than [TTC]source for most of the paired samples with almost no correlation between them (Figure 3). The mean and median [TTC]source for DTWs in this study (0 CFU/100mL) are very comparable to that observed by Howard et al. [10] in similar areas in Bangladesh. The observed median arsenic concentration, 28 µg/L is comparable to that previously observed by Mondal et al. [16] of 27.9 µg/L (n = 2171). We found no significant correlation between As and [TTC]source (Figure 4) and observed TTC and As in source water to be the highest for the treatment plants among the three different mitigation options. A Kruskal-Wallis test to determine the differences in [TTC]source between the three different mitigation options, showed DTWs to have significantly lower [TTC]source (p < 0.05) compared to TP and TW.
Table 3. Summary of water analyses.
Parameter [TTC]source [TTC]end-use [As]
Unit CFU/100 mL CFU/100 mL µg/L
Number of samples 102 102 102
Mean ± S.D. 5.6 ± 16 56 ± 162 40 ± 40
Median (95% CI) 0 (0–1) 7 (2–18) 28 (19–37)
5th percentile 0 (0–0) 0 (0–0) 0.76 (0–2)
25th percentile 0 (0–0) 0 (0–2) 7 (4–14)
75th percentile 2 (1–5) 36 (24–69) 57 (46–89)
95th percentile 41 (12–80) 256 (126–843) 112 (100–143)
Table 4 presents [TTC]end-use stratified by the different risk factors for this study. We found [TTC]end-use was higher for households with positive [TTC]source than for those with [TTC]source = 0. [TTC]end-use was found to be highest for the water sourced from TW for the studied area. It was also noted that people using TW mostly use the water for drinking, cooking and washing (75%) whereas people using the DTW and TP used the water either only for drinking (23%) or for drinking and cooking (75%). We also observed that [TTC]end-use was higher for respondents living in mud houses having primary education and storing the water in big mouth containers such as buckets and hari.
Figure 3. Cross-plot of thermally tolerant coliforms [TTC] in supplied and end-use drinking water from households in Chakda Block, West Bengal, India. The correlation between [TTC]end-use and [TTC]source is extremely poor—thus [TTC]source is an extremely poor predictor of [TTC]end-use and hence of water-borne pathogen attributable health risks to householders. For the majority of households, [TTC]end-use >> [TTC]source suggesting that post-supply contamination, either during transport to the household or within the household is an important process.
[image:11.595.143.454.559.781.2]Table 4. [TTC]end-use classified by independent or predictor variables.
Variable Classification criteria Mean [TTC]end-use SD [TTC]end-use
[TTC]source =0 45 114
>0 77 207
Mitigation type
TW (tap water) 101 239
TP (treatment plant) 38 51
DTW (deep tube well) 21 55
Highest level of education
Higher 39 123
Middle 4.0 0.0
Primary 89 250
Nil 28 37
Type of storage container
Bottle 38 73
Jug 2.7 4.6
Pitcher 46 129
Jar 17 30
Bucket 129 301
Hari 260 198
Cleaning frequency Daily 72 192
Weekly 34 80
Table 5 presents the results of fitting the regression model. The model, when refitted after dropping outliers and influential values, produced similar results. The results indicate that the linear term for [TTC]source is significantly positive (p-value = 0.002), that is, among those with positive [TTC]source, [TTC]end-use has a significant linear relationship with [TTC]source after adjusting for other confounders. The estimate for the linear term is 0.05301 (95% confidence interval = (0.025, 0.0933)) indicating that if all other factors remaining constant, a unit increase in [TTC]source will lead to a 1.054440 (=exp(0.05301)) fold increase in [TTC]end-use. In general, we can say that an x unit increase in [TTC]source will lead to an exp(0.05301x) fold increase in [TTC]end-use if the source water is contaminated. It was further noted that DTW users have significantly lower [TTC]end-use. Cross tabulations of the predictors revealed that DTW users are more likely to live in mud houses, and have higher education levels. None of the other interactions were statistically significant at the 5% level. However the direction of the estimated coefficients suggests that positive [TTC]source leads to lowest [TTC]end-use for those using water from treatment plants (TP) followed by tap water (TW) and then deep tube wells (DTW). Positive [TTC]source leads to lower [TTC]end-use for those living in mixed houses than for those living in mud houses. The main effect and interactions are marginally significant for the cleaning frequency of the storage container. If [TTC]source = 0, then weekly cleaning leads to a 0.45 (=exp(−0.79202)) fold reduction in [TTC]end-use whereas if [TTC]source > 0, weekly cleaning leads to a 1.8 fold increase in [TTC]end-use.
significant contrasts after correcting for multiple comparisons. Based on the results of the Tobit analysis we found a highly significant effect of the linear term for [TTC]source (p-value = 0.0004). The analysis did not find evidence for a significant effect of any of the other risk factors. Finally the output from application of the SIMEX algorithm showed that the interactions were no longer marginally significant but the other estimates and p-values continued to be similar.
Table 5. Regression model a of [TTC]end-use.
Variable Estimate Standard Error t Pr (>|t|) b
(Intercept) 1.48749 1.32 1.125 0.26
(if [TTC]source = 0) 2.93330 1.37 2.145 0.035 *
([TTC]source− 1) * (if [TTC]source > 0) 0.05301 0.02 3.167 0.0021 **
(Type of mitigation = TP) −0.61338 0.43 −1.415 0.16
(Type of mitigation = DTW) −1.75188 0.57 −3.084 0.0027 **
(Type of house = Mud) −0.17066 0.53 −0.322 0.75
(Cleaning frequency = Weekly) −0.79202 0.45 −1.751 0.084 (if [TTC]source > 0)
* (Type of mitigation = TP) −0.77046 1.10 −0.703 0.48
(if [TTC]source > 0)
* (Type of mitigation = DTW) 0.87905 1.08 0.813 0.42
(if [TTC]source > 0)
* (Type of house = Mud) 2.23692 1.48 1.507 0.14
(if [TTC]source > 0)
* (Cleaning frequency = weekly) 1.41970 0.80 1.764 0.081
Notes: a Dispersion parameter for quasi poisson family taken to be 51.374; b Significance codes: 0 < *** <
0.001 < ** < 0.01 < * < 0.05 < 0.1 << 1.
3.3. Calculated Health Risks
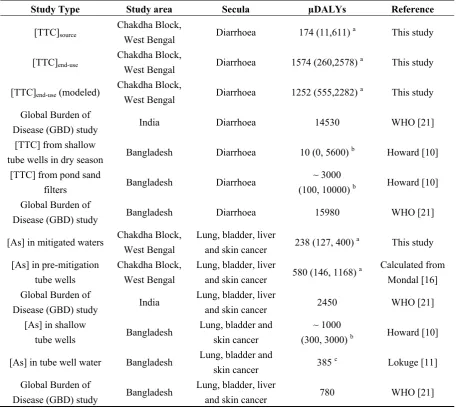
[image:13.595.67.533.631.788.2]Table 6 summarizes the input parameters estimated in this study for the calculation of disease burden. Table 7 gives a comparison of disease burdens, expressed as DALYs, arising from the measured arsenic and TTC, and based on the input parameters estimated in this study and rest of the parameters as detailed in previous sections along with the DALYs reported by previous authors and publications.
Table 6. Input parameters for DALY estimation.
Input
variable Unit
Type of fitted
distribution Parameters Value Source
[TTC]source CFU/100 mL Extreme value Location parameter Scale parameter 1.24 4.76 This study This study
[TTC]end-use CFU/100 mL Extreme value Location parameter Scale parameter 18.34 48.46 This study This study
[As] µg/L Beta General
Shape parameters 0.64, 3.50 This study
Minimum 0.2 This study
Maximum 254.78 This study
Water intake L/person/day lognormal Mean 2.50 Mondal [14]
Table 7. Comparison of disease burdens (expressed in µDALYs/person/year) from exposure to waterborne arsenic or pathogens or global country-wide estimates.
Study Type Study area Secula µDALYs Reference
[TTC]source
Chakdha Block,
West Bengal Diarrhoea 174 (11,611)
a This study
[TTC]end-use
Chakdha Block,
West Bengal Diarrhoea 1574 (260,2578)
a This study
[TTC]end-use (modeled)
Chakdha Block,
West Bengal Diarrhoea 1252 (555,2282)
a This study
Global Burden of
Disease (GBD) study India Diarrhoea 14530 WHO [21] [TTC] from shallow
tube wells in dry season Bangladesh Diarrhoea 10 (0, 5600)
b Howard [10]
[TTC] from pond sand
filters Bangladesh Diarrhoea
~ 3000
(100, 10000) b Howard [10]
Global Burden of
Disease (GBD) study Bangladesh Diarrhoea 15980 WHO [21]
[As] in mitigated waters Chakdha Block, West Bengal
Lung, bladder, liver
and skin cancer 238 (127, 400)
a This study
[As] in pre-mitigation tube wells
Chakdha Block, West Bengal
Lung, bladder, liver
and skin cancer 580 (146, 1168)
a Calculated from
Mondal [16] Global Burden of
Disease (GBD) study India
Lung, bladder, liver
and skin cancer 2450 WHO [21] [As] in shallow
tube wells Bangladesh
Lung, bladder and skin cancer
~ 1000
(300, 3000) b Howard [10]
[As] in tube well water Bangladesh Lung, bladder and
skin cancer 385
c Lokuge [11]
Global Burden of
Disease (GBD) study Bangladesh
Lung, bladder, liver
and skin cancer 780 WHO [21]
Notes: a Median µDALYs with 25th and 75th percentiles; b Based on the figures of Howard [10] with 90% confidence
interval; c Considering only Bangladesh population exposed to drinking water with [As] > 50 µg/L.
3.4. Water Quality
Based on the regression analysis we observed that the contamination of end-use water largely depends on whether the source water is contaminated or not rather than any other predictors. Hence the fate of [TTC]end-use is predicted in a different way for [TTC]source = 0 and [TTC]source > 0. Once the source water is contaminated, [TTC]end-use increases exponentially irrespective of other factors. In a study in Sierra Leone, Clasen and Bastable [28] observed a 200 fold increase in [TTC]end-use with respect to [TTC]source when the source was contaminated compared to when the source was not contaminated.
Significantly high [TTC]end-use compared to [TTC]source (Figure 3) supports evidences from previous studies that have shown the importance of fecal contamination of drinking water after collection associated with household storage linked to water handling and hygiene practices. Eshcol et al. [29] illustrated 36% households have their water being contaminated by fecal coliforms on storage within 24–36 h of collection for a study at Andhra Pradesh, India (n = 50). We observed, the overall [TTC]end-use to be higher for people living in mud houses (Table 4). The type of house- mixed or mud as observed in this study, acts as a proxy for wealth, reflects the sense of personal hygiene, with mixed being better than mud suggests that contamination within the household is a likely factor in controlling the end-use water contamination.
The significant difference in [TTC]source between the three different mitigation options and TP and TW being significantly higher than DTW suggests that much of the pathogen loading in TP and TW is attributable to contamination arising from storage of waters during the treatment for arsenic removal and/or in the distribution network of tap water supply. The overall [TTC]end-use is found to be lower for DTW users, in spite of the fact that DTW users more likely dwell in mud houses.
Our study shows that wide-mouth open containers such as buckets or Hari had higher potential risk of contamination than narrow-mouth vessels such as bottles, jugs or pitchers (Table 4)—we speculate that the contamination could arise while fetching water from wide-mouth containers by dipping. Clasen and Bastable [28] indicated that using a tap or spigot to access water is protective of stored water quality compared with water accessed by dipping.
3.5. Disease Burden—Pathogens in Source vs. End-Use Water
further noted that the transmission of water-borne-pathogens may be linked to a lack of water linked in turn to inadequate personal hygiene and use of contaminated water for cleaning [12]. In this study, we observed that the [TTC]/100 mL in pond water (median 3490, interquartile range 1680–7125, n = 6) and dugwell water (median 1440, interquartile range 1120–2442, n = 5), both extensively used for washing and bathing in Chakdha block, were extremely high and may represent an important source of exposure to water-borne pathogens unrelated to the quality of either supplied or end-use drinking water.
The links between water and health are complex and errors may arise from: (i) for developing countries recall-data on diarrhoea prevalence from cross-sectional studies may be too insensitive with chances of misclassification [8]; (ii) the GBD estimate is for the whole of India and there could be possible local variation in diarrheal disease incidences; and (iii) potential flaws of the DALY approach, given the present availability of data [19]. Important but almost inevitable shortcomings are the uncertainties associated with the model input parameters which can be reduced with further research in the fields of country specific Pathogen: E coli ratios and country specific probabilities of infection for reference pathogens as well a more quantitative understanding of differences in post-supply pathogen contamination arising from outside and inside households. Notwithstanding this, verification of the microbial quality of drinking-water by testing for TTC as an indicator of faecal pollution provides conclusive evidence of recent faecal pollution that should not be present in drinking-water. While TTC is a useful indicator, it has limitations. Enteric viruses and protozoa are more resistant to disinfection; consequently, the absence of TTC will not necessarily indicate freedom from these organisms [26]. Under certain circumstances, such as high levels of viral and parasitic diseases in the community it may be desirable to include the estimation of more resistant microorganisms, such as bacteriophages and/or bacterial spores [26] as indicator organisms. In addition, it is important to note that, although diarrheal diseases are probably the largest contributor to the disease burden from water, sanitation and hygiene, it cannot entirely be attributed to these factors because it is also transmitted through food and through air [12].
Lastly, we note that water quality can vary rapidly, and all systems are subject to occasional failures [26] which can have a disproportionate impact on disease. Rainfall can greatly increase the levels of microbial contamination in source waters and waterborne outbreaks often occur following rainfall [26] and this is apparent from the study on seasonal variation for the observed seven sources (Figure 5). Results of the daily, continuous monitoring of Cryptosporidium in drinking water in the UK showed that the Cryptosporidium concentration generally followed a continuous trend, however, in some cases a trend break was detected which dominated the mean health risk hence frequent monitoring rather than the point data as obtained for this study would be required to detect such events [30]. Thus, whilst we report here relative magnitudes of pathogen and arsenic attributable health risks calculated from our small study, the uncertainties on the calculated risks are considerable and further work, including stochastic treatment of the QMRA [30] is required to obtain a more reliable result.
estimate increase in diarrheal incidences when there is a shift from existing water sources that are arsenic contaminated to arsenic mitigated options having potential for microbiological contamination. We also note that our datum is significantly higher than 0, reflecting that arsenic mitigated water supplies can be prone to microbiological contamination. This indicates that efforts to minimise microbiological contamination at source, for example chlorination of the source water for deactivating water-borne pathogens, done on a frequent and regular basis and accompanied by appropriate monitoring in order for its effectiveness, are indicated [2]. Additional treatment at household level is indicated for the more effectively reduction of diarrheal disease incidences. Among the various approaches to household-based water treatment are heat and UV radiation, sedimentation, filtration and chemical treatment (coagulation, flocculation, precipitation, adsorption and disinfection) [28].
Figure 5. Seasonal variation in [TTC]source for water supplied from arsenic removal treatment plants (TW), deep tube wells (DTW) and tap waters (TP) in Chakdha Block, West Bengal, India. The lines are a visual aid to link samples from the same well but are not intended to indicate a determined trend. Nevertheless, the data suggest that other than the occasional spike (TP1, March), [TTC]source is most commonly highest in October/November near the end of the monsoon season (June–October).
3.6. Overall Change in Disease Burden Arising from Arsenic Mitigation
We observe (Table 7) that DALYs calculated as arising from As in mitigated waters in this study (238 µDALYs/person/year) are less than half of those calculated for As in pre-mitigation wells (580 µDALYs/person/year) in the same area using data reported from previous studies [16]. Both these values are substantially less those arising (1000 µDALYs/person/year) from unmitigated shallow wells in similar areas in Bangladesh. The arsenic mitigations considered here therefore have clearly resulted in a substantial reduction in drinking water arsenic attributable health risks in the study area.
Thus, the combined DALYs arising from both [TTC]source and As in mitigated wells in this study (424 µDALYs/person/year) represents, on average, a reduction in disease burden as a result of the arsenic mitigation methods—we thus find no evidence in this small study for significant risk substitution resulting in a net increase in overall water-borne disease burden for the sequelae considered here.
4. Conclusions
This small study on fecal contamination of arsenic mitigated source and end-use water for an arsenic impacted area of West Bengal, India demonstrates that the microbiological quality of end-use water in such areas can be largely independent of that of the source water. In part because of this, the specific arsenic mitigations studied here have not been found to substantially result in risk substitution, although the DALY estimates made have significant uncertainties. The results indicate that far greater public health benefits are to be made through improving sanitation and hygiene facilities and practice and through the removal or avoidance of arsenic than from only improving the microbiological quality of supplied water.
Acknowledgments
We acknowledge funding from the British Council United Kingdom Education and Research Initaitive (UKIERI) for the Probabilistic Risk Assessment Modelling for groundwater Arsenic Mitigation (PRAMA) project (SA07-09) to David Polya and Ashok Giri, from the United Kingdom Natural Environment Research Council (NERC) for a Dorothy Hodgkins award to Debapriya Mondal and Council of Scientific and Industrial Research of India (CSIR) funding to Mayukh Banerjee, Nilanjana Banerjee and Babli Halder We thank Paul Lythgoe of the Manchester Analytical Geochemistry Unit for support with chemical analysis. We thank Messrs Dave and Sundaraj of the United Nations Children’s Fund (UNICEF) and Ross Nickson for advice and access to a database, which was generated by the West Bengal Public Health Engineering Department (PHED)/UNICEF with funding from AusAID, the UK Department for International Development (DfID) and the Swedish International Development Cooperation Agency (SIDA). We thank two anonymous reviewers for their thoughtful and detailed comments which enabled us to considerably improve the clarity of the manuscript.
Author Contributions
Conflicts of Interest
The authors declare no conflict of interest.
References
1. Mondal, D.; Polya, D.A. Rice is a major exposure route for arsenic in Chakdaha block, Nadia district, West Bengal, India: A probabilistic risk assessment. Appl. Geochem. 2008, 23, 2987–2998. 2. Polya, D.; Charlet, L. Rising arsenic risk? Nat. Geosci. 2009, 2, 383–384.
3. Chakraborti, D.; Das, B.; Rahman, M.M.; Chowdhury, U.K.; Biswas, B.; Goswami, A.B.; Nayak, B.; Pal, A.; Sengupta, M.K.; Ahamed, S.; et al. Status of groundwater arsenic contamination in the state of West Bengal, India: A 20-year study report. Mol. Nutr. Food Res. 2009, 53, 542–551. 4. Ravenscroft, P.; Richards, K.; Brammer, H. Arsenic Pollution: A Global Synthesis;Wiley-Blackwell:
Chichester, UK, 2009.
5. Smith, A.H.; Steinmaus, C.M. Arsenic in drinking water. Br. Med. J. 2011, 342, doi: 10.1136/bmj.d2248.
6. Esrey, S.A.; Potash, J.B.; Roberts, L.; Shiff, C. Effects of improved water-supply and sanitation on ascariassis, diarrhea, dracunculiasis, hookworm infection, schistosomiasis and trachoma.
Bull. World Health Organ. 1991, 69, 609–621.
7. WHO Water Sanitation and Health. Available online: http://www.who.int/water_sanitation_health/ diseases/diarrhoea/en/ (accessed on 1 November 2011).
8. Esrey, S.A. Water, waste, and well-being: A multicountry study. Am. J. Epidemiol. 1996, 143, 608–623.
9. Clasen, T.F.; Cairncross, S. Editorial: Household water management: Refining the dominant paradigm. Trop. Med. Int. Health 2004, 9, 187–191.
10. Howard, G.; Ahmed, M.F.; Teunis, P.; Mahmud, S.G.; Davison, A.; Deere, D. Disease burden estimation to support policy decision-making and research prioritization for arsenic mitigation.
J. Water Health 2007, 5, 67–81.
11. Lokuge, K.M.; Smith, W.; Caldwell, B.; Dear, K.; Milton, A. The effect of arsenic mitigation interventions on disease burden in Bangladesh. Environ. Health Perspect. 2004, 112, 1172–1177. 12. Pruss, A.; Kay, D.; Fewtrell, L.; Bartram, J. Estimating the burden of disease from water,
sanitation, and hygiene at a global level. Environ. Health Perspect. 2002, 110, 537–542.
13. SOES. Groundwater Arsenic Contamination in West Bengal-India (20 years study). Available online: http://www.soesju.org/arsenic/arsenicContents.htm?f=wb.htm (accessed on 1 November 2011). 14. Mondal, D.; Banerjee, M.; Kundu, M.; Banerjee, N.; Bhattacharya, U.; Giri, A.K.; Ganguli, B.;
Sen Roy, S.; Polya, D.A. Comparison of drinking water, raw rice and cooking of rice as arsenic exposure routes in three contrasting areas of West Bengal, India. Environ. Geochem. Health 2010,
32, 463–477.
16. Mondal, D.; Adamson, G.C.D.; Nickson, R.; Polya, D.A. A comparison of two techniques for calculating groundwater arsenic-related lung, bladder and liver cancer disease burden using data from Chakdha block, West Bengal. Appl. Geochem. 2008, 23, 2999–3009.
17. Gray, N.F. Drinking Water Quality, Problems and Solutions, First ed.; John Wiley & Sons Ltd: Sussex, UK, 1994.
18. Environment Agency. The Microbiology of Drinking Water (2002)—Part 4—Methods for the Isolation and Enumeration of Coliform Bacteria and Escherichia coli (including E. coli O157:H7); Environment Agency: Bristol, UK, 2002.
19. Havelaar, A.H.; Melse, J.M. Quantifying Public Health Risk in the WHO Guidelines for
Drinking-Water Quality; RIVM Report No. 7034301022/2003; National Institute for Public
Health and the Environment: Bilthoven, The Netherlands, 2003.
20. Gerba, C.P.; Rose, J.B.; Haas, C.N.; Crabtree, K.D. Waterborne rotavirus: a risk assessment.
Water Res.1996, 30, 2929–2940.
21. World Health Organisation. The World Health Report 2004: Changing History; World Health Organization: Geneva, Switzerland, 2004.
22. Holcomb, D.L.; Smith, M.A.; Ware, G.O.; Hung, Y.C.; Brackett, R.E.; Doyle, M.P. Comparison of six dose-response models for use with food-borne pathogens. Risk Anal. 1999, 19, 1091–1100. 23. Messner, M.J.; Chappell, C.L.; Okhuysen, P.C. Risk assessment for Cryptosporidium: a
hierarchical Bayesian analysis of human dose response data. WaterRes.2001, 35, 3934–3940. 24. Subcommittee on Arsenic in Drinking Water, National Research Council. Arsenic in Drinking
Water; The National Academies Press: Washington, DC, USA, 1999.
25. Berg, M.; Stengel, C. Duebendorf, Switzerland. ARS 29–32, Arsenic Reference Samples Interlaboratory Quality Evaluation Eawag. 2009, Unpublished Work.
26. World Health Organisation. Guidelines for Drinking-Water Quality: Volume 1 Recommendations, 3rd ed.; World Health Organisation: Geneva, Switzerland, 2004; Volume 1.
27. Van Geen, A.; Ahmed, K.M.; Akita, Y.; Alam, M.J.; Culligan, P.J.; Emch, M.; Escamilla, V.; Feighery, J.; Ferguson, A.S.; Knaypett, P.; et al. Fecal Contamination of Shallow Tubewells in Bangladesh Inversely Related to Arsenic. Environ. Sci. Technol. 2011, 45, 1199–1205.
28. Clasen, T.; Bastable, A. Faecal contamination of drinking water during collection and household storage: The need to extend protection to the point of use. J. Water Health 2003, 1, 109–115. 29. Eshcol, J.; Mahapatra, P.; Keshapagu, S. Is fecal contamination of drinking water after collection
associated with household water handling and hygiene practices? A study of urban slum households in Hyderabad, India. J. Water Health 2009, 7, 145–154.
30. Smeets, P.; van Dijk, C.J.; Stanfield, G.; Rietveld, L.C.; Medema, G.J. How can the UK statutory Cryptosporidium monitoring be used for Quantitative Risk Assessment of Cryptosporidium in drinking water? J. Water Health 2007, 5, 107–118.
![Figure 2. Schematic of the model for arsenic attributable health risks [16].](https://thumb-us.123doks.com/thumbv2/123dok_us/8711697.882077/8.595.120.475.167.419/figure-schematic-model-arsenic-attributable-health-risks.webp)
![Figure 4. Cross-plot of arsenic and thermally tolerant coliforms in water supplied to Tube Wells (of Tap Water Supply (correlation for the simple least squares linear regression between [As] and [TTC]households in the Chakdha, West Bengal, India study area](https://thumb-us.123doks.com/thumbv2/123dok_us/8711697.882077/11.595.159.439.211.415/thermally-tolerant-coliforms-supplied-correlation-regression-households-chakdha.webp)
![Table 4. [TTC]end-use classified by independent or predictor variables.](https://thumb-us.123doks.com/thumbv2/123dok_us/8711697.882077/12.595.79.514.99.372/table-ttc-end-use-classified-independent-predictor-variables.webp)
![Table 5. Regression model a of [TTC]end-use.](https://thumb-us.123doks.com/thumbv2/123dok_us/8711697.882077/13.595.64.530.194.440/table-regression-model-a-of-ttc-end-use.webp)
![Figure 5. Seasonal variation in [TTC]treatment plants (TW), deep tube wells (DTW) and tap waters (TP) in Chakdha Block, West Bengal, India](https://thumb-us.123doks.com/thumbv2/123dok_us/8711697.882077/17.595.172.428.374.550/figure-seasonal-variation-treatment-waters-chakdha-block-bengal.webp)
