Full Length Research Paper
Life cycle impact assessment (LCIA) using EDIP 97
method: An analysis of potential impact from potable
water production
Amir Hamzah Sharaai
1*, Noor Zalina Mahmood
2and Abdul Halim Sulaiman
21
Institute of Teacher Education, Tuanku Bainun Campus, 14000 Bukit Mertajam, Penang, Malaysia. 2
Institute of Biological Sciences, Faculty of Science, University of Malaya, 50603 Kuala Lumpur, Malaysia.
Accepted 18 October, 2011
Life cycle assessment (LCA) is a method to analyze a particular product or service; from the beginning of the process it is extracted until it is no more in use or much to be known as ‘cradle to grave analysis’. The LCA analysis includes collection of inventory that is all types of emissions and also waste products. After that, this inventory would be translated or transformed to show the impact on environment in the life cycle impact assessment (LCIA). Two LCIA methods has been accepted such as midpoint and endpoint approach. The EDIP 97 is a LCIA method which uses midpoint approach. From the analysis done on the two stages, life cycle assessment for potable water production that is construction stage and production stage; it is found that production stage contributes the highest impact on acidification and euthrophication which is derived from the PAC production process. Whereas, the construction stage contributes two main impacts which are human toxicity (water) and chronic water ecotoxicity which are produced through the process of steel production.
Key words: EDIP 97 method, life cycle impact assessment, potable water production, midpoint approach.
INTRODUCTION
Impact assessment is used to identify significant potential environmental effect by using the results of life cycle impact analysis (LCIA). LCIA is very different from other techniques such as environment impact assessment (EIA) and risk assessment because the approach uses functional unit. LCIA comprises four elements namely: the classification, characterization, normalization and weighting where normalization and weighting are the optional elements (Koroneos et al., 2005). According to Jolliet et al. 2003), the classification of LCI due to the impact categories is through the impact pathway which begins from LCI results until the end-point. The explanation on impact pathway is also touched in ISO where: ‘LCI results are classified into the impact categories and category indicators that can be stated in any LCI results (mid) with the end-point category’. In accordance with the aforementioned explanation, two approaches were developed to explain the inter-
*Corresponding author. E-mail: [email protected].
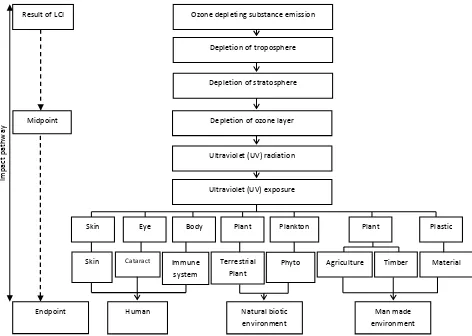
connection of the LCI results with the environmental impacts via mid-points or end-points approaches (Heijungs et al., 2003; Jolliet et al., 2003, 2004; Soares et al., 2006; Sleeswijk et al., 2008; Ortiz et al., 2009). According to Bare et al. (2000), the main difference between both models is the methodology how category indicators are presented to translate the achieved impact categories. Figure 1 explains the impact pathway beginning from LCI results until the end-point.
The emission of ozone depletion gasses is used as an example for the characterization of ozone depletion gasses that can be conducted either until mid-point or end-point. Impact in mid-point is the ozone layer depletion and impact in the end-point is the protected area involving human health, natural biotic environment and manmade environment.
Midpoint approach
Im
p
a
ct
p
a
th
w
a
y
Skin Eye Body Plant Plankton Plant Plastic
Skin Cataract Immune system
Terrestrial Plant
Phyto Agriculture Timber Material
Human Health
Natural biotic environment
Man made environment Ozone depleting substance emission
Depletion of troposphere
Depletion of stratosphere
Depletion of ozone layer
Ultraviolet (UV) radiation
Ultraviolet (UV) exposure Result of LCI
Midpoint
[image:2.612.73.545.71.407.2]Endpoint Damage to
Figure 1. Impact pathway connecting the emission to several deterioration categories.
or classical impact assessment method (Jolliet et al., 2003, 2004). The term mid-point refers to the category indicator for each impact category which is expressed in the mid pathway of impact between LCI results and end-point (Josa et al., 2007). Mid-end-point translates the category impact into real phenomenon for example climate change, acidification and aquatic toxicity (Sleeswijk et al., 2008). Examples of methodology that were developed using the midpoint approach are CML 2001 (Dreyer et al., 2003; Heijung et al., 2003), EDIP 97 and TRACI (Jolliet et al., 2004).
Endpoint approach
The end-point LCIA methodology is also known as damage-oriented approach (Dreyer et al., 2003). End-point approach according to Heijungs et al. (2003) is the elements inside the impact pathway that consists of independent value for society. The term ‘end-point’ refers to the category indicator for each impact category located at the end of impact pathway as in Figure 1. End-point indicator translates the category impact based on the area of protection such as human health, natural
environmental quality, natural resources and human made environment (Bare and Gloria, 2008). Examples of end-point methodology are Eco-indicator 95 and 99, EPS 92, 96 and 2000 and LIME 2003 (Pennington et al., 2004). According to Reap et al. (2008), there are several factors affecting the level of confidence and suitability of LCA research results which include option of LCIA methodology either using the mid-point or end-point approach. Reap et al. (2008) mentioned that end-point impact category is less comprehensive and posseses higher level of uncertainty compared to mid-point impact category. Nevertheless mid-point impact category is difficult to be interpreted especially in the process of decision making because the mid-point impact category is not directly correlated with the area of protection (that is damage to human health, ecosystem quality and resource depletion) which is practised by the end-point.
METHODOLOGY OF LCA
There are four main phases in LCA as suggested in ISO 14040 series:
ii) Life cycle inventory (LCI) (ISO 14041).
iii) Life cycle impact assessment (LCIA) (ISO 14042).
iv) Life cycle assessment and interpretation (LCAI) (ISO 14043).
Goal and scope definition
In goal definition and scoping, the use of the results was identified, the scope of the study is stated, the functional unit is defined, and a strategy and procedures for data collection and data quality assurance were established.
Objectives
The aim of this research is to obtain a clear picture of the potential impact developed from the potable production, whereby two stages are involved that is production stage and construction stage using LCIA method which is the EDIP 97 method. This research also identifies the impact which is greatly exposed by using normalization and weighting procedures so that the suggestion for mitigation can be made.
Functional unit
Functional unit is quantified performance a product system uses as a reference unit in a life cycle assessment study (ISO14000 2000). A constant value must be created to make the comparison (Miettinen and Hamalainen, 1997). Functional unit for this study is the production of 1 m3 of treated water a day that fits the standard quality set by Ministry of Health, Malaysia.
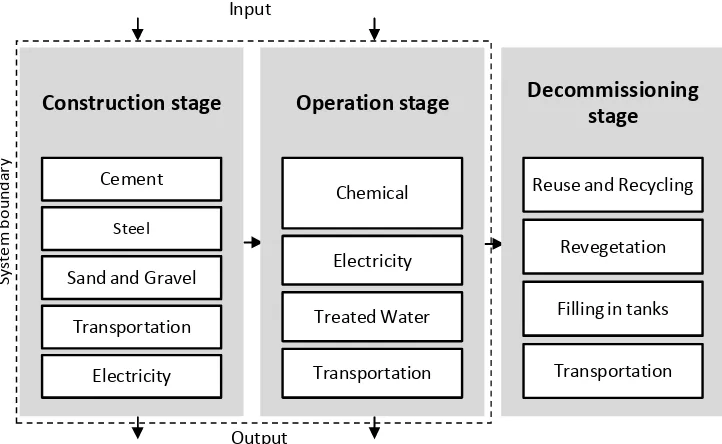
Description of the system under study
There are two stages which became the basis of comparison for this study namely: production and construction stage.
Production stage: Raw water extracted from rivers will go through the following process in the water treatment plant (Sastry, 1996):
i) Screening, to remove floating big sized rubbish on the surface of the water.
ii) Coagulation and flocculation, coagulation process is a process of forming particles called floc. Coagulant needs to be added to form floc. The coagulants that are normally used include aluminium sulphate, ferric sulphate and ferric chloride. Tiny flocs will in turn attract each other while at the same time pulling the dissolved organic material and particulate to combine, forming a big flocculant particle. This process is called flocculation. iii) Settling, aggregated flocs settle on the base of the settler. The accumulation of floc settlement is called settling sludge.
iv) Filtration, part of the suspended matter that did not settle goes through filtration. Water passing through filtration consisting of sand layers and activated carbon or anthracite coal.
v) Disinfection process is needed to eliminate the
pathogen organisms that remain after filtration. Among the chemicals used for the disinfection are chlorine, chloramines, chlorine dioxide, ozone and UV radiation.
Construction stage: The main building materials used for water treatment plant building are concrete and steel. Concrete is a type of composite material which is usually used in construction. It is a combination of the following:
a) Cement.
b) Fine aggregate/sand. c) Coarse aggregate. d) Water.
The quality of the concrete which is produced depends on the quality of the raw materials that are being used such as cement, coarse aggregate and water, rate of mixing, the method of mixing, transportation and compression methods. If the raw materials used were not of quality, the concrete produced will have low quality and caused the concrete to be weak and does not fulfill the fixed specifications. So, concrete technology warrants all the materials that will be used should be tested first and certified through fixed standardizations, before being used in construction works, steel increases the tensile strength of the concrete structure. Reinforcement steel functions to increase the tensility strength of the concrete structure. Types of reinforcement steel that are used are as follows:
i) Mild steel reinforcement/mild steel. ii) Reinforcement steel with high tensility. iii) Fabric steel (fabric).
The steel provided are 12 m long, with diameter of 6, 8, 10, 12, 16, 20, 22, 25 and 32 mm. The reinforcement steel will be cut and moulded according to the concrete structure design. Reinforcement steel with high tensility is used as the backbone concrete structure because it has high strength. Mild steel reinforcement is usually in fixation for reinforcement steel with high tensility where high tensility is not needed; high tension where high force not needed. Fabric steel (fabric) is used in a wide concrete surface area such as floor; it comes in sizes of 2.4 × 1.8 m with steel diameter 4 to 12 mm and distance between each steel rods are different based on types of fabric. Reinforcement steed that is used should be free from any dirt and rust, so it has to be protected from water and humidity.
Life cycle inventory (LCI)
S
y
st
e
m
b
o
u
n
d
a
ry
Input
Output
Construction stage
Cement
Steel
Sand and Gravel
Transportation
Electricity
Operation stage
Chemical
Electricity
Treated Water
Transportation
Decommissioning
stage
Reuse and Recycling
Revegetation
Filling in tanks
[image:4.612.131.492.76.298.2]Transportation
Figure 2. System boundary of potable water treatment plant.
Table 1. Foreground data for construction stage and production stage.
Construction stage Production stage
Steel (kg) 8.78 Alum (kg) 22.55
Cement (kg) 30.72 Chlorine (kg) 3.65
Gravel (kg) 70.72 PAC (kg) 16.85
Sand (kg) 47.15 Lime (kg) 11.12
Electricity (kwh) 0.09 Electricity (kwh) 397.28
Tap water (liter) 477.26
of material and energy requirements, products and co-products as well as wastes. This list is referred to as the material and energy balance, the inventory table, or the eco-balance of the product (Guinée, 2002). This LCA study is a streamlined LCA where background data for electricity, chemicals and transport using database contained in the Jemaipro and Simapro 7 software. Foreground data collected from the treatment plant are (Table 1):
i) Electricity usage.
ii) Chemicals for water treatment such as aluminium sulphate (alum), polyaluminium chloride (PAC), chlorine and calcium hydroxide (lime).
iii) Building materials such as steel, gravel, sand and cement.
Filtration material (activated carbon and anthracite) and coagulant (ferrochloride) are not included in this study because all the water treatment plants in Malaysia are not using all these materials. Background data for all
building materials and chemicals were obtained from Japan Environmental Management Association for Industry (JEMAI) - PAC, BUWAL 250 - chlorine, alum, and Electricity, ETH-ESU 98 - lime, LCA Food DK - tap water, and IDEMAT 2001 - cement, steel, sand and gravel.
Life cycle impact assessment (LCIA)
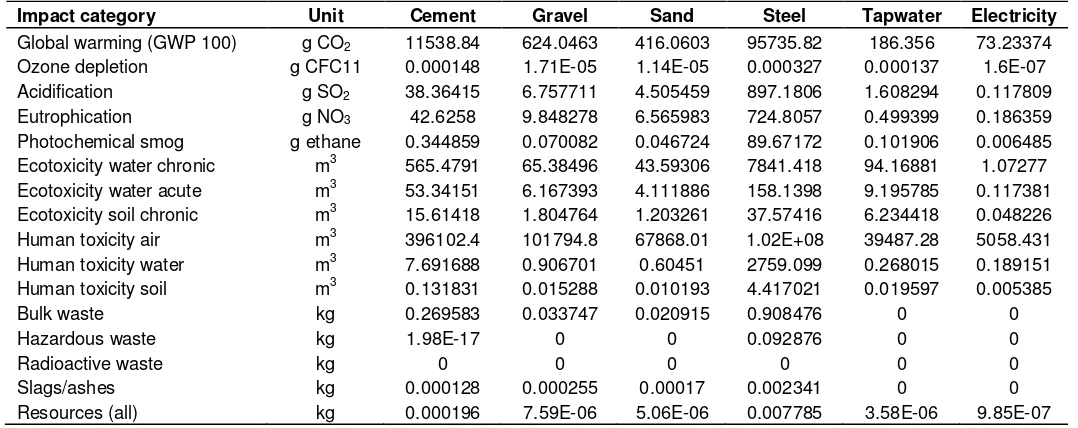
[image:4.612.119.502.375.464.2]Table 2. Contribution from construction materials and electricity to potential impacts.
Impact category Unit Cement Gravel Sand Steel Tapwater Electricity
Global warming (GWP 100) g CO2 11538.84 624.0463 416.0603 95735.82 186.356 73.23374 Ozone depletion g CFC11 0.000148 1.71E-05 1.14E-05 0.000327 0.000137 1.6E-07 Acidification g SO2 38.36415 6.757711 4.505459 897.1806 1.608294 0.117809 Eutrophication g NO3 42.6258 9.848278 6.565983 724.8057 0.499399 0.186359 Photochemical smog g ethane 0.344859 0.070082 0.046724 89.67172 0.101906 0.006485 Ecotoxicity water chronic m3 565.4791 65.38496 43.59306 7841.418 94.16881 1.07277 Ecotoxicity water acute m3 53.34151 6.167393 4.111886 158.1398 9.195785 0.117381 Ecotoxicity soil chronic m3 15.61418 1.804764 1.203261 37.57416 6.234418 0.048226 Human toxicity air m3 396102.4 101794.8 67868.01 1.02E+08 39487.28 5058.431 Human toxicity water m3 7.691688 0.906701 0.60451 2759.099 0.268015 0.189151 Human toxicity soil m3 0.131831 0.015288 0.010193 4.417021 0.019597 0.005385
Bulk waste kg 0.269583 0.033747 0.020915 0.908476 0 0
Hazardous waste kg 1.98E-17 0 0 0.092876 0 0
Radioactive waste kg 0 0 0 0 0 0
Slags/ashes kg 0.000128 0.000255 0.00017 0.002341 0 0
Resources (all) kg 0.000196 7.59E-06 5.06E-06 0.007785 3.58E-06 9.85E-07
required a few substances data for characterization calculation. A comparison study for EDIP 97, CML 2001 and E99 has been done by Dreyer et al. (2003). For general information, EDIP 2003 is an update version to the EDIP 97 approach which attempts to expand the impact area until it become closer to the damage-oriented approach (Potting et al., 2006). Effort was carried out to investigate the possibility to be included in the exposure to life cycle assessment of non-global impact categories such as acidification, ecotoxicity, smog, nutrient enrichment, human toxicity and noise. Generally, there are 3 steps in LCIA:
i) Classification and characterization, ii) Normalization, and
iii) Weighting.
Classification and characterization
Classification is an inventory collection process from life cycle to several impact categories (Moberg et al., 2005), while characterization according to Bovea and Gallardo (2006) is a type of summation of ‘life cycle inventory’ for every element under same impact category. The summation of every element using characterization factor and summation value then recognized as category indicator (Ntiamoah and Afrane, 2008). In ISO 14040 (2000 and 2005), category indicator of ‘life cycle impact category indicator’ can be defined as a value that indicates each impact category. Curran (2006) suggested that the equation for category indicator is the relationship between the impact categories and characterization factor is as below:
Inventory data × characterization factor = category indicator.
Characterization for construction stage: In the EDIP 97, 16 types of impacts were identified as the main ones. Based on Table 2, it is found that all the 16 impacts are dominated by the process of steel production that is the contribution is more than 50%. In the process of steel production, the impacts that contribute more than 70% are the bulk waste (74%), slag/ashes (81%), global warming (88%), ecotoxicity water chronic (91%), euthrophication (92%), acidification (95%), human toxicity soil (96%), resources (97%), photochemical (99.4%) and human toxicity water (99.7%). Although a lot of impacts have been produced from the process of steel production, there still exist large quantities of impacts which are more than 10% in the process of cement production and tap water. For example, in the process of producing cement, the impact more than 10% is global warming (10.6%), ozone (23.1%), ecotoxicity water acute (23.1%), ecotoxicity soil chronic (25%) and bulk waste (22%). However, in the process of producing tap water, the impact is 21% at ozone impact category and 10% for the ecotoxicity soil chronic. The process of producing gravel, sand and electricity contributes less than 5% impacts. In the process of producing building materials and electricity, no radioactive waste impact is produced.
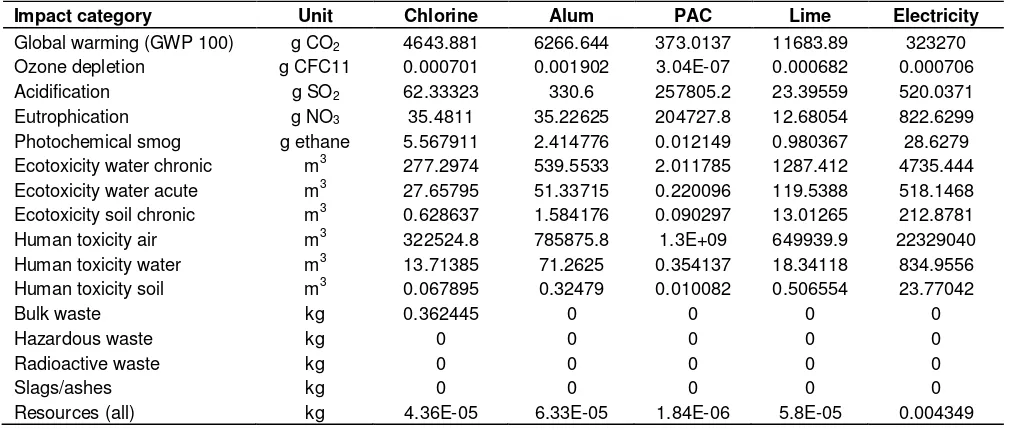
Table 3. Contribution from chemicals and electricity to a few impact categories.
Impact category Unit Chlorine Alum PAC Lime Electricity
Global warming (GWP 100) g CO2 4643.881 6266.644 373.0137 11683.89 323270 Ozone depletion g CFC11 0.000701 0.001902 3.04E-07 0.000682 0.000706
Acidification g SO2 62.33323 330.6 257805.2 23.39559 520.0371
Eutrophication g NO3 35.4811 35.22625 204727.8 12.68054 822.6299
Photochemical smog g ethane 5.567911 2.414776 0.012149 0.980367 28.6279 Ecotoxicity water chronic m3 277.2974 539.5533 2.011785 1287.412 4735.444 Ecotoxicity water acute m3 27.65795 51.33715 0.220096 119.5388 518.1468 Ecotoxicity soil chronic m3 0.628637 1.584176 0.090297 13.01265 212.8781
Human toxicity air m3 322524.8 785875.8 1.3E+09 649939.9 22329040
Human toxicity water m3 13.71385 71.2625 0.354137 18.34118 834.9556 Human toxicity soil m3 0.067895 0.32479 0.010082 0.506554 23.77042
Bulk waste kg 0.362445 0 0 0 0
Hazardous waste kg 0 0 0 0 0
Radioactive waste kg 0 0 0 0 0
Slags/ashes kg 0 0 0 0 0
Resources (all) kg 4.36E-05 6.33E-05 1.84E-06 5.8E-05 0.004349
(69.2%), ecotoxicity (water) acute (72.3%), ecotoxicity (soil) (98.3%), human toxicity (water) (89%), human toxicity (soil) (96%) and resources (96%). PAC production contributes to almost 100% in three impacts that are acidification (99.7%), euthrophication (99.6%) and human toxicity (air) (98.2%). However, the process of producing chlorine contributes to 100% bulk waste. Apart from that, the process of producing ‘alum’ is more than 47% at the ozone impact. The process of producing other chemicals such as lime and chlorine is found to contribute very less impact as listed. Anyway, it is found that three impacts were not found in all chemicals and electricity, that is hazardous waste, radioactive waste and slags/ashes.
Normalization
According to Mangena and Brent (2006), normalization enables the impact categories to be distinguished. There are two reasons why normalization is conducted, first is to identify the impact categories that should give mere attention and second, to obtain the magnitude of environmental degradation produced during the life cycle of the product (Goedkoop et al., 2007). Normalization is determined based on the formula shown as follows (Pennington et al., 2004):
Nk = Sk/Rk
Where:
k = Impact category. N = Normalisation indicator.
S = Category indicator (from characterization). R = Reference value.
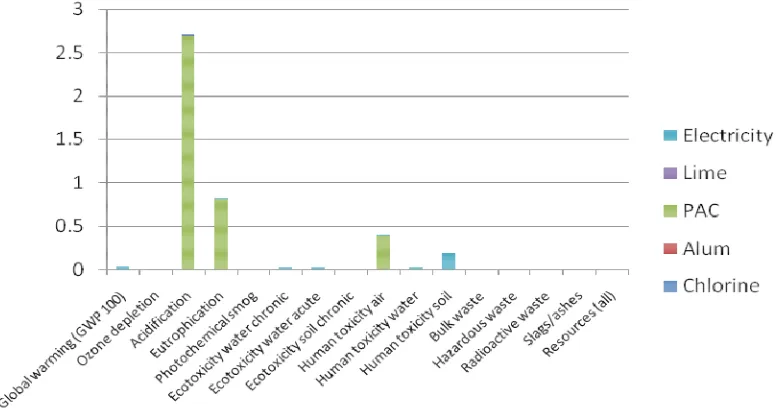
Normalization for construction stage: From the analysis, four impacts are clearly exhibited that is above 0.01 level (Figure 3). The impacts mentioned are global warming, ecotoxicity water chronic, human toxicity (air), human toxicity (water) and human toxicity (soil). If arranged based on ranking, the impact of human toxicity (water) is the first (0.047), ecotoxicity water chronic (0.018) at second place and human toxicity (soil) (0.015) is ranked at third place. In general, steel production contributes highest score to most of the impacts after normalization.
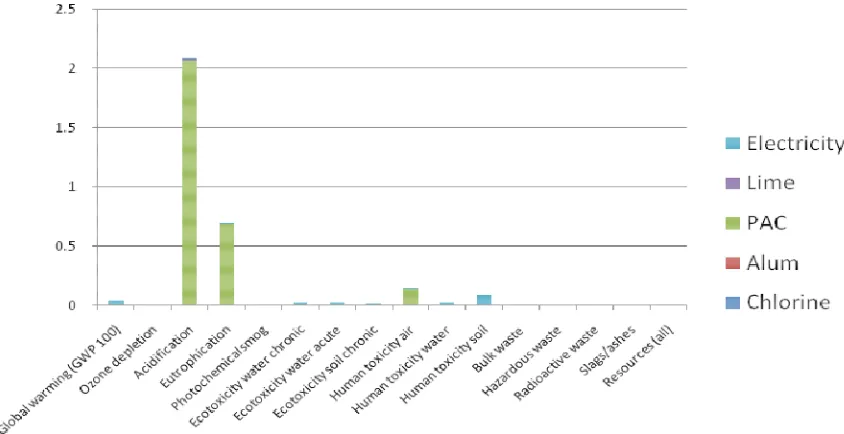
Normalization for production stage: For the production stage, only three impacts seems to be higher in comparison to others that is the acidification (first ranking at 2.085 value), euthrophication (second ranking at 0.691 value) and human toxicity (air) (third ranking at 0.145 value) (Figure 4). All the three impacts, almost 100% contributed from the process of PAC production. However, at the fourth ranking (human toxicity soil) and fifth ranking (global warming), the contribution was almost 100% through the process of electricity generation.
Weighting
Figure 3. Normalization of impact categories from the contribution of building materials and electricity.
Figure 4. Normalization of impact categories from the contribution of chemicals and electricity.
to obtain single score in order to compare with the other damage category. Weighting is determined based on formula as in Pennington et al. (2004):
EI = ∑Vk Nk OR EI = ∑Vk Sk
Where:
k = Impact category.
EI = Indicator to all environmental impact. V = Weighting factor.
N = Normalisation indicator.
S = Category indicator (from characterization).
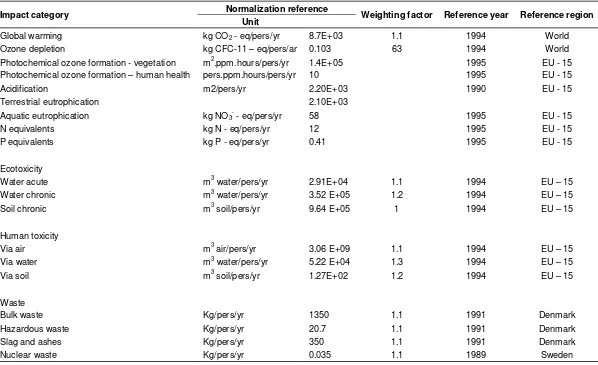
Weighting factors for EDIP 07 can be referred in Table 4.
[image:7.612.98.520.357.574.2]Table 4. EDIP 07 normalization and weighting factors.
Impact category Normalization reference Weighting factor Reference year Reference region
Unit
Global warming kg CO2 - eq/pers/yr 8.7E+03 1.1 1994 World
Ozone depletion kg CFC-11 – eq/pers/ar 0.103 63 1994 World Photochemical ozone formation - vegetation m2.ppm.hours/pers/yr 1.4E+05 1995 EU - 15 Photochemical ozone formation – human health pers.ppm.hours/pers/yr 10 1995 EU - 15 Acidification m2/pers/yr 2.20E+03 1990 EU - 15 Terrestrial eutrophication 2.10E+03
Aquatic eutrophication kg NO3- - eq/pers/yr 58 1995 EU - 15
N equivalents kg N - eq/pers/yr 12 1995 EU - 15 P equivalents kg P - eq/pers/yr 0.41 1995 EU - 15
Ecotoxicity
Water acute m3 water/pers/yr 2.91E+04 1.1 1994 EU – 15 Water chronic m3 water/pers/yr 3.52 E+05 1.2 1994 EU – 15 Soil chronic m3 soil/pers/yr 9.64 E+05 1 1994 EU – 15
Human toxicity
Via air m3 air/pers/yr 3.06 E+09 1.1 1994 EU – 15 Via water m3 water/pers/yr 5.22 E+04 1.3 1994 EU – 15 Via soil m3 soil/pers/yr 1.27E+02 1.2 1994 EU – 15
Waste
Bulk waste Kg/pers/yr 1350 1.1 1991 Denmark
Hazardous waste Kg/pers/yr 20.7 1.1 1991 Denmark Slag and ashes Kg/pers/yr 350 1.1 1991 Denmark Nuclear waste Kg/pers/yr 0.035 1.1 1989 Sweden
the graph shown are not different with the normalization on construction and production stage. It is essential to note that the value on production stage is greater in comparison to construction stage. This shows that the impact produced by production stage is greater in
comparison to construction stage. However, with the use of normalization and weighting, both stages (production and construction) could highlight the higher impact. For example, in the construction stage, the impact that could be highlighted is global warming, ecotoxicity water
Figure 5. Weighting of impact categories from the contribution of building materials and electricity.
Figure 6. Weighting of impact categories from the contribution of chemicals and electricity.
the impacts are contributed from the process of producing PAC.
Life cycle assessment and interpretation (LCAI)
Three main impacts that exist in the construction stage that are human toxicity (water), ecotoxicity water chronic and human toxicity (soil). Table 5 shows the contribution of inventory to human toxicity (water) from building materials and electricity. From the list of inventory, it
[image:9.612.117.505.341.545.2]Table 5. List of inventory which contributes to human toxicity (water) from building materials and electricity (cut-off 0.05%).
Substance Unit Cement Gravel Sand Steel Tapwater Electricity
Cadmium % 0.099636 0.097694 0.097694 0.446133 7.135012 0.006102
Dioxins, measured as 2,3,7,8-tetrachlorodibenzo-p-dioxin % 0.143539 0.140743 0.140743 70.00924 0.28294 x
Lead % 0.188701 0.185024 0.185024 1.519073 1.39557 0.009104
Mercury % 59.15076 57.99827 57.99827 24.86808 69.94494 76.41505
Metals, unspecified % 0.111558 1.886905 1.886905 0.415264 x 9.832133
Zinc % 0.026239 0.025728 0.025728 0.057251 0.157572 0.001135
Cadmium, ion % 2.122509 2.081155 2.081155 0.075474 3.592228 0.598188
Lead % 18.75955 18.39404 18.39404 0.281284 5.866341 5.542232
Mercury % 3.578055 3.50834 3.50834 2.122339 5.777354 4.092916
Selenium % 9.734771 9.545099 9.545099 0.060097 2.361785 x
Zinc, ion % 2.958395 2.900754 2.900754 0.091772 1.059735 0.893285
Remaining substances % 3.126287 3.236249 3.236249 0.053987 2.426521 2.609859
Total of all compartments % 100 100 100 100 100 100
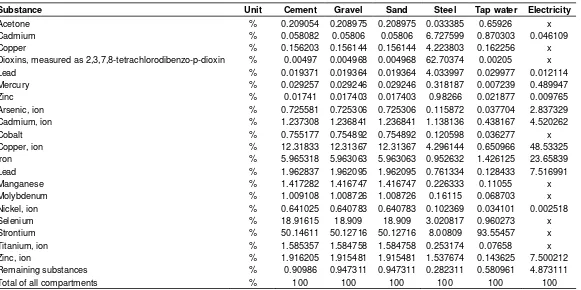
Table 6. List of inventory which contributes to ecotoxicity water chronic from building materials and electricity (cut-off 0.05%).
Substance Unit Cement Gravel Sand Steel Tap water Electricity
Acetone % 0.209054 0.208975 0.208975 0.033385 0.65926 x
Cadmium % 0.058082 0.05806 0.05806 6.727599 0.870303 0.046109
Copper % 0.156203 0.156144 0.156144 4.223803 0.162256 x
Dioxins, measured as 2,3,7,8-tetrachlorodibenzo-p-dioxin % 0.00497 0.004968 0.004968 62.70374 0.00205 x
Lead % 0.019371 0.019364 0.019364 4.033997 0.029977 0.012114
Mercury % 0.029257 0.029246 0.029246 0.318187 0.007239 0.489947
Zinc % 0.01741 0.017403 0.017403 0.98266 0.021877 0.009765
Arsenic, ion % 0.725581 0.725306 0.725306 0.115872 0.037704 2.837329
Cadmium, ion % 1.237308 1.236841 1.236841 1.138136 0.438167 4.520262
Cobalt % 0.755177 0.754892 0.754892 0.120598 0.036277 x
Copper, ion % 12.31833 12.31367 12.31367 4.296144 0.650966 48.53325
Iron % 5.965318 5.963063 5.963063 0.952632 1.426125 23.65839
Lead % 1.962837 1.962095 1.962095 0.761334 0.128433 7.516991
Manganese % 1.417282 1.416747 1.416747 0.226333 0.11055 x
Molybdenum % 1.009108 1.008726 1.008726 0.16115 0.068703 x
Nickel, ion % 0.641025 0.640783 0.640783 0.102369 0.034101 0.002518
Selenium % 18.91615 18.909 18.909 3.020817 0.960273 x
Strontium % 50.14611 50.12716 50.12716 8.00809 93.55457 x
Titanium, ion % 1.585357 1.584758 1.584758 0.253174 0.07658 x
Zinc, ion % 1.916205 1.915481 1.915481 1.537674 0.143625 7.500212
Remaining substances % 0.90986 0.947311 0.947311 0.282311 0.580961 4.873111
Total of all compartments % 100 100 100 100 100 100
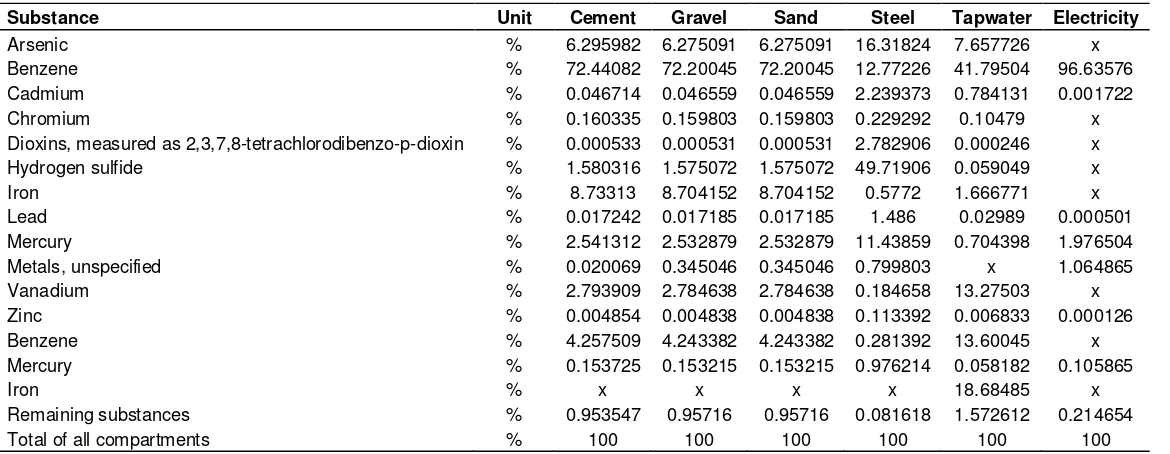
strontium (cement – 50%, gravel – 50%, sand – 50% and tap water – 94%). The electricity generation process does not contribute strontium at all. The process of producing electricity produces a lot of copper (ion) that is 49%. Finally, the contribution of human toxicity (soil) in the process of producing steel is hydrogen sulfide (50%) (Table 7). However, on the whole, the other building materials and electricity release the highest amount of
[image:10.612.26.607.321.611.2]Table 7. List of inventory which contributes to human toxicity (soil) from building materials and electricity (cut-off 0.05%).
Substance Unit Cement Gravel Sand Steel Tapwater Electricity
Arsenic % 6.295982 6.275091 6.275091 16.31824 7.657726 x
Benzene % 72.44082 72.20045 72.20045 12.77226 41.79504 96.63576
Cadmium % 0.046714 0.046559 0.046559 2.239373 0.784131 0.001722
Chromium % 0.160335 0.159803 0.159803 0.229292 0.10479 x
Dioxins, measured as 2,3,7,8-tetrachlorodibenzo-p-dioxin % 0.000533 0.000531 0.000531 2.782906 0.000246 x
Hydrogen sulfide % 1.580316 1.575072 1.575072 49.71906 0.059049 x
Iron % 8.73313 8.704152 8.704152 0.5772 1.666771 x
Lead % 0.017242 0.017185 0.017185 1.486 0.02989 0.000501
Mercury % 2.541312 2.532879 2.532879 11.43859 0.704398 1.976504
Metals, unspecified % 0.020069 0.345046 0.345046 0.799803 x 1.064865
Vanadium % 2.793909 2.784638 2.784638 0.184658 13.27503 x
Zinc % 0.004854 0.004838 0.004838 0.113392 0.006833 0.000126
Benzene % 4.257509 4.243382 4.243382 0.281392 13.60045 x
Mercury % 0.153725 0.153215 0.153215 0.976214 0.058182 0.105865
Iron % x x x x 18.68485 x
Remaining substances % 0.953547 0.95716 0.95716 0.081618 1.572612 0.214654
[image:11.612.60.563.380.445.2]Total of all compartments % 100 100 100 100 100 100
Table 8. List of inventory which contributes to acidification from chemicals and electricity (cut-off 0.05%).
Substance Unit Alum Lime PAC Chlorine Electricity
Nitrogen oxides % 5.251169 24.4414 41.1765 28.69256 79.67951
Sulfur oxides % 94.4788 70.36888 58.8235 70.2675 20.24456
Remaining substances % 0.270029 5.189723 6.5E-08 1.039936 0.07593
Total of all compartments % 100 100 100 100 100
Table 9. List of inventory which contributes to eutrophication from chemicals and electricity (cut-off 0.05%).
Substance Unit Alum Lime PAC Chlorine Electricity
Nitrogen oxides % 95.04475 86.96767 100 97.21374 97.14316
Remaining substances % 4.955253 13.03233 4.87E-06 2.786263 2.856839
Total of all compartments % 100 100 100 100 100
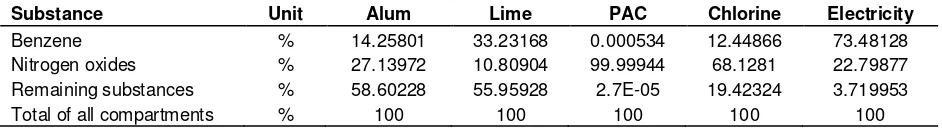
contribute to impact are nitrogen oxides, sulphur oxides and benzene. The process of producing PAC found to contribute the highest in the three impacts are acidification euthrophication and human toxicity (air).
Sulfide oxides (59%) and nitrogen oxides (41%) are the main materials which contribute to acidification in the process of producing PAC (Table 9). Sulfur oxides are the main material which contributes to Alum – 94.5%, lime – 70% and chlorine – 70%. However the process of electricity generation contributes to the highest nitrogen oxides (80%). For the euthrophication, PAC contributes 100% nitrogen oxides. It is the same as chemicals and
electricity. The contribution of nitrogen oxides is very high that is above 87% compared to the other substances. The same goes to euthrophication, PAC contributes almost 100% nitrogen oxides compared to other materials (Table 10).
CONCLUSION AND RECOMMENDATION
[image:11.612.69.554.504.557.2]Table 10. List of inventory which contributes to human toxicity (air) from chemicals and electricity (cut-off 0.05%).
Substance Unit Alum Lime PAC Chlorine Electricity
Benzene % 14.25801 33.23168 0.000534 12.44866 73.48128
Nitrogen oxides % 27.13972 10.80904 99.99944 68.1281 22.79877
Remaining substances % 58.60228 55.95928 2.7E-05 19.42324 3.719953
Total of all compartments % 100 100 100 100 100
greater than construction stage. At the production stage, the weakness detected is the use of PAC as coagulant agent. In the process of producing PAC, it produces nitrogen oxides and sulphur oxides which contribute to three types of impacts that are acidification, euthrophication and human toxicity (air). Alum is an alternative to this problem. Alum is a substance than can be used to replace PAC. Earlier research shows alum is much better because the impact produced is minimum (Amir et al., 2008, 2009). The three impacts can be solved if PAC is used to replace alum. Although the impact from the construction stage is less in comparison to production stage, there are still a few problems in the production of building materials. The process of producing steel gives a greater impact. The process of producing steels contributes to the impact to human toxicity (water), ecotoxicity water chronic and human toxicity (soil). Now, the latest idea is to replace the reinforcement steel with fibre reinforced plastics (FRPs). These materials, which consist of glass, carbon or aramid fibres set in a suitable resin to form a rod or grid, are well accepted in the aerospace and automotive industries and should provide high durable concrete reinforcement (Clarke, 1998). However, before this alternative becomes (more environmental-friendly) or at par with the quality of steel, it should undergo LCA analysis.
REFERENCES
Amir Hamzah S, Noor Zalina M, Abdul Halim S (2008). Life Cycle Impact Assessment (LCIA) of Potable Water Production in Malaysia: A Comparison between Different River Class. The Eight Conference on Ecobalance 08, Tokyo Big Sight, Japan, The Institute of Life Cycle Assessment, Japan.
Amir Hamzah S, Noor Zalina M, Abdul Halim S (2009). "Life Cycle Assessment (LCA) in Potable Water Production: An analysis of greenhouse gases emission from chemicals and electricity usage in water treatment in Malaysia." Asian J. Water, Environ. Pollut., 6(3): 27-34.
Bare JC, Gloria TP (2008). "Environmental impact assessment taxonomy providing comprehensive coverage of midpoints, endpoints, damages, and areas of protection." J. Cleaner Prod., 16: 1021-1035.
Bare JC, Hofstetter P, Pennington DW, Udo de Haes HA (2000). "Life Cycle Impact Assessment Workshop Summary. Midpoints versus Endpoints: The Sacrifices and Benefits." Int. J. Life Cycle Assess., 5(6): 319 - 326.
Bovea MD, Gallardo A (2006). "The influence of impact assessment methods on materials selection for eco-design." Mater. Design., 27: 209-215.
Clarke J (1998). "Concrete Reinforced with Fibre Reinforced Plastic."
Materials World 6(2): 78-80.
Dreyer LC, Niemann AL, Hauschild MZ (2003). "Comparison of three different
LCIA methods:EDIP97, CML2001 and Eco-indicator 99. Does it matter which one you choose?" Int. J. Life Cycle Assess., 8(4): 191-200. Goedkoop M, Schryver AN, Oele M (2007). Introduction to LCA with
Simapro 7. Amersfoort: PRé Consultants.
Guinée JB (2002). Handbook on Life Cycle Assessment: Operational Guide to the ISO Standards, Springer.
Hauschild MZ, Wenzel H (1998). Environmental assessment of products. - Scientific background. United Kingdom, Kluwer Academic Publishers, 2
Heijungs R, Goedkoop M, Struijs J, Effting S, Sevenster M, Huppes G (2003) Towards a life cycle impact assessment method which comprises category indicators at the midpoint and the endpoint level. Report of the first project phase Design of the new method. Volume, DOI:
ISO14000 (2000). Malaysian standards handbook on environmental management: MS ISO 14000 Series - 2nd Ed. Shah Alam, Malaysia, SIRIM.
ISO 14040:2000 (2005). Environmental management-Life cycle assessment-Principle and framework. Malaysian standards handbook on environmental management: MS ISO 14000 Series 2nd Ed, pgs ii-iii. Shah Alam, SIRIM Berhad.
Jolliet O, Brent A, Goedkoop M, Itsubo N, Mueller-Wenk R, Peña C (2003) Life Cycle Impact Assessment Programme of the Life Cycle Initiative. Final report of the LCIA Definition study. Volume, DOI: Jolliet O, Margni M, Charles R, Humbert S, Payet J, Rebitzer G (2003).
"IMPACT 2002+: A New Life Cycle Impact Assessment Methodology." Int. J. Life Cycle Assess., 8(6): 324-330.
Jolliet O, Müller-Wenk R, Bare J, Brent A, Goedkoop M, Heijungs R (2004). "The LCIA midpoint-damage framework of the UNEP/SETAC life cycle initiative." Int. J. Life Cycle Assess., 9(6): 394-404.
Josa A, Aguado A, Cardim A, Byars E (2007). "Comparative analysis of the life cycle impact assessment of available cement inventories in the EU." Cem. Concr., Res., 37: 781-788.
Koroneos C, Dompros A, Roumbas G, Moussiopoulos N (2005). "Advantages of the use of hydrogen fuel as compared to kerosene." Resour. Conserv. Recycling, 44: 99-113.
Mangena SJ, Brent AC (2006). "Application of a Life Cycle Impact Assessment framework to evaluate and compare environmental performances with economic values of supplied coal products." J. Clean. Prod., (14): 1071-1084.
Miettinen P, Hamalainen RP (1997). "How to benefit from decision analysis in environmental life cycle assessment (LCA)." Eur. J. Oper. Res., 102: 279-294.
Moberg Ǻ, Finnveden G, Johansson J, Lind P (2005). "Life cycle assessment of energy from solid waste-part 2: landfilling compared to other treatment methods." J. Clean. Prod., 13: 231-240.
Ntiamoah A, Afrane G (2008). "Environmental impacts of cocoa production and processing in Ghana: life cycle assessment approach." J. Clean. Prod., 16: 1735-1740.
Ortiz O, Francesc C, Sonnemann G (2009). "Sustainability in the construction industry: A review of recent developments based on LCA." Construct. Build. Mater., 23: 28-39.
Pennington DW, Potting J, Finnveden G, Lindeijer E, Jolliet O, Rydberg T (2004). "Life cycle assessment part 2: Current impact assessment practice." Environ. Int., 30: 721-739.
Differentiation in the Characterisation of Photochemical Ozone Formation: The EDIP2003 Methodology." The Int. J. Life Cycle Assess., 11: 72-80.
Sastry CA (1996). Water Treatment Plants. New Delhi, Narosa Publishing House.
Sleeswijk AW, van Oersc LFCM, Guinée JB, Struijsd J, Huijbregtsb MAJ (2008). "Normalisation in product life cycle assessment: An LCA of the global and European economic systems in the year 2000." Sci. Total Environ., 390: 227-240.
Soares SR, Toffoletto L, Deschenes L (2006). "Development of weighting factors in the context of LCIA." Journal of Cleaner Production 14 649-660.
Wenzel H, Hauschild M, Alting L (1997). Environmental Assessment of Products - Volume 1: Methodology, Tools and Case Studies in Product Development. London, Chapman & Hall Publishers.