International Journal of Emerging Technology and Advanced Engineering
Website: www.ijetae.com (ISSN 2250-2459,ISO 9001:2008 Certified Journal, Volume 6, Issue 3, March 2016)
54
A Study on the Effect of Depth of Cut, Feed Rate and Tool
Overhang on the Induced Vibration and Surface Roughness
during Hard Turning of 41Cr4 Alloy Steel using Response
Surface Methodology
Christopher O. Izelu
1, Samuel C. Eze
2, Danladi K. Garba
31
Department of Mechanical Engineering, Federal University of Petroleum Resources, Effurun, Nigeria
2,3Department of Mechanical Engineering, Nigerian Defence Academy, Kaduna, Nigeria
Abstract–This paper presents an aspect of a series of
experimental studies in which the effect of the factors, such as depth of cut, feed rate and tool overhang on the response variables, such as machining induced vibration and surface roughness, during hard turning of 41Cr4 alloy structural steel on a conventional lathe with standard cutting tool is of major interest. The response surface methodology, based on central composite design of experiment, was used, and the analysis performed in Design Expert 9 software environment. Quadratic regression models were obtained and evaluated for the response variables as functions of the selected factors. The optimal settings of these factors required to minimize the response variables were also determine. The influence of the factors on the response variables were established through analysis of variance. The optimum setting of 58.2409 mm, for the tool overhang; 0.170594 mm/rev, for the feed rate; and 1.2192 mm, for the depth of cut would minimize the machining induced
vibration of the cutting tool to a value of 0.09 mm/s2, and
the surface roughness of the specimen work-piece to a value of 5.591 µmm if other operating factors were kept constant at their intermediate levels within the experimental design space.
Keywords-- Central Composite Design of Experiment,
Depth of Cut, Design Expert, Feed Rate, Induced
Vibration, Response Surface Methodology Surface
Roughness, Tool Overhang
I. INTRODUCTION
Modern industrial production by metal cutting emphasizes strongly on economically achieving the best product quality and process performance. Clarification on this objective has been and is still being pursued through experimental evaluation, modeling and determination of the optimal settings of both the controllable and uncontrollable cutting conditions, including cutting tool, work-piece and environmental variables.
Metal cutting by turning is of great importance in industrial manufacture of machined components. It is one of the major material removal process mainly used in the industry to generate cylindrical surfaces. This has been achieved when a rotating cylindrical work-piece at given cutting speed encounters a translating cutting tool at given feed rate and depth of cut. It is believed that if the cutting conditions such as the cutting speed, feed rate and depth of cut, as well as the cutting tool and work-piece variables are skillfully set, the best product quality and desired process performance would be achieved.
International Journal of Emerging Technology and Advanced Engineering
Website: www.ijetae.com (ISSN 2250-2459,ISO 9001:2008 Certified Journal, Volume 6, Issue 3, March 2016)
55
The most recent are the works of Khan et al [25], Devkumar et al [26], Devi et al [27], Rajpoot et al [28], Khidhir et al [29], Agrawal et al [30], Ranganath et al [31], Chandra and Prasad [32], Sastry et al [33], Revankar et al [34], Mahajan et al [35], Shihab et al [36], and Gupta and Kohli [37]. For completeness, the works of Kassab and Khoshnaw [38], Han et al [39], Cahuc et al [40], Delijaicov et al [41], Rogov and siamak [42] [43] are equally relevant, but essential to the machining induced vibration of either the cutting tool or work-piece. RSM forms the basis of most of these works, but based on the different design of experiment (DOE), which include central composite (CC) [5] [7] [10] [26] [27] [28] [31] [32] [33] [36] [37], Box-Behnken (BB) [3] [13] [18] [19] [20] [21] [22] [30], Taguchi orthogonal array (AO) [11] [15] [23] [24] [34], factorial (F) [4] [6] [29], and full factorial (FF) [14] design of experiment (DOE). The analysis were executed in software environments, such as the Design Expert [5] [9] [15] [18] [19] [20] [21] [26] [28] [33] [36], Minitab [3] [11] [22] [23] [24] [31], LINGO Solver [12], MATLAB [17] and doe++ [32]. The works also differ due to the work-piece materials considered; the cutting tools, lathe machines, and parameter measurement instruments used; process variables and constants, and performance variables investigated, and the results obtained.
The work piece materials used in these works include AISI 4140 alloy steel [3], EN-31 alloy steel [4] [6] [12], AISI 1040 medium carbon steel [5] [11] [17] [38], aluminum alloy [7] [9] [22] [33], LM25 AL-AL203 metal matric composite [8], resin [9] [33], Inconel 718, a nickel based super alloy [10] [18], AISI 302 austenitic alloy steel [13], AISI 410 alloy steel [14], 6063 aluminum alloy [15] [35], ferrous and non-ferrous materials [16], DSS UNS 31803 (2205) steel [19], EN-24 alloy steel [20] [21], and 11sMn30 alloy steel [23]. Others include SAF 2507, a super duplex stainless steel [24], EN-8 (AISI 1045) mild carbon steel [25] [32] [35] [41] [43], Al 6061 aluminum alloy [26], brass [27] [35], metal matrix composite steel [28], AISI 1020 mild steel [29], hard porcelain material [30], aluminum KS 1275 [31], titanium alloy (Ti-6AI-4V) [34], SS 304 and EN1A alloy [35], AISI 52100 hardened alloy steel [36], AISI 4340 alloy steel [37], chrome molybdenum 42CrMo24 alloy steel [40], and AA 2024 aluminum alloy.
The cutting tools used in these works include carbide rhomboid insert [3], diamond shaped carbide inserts [4] [6] [12], TNMG 160404-FL, WIDIA insert [5], HSS cutting tool [7] [9] [33] [38], SNMG 1204-QM H13A cutting tool [8], Titanium carbide based cermet insert [10] [42] [43], KENNAMETAL-KC5010 insert [11], CNMA 120404 [12], CNMA 120408 [12], CNMA 120412 [12], ceramic inserts [14], THN SNMG 08 Tungsten carbide insert [15], coated carbide insert [18] [22] [36], and coated carbide insert of ISO CNMG 120408 SM grade 1115 [19]. Others include coated tungsten carbide insert of ISO CNMG 120408 [20], WIDIA CNMG120408 coated Tungsten carbide insert [21], WIDIA CNMG 12040-47-TN 2000 cutting tool [23], uncoated cemented carbide cutting tool insert of type CNMG 120408-QM, grade H13A [24], standard carbide tool (ISO6 R2020) [25], Tungsten Carbide Tool [28], cemented carbide insert [29], Al2O3 cutting tool
[30], brass based diamond (VCMW) insert [31], cubic boron nitride (CBN) cutting tool [32], poly crystalline diamond (PCD) insert with ISO of CCMT09T304 [34], PVD and CVD coated inserts [37], and PCBN type VBG160404S01020F insert [41].
The most common amongst the investigated process variables are the cutting conditions, like the cutting speed, depth of cut and the rate of feed. Others include cutting tool variables like tool nose radius [4] [6] [12] [13] [14] [19], tool coatings [37], tool back rake angle [25]; work-piece variables like work-piece overhang [42]; and environmental variables like type of coolant [27] and minimum quantity of lubricant [34]. Phate and Tatwawadi [16] gave a holistic look by investigating a number of factors including the operator data, tool data, work-piece data, cutting conditions, machine data, and the environmental conditions. Mahajan et al [35] also gave a holistic look by investigating various machining field data.
International Journal of Emerging Technology and Advanced Engineering
Website: www.ijetae.com (ISSN 2250-2459,ISO 9001:2008 Certified Journal, Volume 6, Issue 3, March 2016)
56
The results of these works, based on surface roughness data, are much more similar, and essentially, they showed that surface roughness deteriorates with increase in feed rate, depth of cut, and back rake angle, with the feed rate having dominant effect. It improves with increase in cutting speed and tool nose radius, with the effect of nose radius being dominant. It should be noted that the extent of these effects differs due to the different investigated work-piece and cutting tool materials, and also, for the different machining environments (dry, medium or wet) under which the various experiments were performed. In most cases, surface roughness predictions were accurately achieved within limits from the RSM derived second order regression models. As reported in [42] [43] machining vibration was shown to have increase with increase in feed rate, depth of cut, cutting tool overhang, with cutting tool overhang being dominant, but decreased with increase in cutting speed. The established optimum working conditions varied due to the used work-piece and cutting tool materials, and the environment under which the machining processes were performed.
The main focus of this work, therefore, is on the use of response surface methodology (RSM) based on central composite (CC) design of experiment (DOE) to model,
predict and optimize the surface roughness (
R
a) and machining induced vibration (V
i) as functions of depth of cut, feed rate and tool overhang during turning of 41Cr4 alloy structural steel on a conventional lathe using standard work-piece sizes, cutting tool and measurement devices. Also, investigated is the relationship that would exist between surface roughness and machining induced vibration.II.MATERIALS,EQUIPMENT AND METHODS
A. Work-Piece
[image:3.612.387.493.469.550.2]The selected work-piece material was first subjected to chemical analysis in conjunction with mechanical tests at Standards Organization of Nigeria (SON), Emene, Enugu, to establish its chemical composition and mechanical properties, respectively. It was found to be 41Cr4 quenched and tempered (QT) alloy special steel, with material number of 1.7035 and equivalent grades of SAE-AISI 5140, BS 530M40, EN 10083-3 or EN18, and VC140, which is different from those previously investigated. Samples of 41Cr4 alloy steel bars are given in Fig. 1, with its chemical composition and mechanical properties given in Tables I and II, respectively. According to a technical report by FUHONG on special steels, 41Cr4 is one of the most widely used alloy steel. It is quite suitable for driving elements like crankshafts, front vehicle axles, axle journals and steering components. After Quenching and Tempering (QT) heat treatment, 41Cr4 alloy steel has good overall mechanical properties, low temperature impact toughness and hardenability. It can get higher fatigue strength after oil cooling. Its machinability is good when subjected to normalizing and QT conditions, but its weldability is not good, and as a result, cannot easily be produce when subjected to welding conditions. Test specimens of this material for the turning experiment are round bars having dimensions of diameter, 25 mm, and length, 150 mm.
International Journal of Emerging Technology and Advanced Engineering
Website: www.ijetae.com (ISSN 2250-2459,ISO 9001:2008 Certified Journal, Volume 6, Issue 3, March 2016)
57
TABLE I
CHEMICAL COMPOSITION OF 41CR4 ALLOY SPECIAL STEEL
Quality of material Type of material
Average elements %
Carbon (C)
Silicon (Si)
Manganese (Mn)
Chromium (Cr) Quenched and Tempered Steel 41Cr4 0.40 0.25 0.65 1.00
TABLE II
MECHANICAL PROPERTIES OF 41CR4 ALLOY SPECIAL STEEL
Sample ID Diameter (mm) Area (mm2) BHN Peak load (kN) Uts N/mm2
Solid, Round 10.00 78.55 278.48 70.92 902.83
B. Processing Equipment
A conventional lathe machine (Fig. 2), and a carbide cutting tool of the type F30 (Fig. 3) were used in the turning experiment. The overall dimensions of the tool insert is 25 mm x 25 mm x 12.5 mm. It also has a back rake angle of 10o, side rake angle of 12o, side relief angle of 5o and a side cutting edge angle of 15o.
Figure 2. Conventional Lathe Machine
Figure 3. Cutting Tool with Carbide Insert, F30
C. Input Variables
The selected factors, also known as process or input variables, are the tool overhang (A), feed rate (B) and depth of cut (C). Others were kept constant at intermediate levels of their values for the various runs of the experiment. Tool overhang (A) is the length of that part of the tool that sticks out of the machine tool post [38] [42]. It is measured in mm. Feed rate (B) is the speed of the cutting tool relative to that of the work-piece as the tool takes a cut along the axis of the work-piece [1]. It is measured in mm per revolution. The depth of cut (C) is taken along the radius of the work-piece as the tool cuts into it in a turning operation [1]. It is measured in mm. It is believed that these factors have influence on
the surface roughness (
R
a) and machining induced vibration (V
i), the extents of which are being pursued. Within limits, as given in Table III, in three levels, these factors can be set such as to minimize the surface roughness and machining induced vibration, and hence, improve on the quality of the machined part.TABLE III
LEVELS OF THE INPUT VARIABLES
S/N Parameters Notation Unit
Levels
Low Medium High
1 Tool Overhang A mm 1.0 2.0 3.0 2 Feed rate B mm/rev 0.15 0.20 0.30
3 Depth of cut C mm 50 55 60
D. Output Variables
The selected output variables, also known as the response or process performance variables, are the
surface roughness (
R
a) and machining induced vibration (V
i). Surface roughness, or simply, roughness is a measure of the texture of a surface [1].International Journal of Emerging Technology and Advanced Engineering
Website: www.ijetae.com (ISSN 2250-2459,ISO 9001:2008 Certified Journal, Volume 6, Issue 3, March 2016)
58
Rough surfaces wear faster and have higher friction coefficient than smooth surfaces. Roughness of a surface may form nucleation sites for cracks or corrosion, promote adhesion, and may be very expensive to control in manufacturing. Roughness is measured in microns or micrometers. An inside surface roughness tester, ISR-16 (Fig. 4) was selected for measurement of the surface
roughness. Roughness values (
R
a) were taken at three different positions located at 120o on surface and about the axis of the work-pieces. The average of these values represents the surface texture of the turned surface. Note [image:5.612.114.232.327.433.2]that
R
a [µm] is the center line average roughness [5]. It is the arithmetic deviation of the surface height from the mean line through the profile while the mean line separates the profile above and below it by equal area.Figure 4. Surface Roughness Tester, ISR-16
Figure 5. Vibration Meter with Transducer, 908 BE
Vibrations occurring during machining include a sudden clash of a tool against a work-piece; irregular tissues of the work-piece; regular excitation due to asymmetric torque; and bearing defects. Vibration due to a sudden clash of a tool against a work-piece occurs at the cutting zone, and has been treated as self-excited vibration or chatter, if excessive [38] [39] [40]. Chatter may give rise to defective machined surface, and excessive wear and breakage of the cutting tool.
Because self-excited vibration is induced at cutting zone due to interaction of the cutting tool, chips and work-piece during machining, it is being referred to as a machining induced vibration in this work. It influences the surface roughness of machined components [41] [42] [43], but because it cannot be manipulated or controlled as a factor, though can be measured, it is treated here as a response variable, measured as an acceleration amplitude in m/s2. A vibration meter, type 908 BE (Fig. 5), was selected for measurement of the amplitude of displacement and velocity of a point on the cutting tool. The level of tool vibration was measured using a vertical data of a transducer mounted near to the tip and connected to the vibration meter. The data included amplitude of displacement and velocity of the point on the cutting tool for each sample. The acceleration, thereafter, was calculated from the relation between the displacement, velocity and acceleration.
E. Design and Analysis of Experiment
The turning Experiment is designed so that the number of runs or trials can be reduced; optimum values of parameters can be determined; assessment of experimental error can be made; qualitative estimation of parameters can be made; and inference regarding the effect of parameters on the characteristics of the process can be made [2]. The response surface methodology (RSM), based on central composite (CC) design of experiment (DOE), was selected for modeling, prediction
and optimization of the surface roughness (
R
a) and machining induced vibration (V
i), the response or dependent variables, as functions of the tool overhang (A), feed rate (B) and the depth of cut (C), the factors or independent variables, in the turning experiment. RSM requires that, in a functional relationship between the response (Y
) and k quantitative factors (k
x
x
x
1,
2,
,
), given as:Y
x
1,
x
2,
,
x
k
e
r, the function (
) is known as the response surface or [image:5.612.106.240.456.551.2]International Journal of Emerging Technology and Advanced Engineering
Website: www.ijetae.com (ISSN 2250-2459,ISO 9001:2008 Certified Journal, Volume 6, Issue 3, March 2016)
59
The higher the degree of the polynomial the better is the correlation, though the higher will be the cost of
experimentation. The second order or quadratic response surface may take the form as:
r k
i
j i ij k
i i ii k
i
ix b x b xx e
b b
Y
1 1
2
1 1
0
(1)
Or
ki
j i ij k
i i ii k
i i i
k
b
b
x
b
x
b
x
x
x
x
x
1 1
2
1 0 2
1
,
,
,
(2)
Multiple regression equations or models of this form has the linear, square and cross-product terms, and can satisfactorily be used to correlate dependent variables with independent variables. The coefficients of the regression models may be estimated using a number techniques for design of experiment (DOE). For the situation studied the central composite (CC) was selected for design of the turning experiment. Analysis of variance (ANOVA) was used to validate the developed models, and also, to predict the effect of selected factors
A, B and C on the response characteristics,
V
i andR
a. Optimization of the response functions,V
i
A
,
B
,
C
and
R
a
A
,
B
,
C
subject to constraints as determined by the limits of the factors A, B and C was performed as appropriate using standard optimization technique. The RSM was implemented in the Design Expert 9 software version 9.0.6.2 environment.F. Experimental Procedure
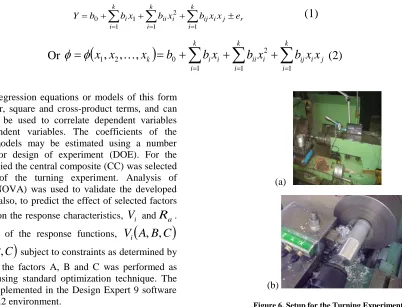
The setup for the turning experiment is given in Fig 6. In the setup, twenty-seven (27) standard specimen 41Cr4 alloy steel bars (Fig 1) were turned on the conventional lathe (Fig. 2) with carbide tool insert (Fig. 3) following a central composite (CC) design of experiment (DOE) in which factor combinations and sequence were appropriate for efficient data collection and analysis. During each experimental run, measurement of the machining induced vibration data were taken three times using a vibration transducer (Fig. 4) placed on the tool post near the cutting zone. The data was transmitted to the vibration meter (Fig. 5), and read out as displacement and velocity. The average cutting tool acceleration was determined from the general relations between displacement, velocity and acceleration. After each experimental run, measurement of the surface roughness also was taken at three (3) different locations, 120o from each other, on the machined surface using a surface roughness tester (Fig. 4). The average values were recorded.
(a)
[image:6.612.111.513.163.470.2](b)
Figure 6. Setup for the Turning Experiment
III. RESULTS AND DISCUSSION
The experiment was conducted taking into consideration all factors that could introduce error, which were minimized as appropriate. The data generated from the turning experiment was collected and presented as given in Table IV. Results of its analysis in Design Expert software version 9.0.6.2 environment are presented and discussed as follows:
A. Machining Induced Vibration Data
International Journal of Emerging Technology and Advanced Engineering
Website: www.ijetae.com (ISSN 2250-2459,ISO 9001:2008 Certified Journal, Volume 6, Issue 3, March 2016)
60
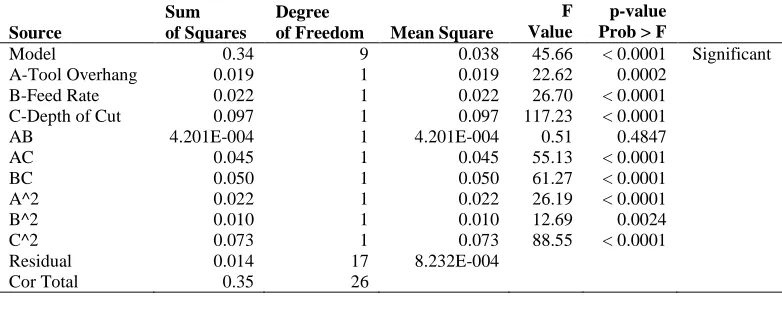
The ANOVA for response surface quadratic model of
i
V
, given in Table VI, confirms the significance of themodel as being capable of accurate prediction of
V
i within the selected limits, and also, that of the model terms A, B, C, A2, B2, C2, AC and BC as predictors ofi
V
with exception of the term AB, which is not signification. For the linear terms, C has dominantinfluence on
V
i followed by B, and then, A. For the square terms, C2 has dominant influence onV
i followed by A2, and the B2.For cross-products terms, BC has dominant influence
on
V
i when compare to AC. The predicted R-square of 0.9018, given in Table VII, is found to be in reasonable agreement with the adjusted R-square of 0.9392 since the difference of 0.0374 is less than 0.2. The adequacy precision of 24.271, greater than 4, is a desirable signal to noise ratio indicating that there is adequate signal, and that this model can be used to navigate the design space.The response surface models of the machining
induced vibration
V
i given in terms of the coded factors (Equation 3), and also, in terms of the actual factors (Equation 4), A, B and C, respectively, are:
BC
AC
AB
C
B
A
C
B
A
C
B
A
V
i065
.
0
062
.
0
005917
.
0
11
.
0
042
.
0
060
.
0
073
.
0
035
.
0
032
.
0
20
.
0
,
,
2 2 2
(3)
BC AC
AB C
B
A C
B A
C B A Vi
86444 . 0 0123 . 0 015778 . 0 11022 . 0 41728 . 7
00239778 .
0 84967 . 0 27519 . 0 23627 . 0 37021 . 5 , ,
2 2
2
[image:7.612.110.507.403.717.2](4)
TABLE IV
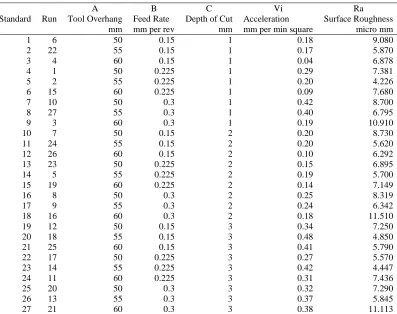
DATA GENERATED FROM TURNING EXPERIMENT
Standard Run
A B C Vi Ra
Tool Overhang Feed Rate Depth of Cut Acceleration Surface Roughness
mm mm per rev mm mm per min square micro mm
1 6 50 0.15 1 0.18 9.080
2 22 55 0.15 1 0.17 5.870
3 4 60 0.15 1 0.04 6.878
4 1 50 0.225 1 0.29 7.381
5 2 55 0.225 1 0.20 4.226
6 15 60 0.225 1 0.09 7.680
7 10 50 0.3 1 0.42 8.700
8 27 55 0.3 1 0.40 6.795
9 3 60 0.3 1 0.19 10.910
10 7 50 0.15 2 0.20 8.730
11 24 55 0.15 2 0.20 5.620
12 26 60 0.15 2 0.10 6.292
13 23 50 0.225 2 0.15 6.895
14 5 55 0.225 2 0.19 5.700
15 19 60 0.225 2 0.14 7.149
16 8 50 0.3 2 0.25 8.319
17 9 55 0.3 2 0.24 6.342
18 16 60 0.3 2 0.18 11.510
19 12 50 0.15 3 0.34 7.250
20 18 55 0.15 3 0.48 4.850
21 25 60 0.15 3 0.41 5.790
22 17 50 0.225 3 0.27 5.570
23 14 55 0.225 3 0.42 4.447
24 11 60 0.225 3 0.31 7.436
25 20 50 0.3 3 0.32 7.290
26 13 55 0.3 3 0.37 5.845
International Journal of Emerging Technology and Advanced Engineering
Website: www.ijetae.com (ISSN 2250-2459,ISO 9001:2008 Certified Journal, Volume 6, Issue 3, March 2016)
61
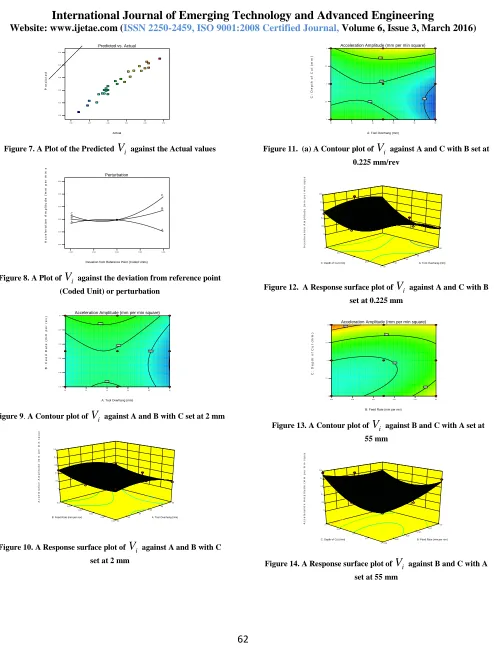
Equation (4), was used to generate the predicted
values of
V
i, a plot of which against the actual values (Table IV), given in Fig. 7, illustrates how well thepredicted
V
i data fits the actual data. As shown in Fig. 8, the machining induced vibrationV
i has nonlinear relationship with factors A, B and C, and that effect ofthese factors on
V
i became more significant at the higher levels of these factors, when compared to that at lower levels.At higher levels of these factors, Vi decreased with
increase in A, but increased with increase in B and C from the reference point. At lower levels of the factors,
i
V
increased with increase in A, but decreased with increase in B and C toward the reference point. Theimplication of the behavior is that
V
i is minimized when the factors, except A, are set at lower level of their values. These behaviors can also be seen in the contour and response surface plots given in Figs 9 to 14. It can be attributed to the observed multiple interaction between factors.TABLE V
MODEL SUMMARY STATISTICS
Source
Standard
Deviation R-Squared
Adjusted R-Squared
Predicted
R-Squared PRESS
Linear 0.097 0.3892 0.3096 0.1435 0.30
2FI 0.077 0.6625 0.5612 0.4448 0.20
Quadratic 0.029 0.9603 0.9392 0.9018 0.035 Suggested
[image:8.612.111.502.415.570.2]Cubic 0.033 0.9688 0.9189 0.7174 0.100 Aliased
TABLE VI
ANOVA FOR RESPONSE SURFACE QUADRATIC MODEL OF THE ACCELERATION AMPLITUDE (VI)
Source
Sum of Squares
Degree
of Freedom Mean Square
F Value
p-value Prob > F
Model 0.34 9 0.038 45.66 < 0.0001 Significant
A-Tool Overhang 0.019 1 0.019 22.62 0.0002
B-Feed Rate 0.022 1 0.022 26.70 < 0.0001
C-Depth of Cut 0.097 1 0.097 117.23 < 0.0001
AB 4.201E-004 1 4.201E-004 0.51 0.4847
AC 0.045 1 0.045 55.13 < 0.0001
BC 0.050 1 0.050 61.27 < 0.0001
A^2 0.022 1 0.022 26.19 < 0.0001
B^2 0.010 1 0.010 12.69 0.0024
C^2 0.073 1 0.073 88.55 < 0.0001
Residual 0.014 17 8.232E-004
Cor Total 0.35 26
TABLE VII
QUADRATIC MODEL STATISTICS
Standard Deviation 0.029 R-Squared 0.9603
Mean 0.26 Adjusted R-Squared 0.9392
C.V. % 11.18 Predicted R-Squared 0.9018
International Journal of Emerging Technology and Advanced Engineering
Website: www.ijetae.com (ISSN 2250-2459,ISO 9001:2008 Certified Journal, Volume 6, Issue 3, March 2016)
[image:9.612.63.557.97.753.2]62
Figure 7. A Plot of the Predicted
V
i against the Actual valuesFigure 8. A Plot of
V
i against the deviation from reference point (Coded Unit) or perturbationFigure 9. A Contour plot of
V
i against A and B with C set at 2 mmFigure 10. A Response surface plot of
V
i against A and B with C set at 2 mmFigure 11. (a) A Contour plot of
V
i against A and C with B set at 0.225 mm/revFigure 12. A Response surface plot of
V
i against A and C with B set at 0.225 mmFigure 13. A Contour plot of
V
i against B and C with A set at 55 mmFigure 14. A Response surface plot of
V
i against B and C with A set at 55 mmDesign-Expert® Software Acceleration Amplitude Color points by value of Acceleration Amplitude: 0.48 0.04 Actual P r e d ic te d
Predicted vs. Actual
0.00 0.10 0.20 0.30 0.40 0.50
0.00 0.10 0.20 0.30 0.40 0.50
Design-Expert® Software Factor Coding: Actual Acceleration Amplitude (mm per min square) Actual Factors A: Tool Overhang = 55 B: Feed Rate = 0.225 C: Depth of Cut = 2
-1.000 -0.500 0.000 0.500 1.000
0.00 0.10 0.20 0.30 0.40 0.50 A A B B C C Perturbation
Deviation from Reference Point (Coded Units)
A c c e le r a ti o n A m p li tu d e ( m m p e r m in s q u a r e ) Design-Expert® Software Factor Coding: Actual Acceleration Amplitude (mm per min square)
Design Points
0.48
0.042
X1 = A: Tool Overhang X2 = B: Feed Rate Actual Factor C: Depth of Cut = 2
50 52 54 56 58 60
0.15 0.18 0.21 0.24 0.27
0.3 Acceleration Amplitude (mm per min square)
A: Tool Overhang (mm)
B : F e e d R a te ( m m p e r r e v ) 0.15 0.2 0.2 0.25 Design-Expert® Software Factor Coding: Actual Acceleration Amplitude (mm per min square)
Design points above predicted value
Design points below predicted value
0.48
0.042
X1 = A: Tool Overhang X2 = B: Feed Rate Actual Factor C: Depth of Cut = 2
0.15 0.18 0.21 0.24 0.27 0.3 50 52 54 56 58 60 0 0.1 0.2 0.3 0.4 0.5 A c c e le ra ti o n A m p li tu d e ( m m p e r m in s q u a r e )
A: Tool Overhang (mm) B: Feed Rate (mm per rev)
Design-Expert® Software Factor Coding: Actual Acceleration Amplitude (mm per min square)
Design Points
0.48
0.042
X1 = A: Tool Overhang X2 = C: Depth of Cut Actual Factor B: Feed Rate = 0.225
50 52 54 56 58 60
1 1.5 2 2.5
3 Acceleration Amplitude (mm per min square)
A: Tool Overhang (mm)
C : D e p th o f C u t ( m m ) 0.1 0.2 0.2 0.3 Design-Expert® Software Factor Coding: Actual Acceleration Amplitude (mm per min square)
Design points above predicted value
Design points below predicted value
0.48
0.042
X1 = A: Tool Overhang X2 = C: Depth of Cut Actual Factor B: Feed Rate = 0.225
1 1.5 2 2.5 3 50 52 54 56 58 60 0 0.1 0.2 0.3 0.4 0.5 A c c e le ra ti o n A m p li tu d e ( m m p e r m in s q u a r e )
A: Tool Overhang (mm) C: Depth of Cut (mm)
Design-Expert® Software Factor Coding: Actual Acceleration Amplitude (mm per min square)
Design Points
0.48
0.042
X1 = B: Feed Rate X2 = C: Depth of Cut Actual Factor A: Tool Overhang = 55
0.15 0.18 0.21 0.24 0.27 0.3
1 1.5 2 2.5
3 Acceleration Amplitude (mm per min square)
B: Feed Rate (mm per rev)
C : D e p th o f C u t ( m m ) 0.2 0.3 0.3 0.4 Design-Expert® Software Factor Coding: Actual Acceleration Amplitude (mm per min square)
Design points above predicted value
Design points below predicted value
0.48
0.042
X1 = B: Feed Rate X2 = C: Depth of Cut Actual Factor A: Tool Overhang = 55
1 1.5 2 2.5 3 0.15 0.18 0.21 0.24 0.27 0.3 0 0.1 0.2 0.3 0.4 0.5 A c c e le r a ti o n A m p li tu d e ( m m p e r m in s q u a r e )
International Journal of Emerging Technology and Advanced Engineering
Website: www.ijetae.com (ISSN 2250-2459,ISO 9001:2008 Certified Journal, Volume 6, Issue 3, March 2016)
63
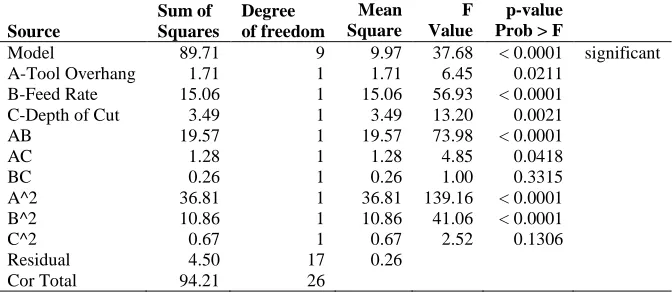
B. Surface Roughness DataThe model summary statistics, given in Table VIII, shows that a quadratic regression model is suggested as being adequate for accurate fitting of the surface roughness data, with a standard deviation of 0.51, R-square value of 0.9523, adjusted R-R-square value of 0.9270, predicted R-square value of 0.8903. Analysis of variance (ANOVA), given in Table IX, shows that the model is significant for accurate prediction of the surface
roughness
R
a within the design limits of the factors A, B and C. It also shows that the influence of model terms,A, B, C, A2, B2, AB, and AC on
R
a is significant, except the terms C2 and BC. Amongst the linear terms, Bhas dominant influence on
R
a followed by C, and then, A.Whereas, for the square terms, A2 has dominant
influence on
R
a when compare to B2, the least being C2. For the cross-product terms, AB has dominantinfluence on
R
a followed by AC, with the least being BC. The quadratic model statistics, given in Table X, shows that the predicted R-square value of 0.8903 is in reasonable agreement with the adjusted R-square value of 0.9270, since the difference of 0.0367 is less than 0.2. The adequacy precision of 22.671, greater than 4, is a desirable signal to noise ratio. This indicates that there is adequate signal, and that this model can also be used to navigate the design space.The response surface models of the surface roughness
(
R
a), given in terms of the coded factors (Equation 5) and actual factors (Equation 6), are given as follows:
2 2
2
33
.
0
35
.
1
48
.
2
15
.
0
33
.
0
28
.
1
44
.
0
91
.
0
31
.
0
85
.
4
,
,
C
B
A
BC
AC
AB
C
B
A
C
B
A
R
a
(5)
2 2
2
3335
.
0
17037
.
239
099073
.
0
97889
.
1
065367
.
0
40533
.
3
14692
.
3
68222
.
286
73341
.
11
28939
.
360
,
,
C
B
A
BC
AC
AB
C
B
A
C
B
A
R
a
[image:10.612.135.475.455.520.2](6)
TABLE VIII
MODEL SUMMARY STATISTICS
Source
Standard.
Deviation R-Squared
Adjusted R-Squared
Predicted
R-Squared PRESS
Linear 1.79 0.2150 0.1127 -0.0922 102.89
2FI 1.63 0.4392 0.2709 -0.0465 98.58
Quadratic 0.51 0.9523 0.9270 0.8903 10.34 Suggested
Cubic 0.42 0.9814 0.9516 0.9015 9.28 Aliased
TABLE IX
ANOVA FOR RESPONSE SURFACE QUADRATIC MODEL FOR SURFACE ROUGHNESS
Source
Sum of Squares
Degree of freedom
Mean Square
F Value
p-value Prob > F
Model 89.71 9 9.97 37.68 < 0.0001 significant
A-Tool Overhang 1.71 1 1.71 6.45 0.0211
B-Feed Rate 15.06 1 15.06 56.93 < 0.0001
C-Depth of Cut 3.49 1 3.49 13.20 0.0021
AB 19.57 1 19.57 73.98 < 0.0001
AC 1.28 1 1.28 4.85 0.0418
BC 0.26 1 0.26 1.00 0.3315
A^2 36.81 1 36.81 139.16 < 0.0001
B^2 10.86 1 10.86 41.06 < 0.0001
C^2 0.67 1 0.67 2.52 0.1306
Residual 4.50 17 0.26
[image:10.612.139.475.558.704.2]International Journal of Emerging Technology and Advanced Engineering
Website: www.ijetae.com (ISSN 2250-2459,ISO 9001:2008 Certified Journal, Volume 6, Issue 3, March 2016)
64
TABLE X
QUADRATIC MODEL STATISTICS``
Std. Dev. 0.51 R-Squared 0.9523
Mean 7.17 Adjusted R-Squared 0.9270
C.V. % 7.17 Predicted R-Squared 0.8903
PRESS 10.34 Adequacy Precision 22.671
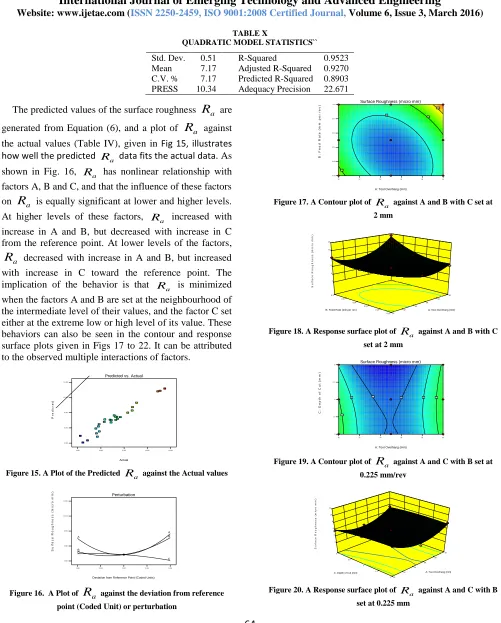
The predicted values of the surface roughness
R
a are generated from Equation (6), and a plot ofR
a against the actual values (Table IV), given in Fig 15, illustrates how well the predicted Ra data fits the actual data. Asshown in Fig. 16, Ra has nonlinear relationship with
factors A, B and C, and that the influence of these factors
on
R
a is equally significant at lower and higher levels. At higher levels of these factors, Ra increased withincrease in A and B, but decreased with increase in C from the reference point. At lower levels of the factors,
a
R
decreased with increase in A and B, but increased with increase in C toward the reference point. The implication of the behavior is thata
[image:11.612.56.557.112.735.2]R is minimized when the factors A and B are set at the neighbourhood of the intermediate level of their values, and the factor C set either at the extreme low or high level of its value. These behaviors can also be seen in the contour and response surface plots given in Figs 17 to 22. It can be attributed to the observed multiple interactions of factors.
Figure 15. A Plot of the Predicted Ra against the Actual values
Figure 16. A Plot of
R
a against the deviation from reference point (Coded Unit) or perturbationFigure 17. A Contour plot of
a
R against A and B with C set at 2 mm
[image:11.612.106.235.482.574.2]Figure 18. A Response surface plot of Ra against A and B with C set at 2 mm
Figure 19. A Contour plot of
R
a against A and C with B set at 0.225 mm/revFigure 20. A Response surface plot of a
R against A and C with B set at 0.225 mm
Design-Expert® Software Surface Roughness Color points by value of Surface Roughness: 11.510 4.226 Actual P r e d ic te d
Predicted vs. Actual
4.000 6.000 8.000 10.000 12.000
4.000 6.000 8.000 10.000 12.000
Design-Expert® Software Factor Coding: Actual Surface Roughness (micro mm) Actual Factors A: Tool Overhang = 55 B: Feed Rate = 0.225 C: Depth of Cut = 2
-1.000 -0.500 0.000 0.500 1.000
4.000 6.000 8.000 10.000 12.000 A A B B C C Perturbation
Deviation from Reference Point (Coded Units)
S u r fa c e R o u g h n e s s ( m ic r o m m ) Design-Expert® Software Factor Coding: Actual Surface Roughness (micro mm)
Design Points
11.51
4.226
X1 = A: Tool Overhang X2 = B: Feed Rate Actual Factor C: Depth of Cut = 2
50 52 54 56 58 60
0.15 0.18 0.21 0.24 0.27
0.3 Surface Roughness (micro mm)
A: Tool Overhang (mm)
B : F e e d R a te ( m m p e r r e v ) 6 8 8 10 Design-Expert® Software Factor Coding: Actual Surface Roughness (micro mm)
Design points above predicted value
Design points below predicted value
11.51
4.226
X1 = A: Tool Overhang X2 = B: Feed Rate Actual Factor C: Depth of Cut = 2
0.15 0.18 0.21 0.24 0.27 0.3 50 52 54 56 58 60 2 4 6 8 10 12 S u r fa c e R o u g h n e s s ( m ic r o m m )
A: Tool Overhang (mm) B: Feed Rate (mm per rev)
Design-Expert® Software Factor Coding: Actual Surface Roughness (micro mm)
Design Points
11.51
4.226
X1 = A: Tool Overhang X2 = C: Depth of Cut Actual Factor B: Feed Rate = 0.225
50 52 54 56 58 60
1 1.5 2 2.5
3 Surface Roughness (micro mm)
A: Tool Overhang (mm)
C : D e p th o f C u t ( m m ) 5 5 6 6 7 7 Design-Expert® Software Factor Coding: Actual Surface Roughness (micro mm)
Design points above predicted value
Design points below predicted value
11.51
4.226
X1 = A: Tool Overhang X2 = C: Depth of Cut Actual Factor B: Feed Rate = 0.225
1 1.5 2 2.5 3 50 52 54 56 58 60 2 4 6 8 10 12 S u r fa c e R o u g h n e s s ( m ic r o m m )
International Journal of Emerging Technology and Advanced Engineering
Website: www.ijetae.com (ISSN 2250-2459,ISO 9001:2008 Certified Journal, Volume 6, Issue 3, March 2016)
[image:12.612.60.520.106.562.2]65
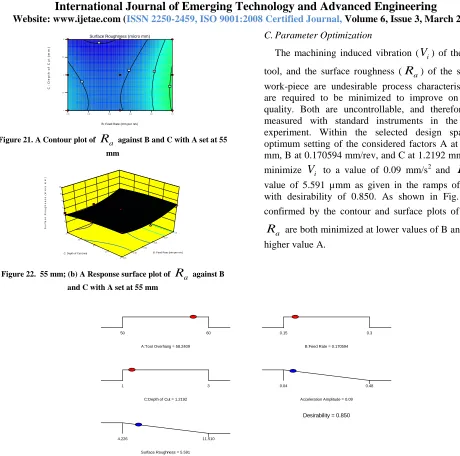
Figure 21. A Contour plot of
R
a against B and C with A set at 55 mmFigure 22. 55 mm; (b) A Response surface plot of
R
a against B and C with A set at 55 mmC. Parameter Optimization
The machining induced vibration (
V
i) of the cutting tool, and the surface roughness (R
a) of the specimen work-piece are undesirable process characteristics that are required to be minimized to improve on product quality. Both are uncontrollable, and therefore, were measured with standard instruments in the turning experiment. Within the selected design space, the optimum setting of the considered factors A at 58.2409 mm, B at 0.170594 mm/rev, and C at 1.2192 mm, wouldminimize
V
i to a value of 0.09 mm/s2 andR
a to a value of 5.591 µmm as given in the ramps of Fig 13, with desirability of 0.850. As shown in Fig. 23 andconfirmed by the contour and surface plots of
V
i anda
R
are both minimized at lower values of B and C, and higher value A.Figure 23. Ramps of the Optimum Setting of Factors, which Minimized the Surface Roughness and Machining Induced Vibration
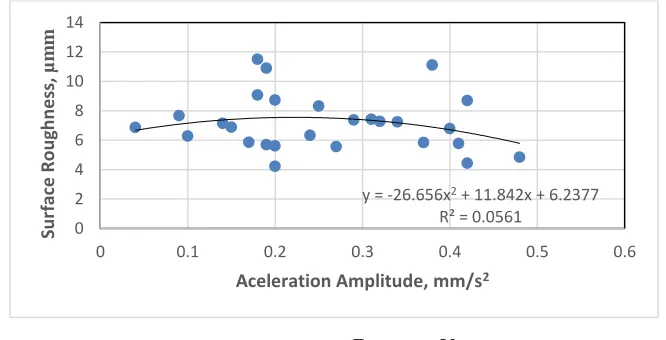
D. Surface Roughness vs Machining Induced Vibration
Normally, the machining induced vibration (
V
i) is expected to have influence on surface roughness (R
a) as it impacts negatively on the cutting zone in turning operations.However, as shown in the plot of
R
a versusV
igiven in Fig 24, there is nonlinear relationship, but no significant correlation between these process characteristics within the experimental design limits as can be seen from the R-square value of the trend line of 0.0561, but there may be correlation outside these limits.
Design-Expert® Software Factor Coding: Actual Surface Roughness (micro mm)
Design Points
11.51
4.226
X1 = B: Feed Rate X2 = C: Depth of Cut Actual Factor A: Tool Overhang = 55
0.15 0.18 0.21 0.24 0.27 0.3
1 1.5 2 2.5
3 Surface Roughness (micro mm)
B: Feed Rate (mm per rev)
C
:
D
e
p
th
o
f
C
u
t
(
m
m
)
4
5
5 6
7
Design-Expert® Software Factor Coding: Actual Surface Roughness (micro mm)
Design points above predicted value
Design points below predicted value
11.51
4.226
X1 = B: Feed Rate X2 = C: Depth of Cut Actual Factor A: Tool Overhang = 55
1 1.5 2 2.5 3
0.15 0.18
0.21 0.24
0.27 0.3 2
4 6 8 10 12
S
u
r
fa
c
e
R
o
u
g
h
n
e
s
s
(
m
ic
r
o
m
m
)
B: Feed Rate (mm per rev) C: Depth of Cut (mm)
A:Tool Overhang = 58.2409
50 60
B:Feed Rate = 0.170594
0.15 0.3
C:Depth of Cut = 1.2192
1 3
Acceleration Amplitude = 0.09
0.04 0.48
Surface Roughness = 5.591
4.226 11.510
International Journal of Emerging Technology and Advanced Engineering
Website: www.ijetae.com (ISSN 2250-2459,ISO 9001:2008 Certified Journal, Volume 6, Issue 3, March 2016)
[image:13.612.139.472.135.305.2]66
Figure 24. A plot of
R
a againstV
iIV. CONCLUSION
A turning experiment was conducted on 41Cr4 alloy special steel with standard cutting tool and measuring instruments. The response surface methodology, based on the central composite design of experiment was used to model, predict and optimize the machining induced vibration and surface roughness as functions of the tool overhang, feed rate and depth of cut. Analyses and optimization of the response characteristics data was performed in the Design Expert version 9.0.6.2 software environment. It was found that:
a. The developed quadratic regression models can be used for accurate prediction of the selected process characteristics within limits of the selected factors. b. The machining induced vibration of the cutting tool
has nonlinear relationships with the tool overhang, feed rate and the depth of cut. The effect of these factors on the machining induced vibration is more significant at the higher levels of their values, when compared to the same effect at lower levels of their values. Also, the machining induced vibration would be minimized when the factors are set at values within the lower levels of the factors. An exception is the tool overhang whose value must be set a higher level. c. The surface roughness of the work-piece also has
nonlinear relationship with the tool overhang, feed rate and the depth of cut. The effect of tool the overhang and feed rate on the surface roughness are quite significant both at lower and higher levels of their values. There is no significant effect of the depth of cut on this parameter. The surface roughness is minimized at neighbourhood of the intermediate levels of the factors.
An exception is the depth of cut whose value set at the high level would lead to minimization of the surface roughness
d.Within the selected design space, the optimum setting of the considered factors A at 58.2409 mm, B at 0.170594 mm/rev, and C at 1.2192 mm, would
minimize
V
i to a value of 0.09 mm/s2 andR
a to a value of 5.591 µmm, with desirability of 0.850. e. Also within the selected design space, there isnonlinear relationship, but there is no significant correlation between the surface roughness and the machining induced vibration, as can be seen from the R-square value of 0.0561. However, there may be correlation outside this limits.
REFERENCE
[1] Kumar, N. and Uppal, N., 2013, A Review on Various
Optimization Techniques used in Turning Operation for Improving Surface Roughness, Mechanica Confab, Vol. 2, No. 4, 45 -51
[2] Aggarwal, A. and Singh, H., 2005, Optimization of Machining
Techniques – A retrospective and literature review, Sadhana, Vol. 30, Part 6, 699 – 711
[3] Ozcakar, N. and Kasapogu, O. A., 2009, Modeling of Surface
Roughness in Machining, Yontim, Yil 20, Saya 64, 27 – 40
[4] Abhang, L. B. and Hameedullah, M., 2010, Power Prediction
Model for Turning EN-31 Steel Using Response Surface Methodology, Journal of Engineering Science and Technology Review, Vol. 3, No. 1, 116 – 122
[5] Sahoo, P., 2011, Optimization of Turning Parameters for Surface
Roughness using RSM and GA, Advances in Production Engineering and Management, Vol. 6, No. 3, 197 – 208
[6] Abhang, L. B. and Hameedullah, M., 2011, Optimization of
Power Consumption by Desirability Function Approach, International journal on Resent Trends in Engineering and Technology. Vol. 6, No. 2, 287 – 290
y = -26.656x2 + 11.842x + 6.2377 R² = 0.0561
0 2 4 6 8 10 12 14
0 0.1 0.2 0.3 0.4 0.5 0.6
Su
rface
R
o
u
gh
n
e
ss,
µm
m
International Journal of Emerging Technology and Advanced Engineering
Website: www.ijetae.com (ISSN 2250-2459,ISO 9001:2008 Certified Journal, Volume 6, Issue 3, March 2016)
67
[7] Sastry, M. N. and Devi, K. D., 2011, Optimization of
Performance Measures in CNC Turning using Design of experiment (RSM), Science Insight: An International Journal, Vol.1, No. 1, 1 – 5
[8] Srinivasan, A., Arunachalam, R. M., Ramesh, S. and
Senthilkumaar, J. S., 2012, Machining Performance Study on Metal matrix Composites – A Response Surface Methodology Approach, American Journal of Applied Science, Vol. 9, No. 4, 478 – 483
[9] Ramudu, C. and Sastry, M. N., 2012, Analysis and Optimization
of Turning Process Parameters using Design of Experiment, International journal of Engineering Research and Applications, Vol. 2, issue 6, 020 -027
[10] Aruna, M. and Dhanalaksmi, V., 2012, Design Optimization of
Cutting Parameters when Turning Inconel 718 with Cermet Inserts, International Journal of Mechanical and Aerospace Engineering, vol. 6, 187 – 190
[11] Chomamutr, K. and Jongprasithporn, S., 2012, Optimization
Parameters of Tool Life Model using the Taguchi Approach and Response Methodology, International Journal of Computer Science Issues, Vol. 9, Issue 1, No. 3, 120 – 125
[12] Abhang, L. B. and Hameedullah, M., Optimal Machining
Parameters for Achieving the Desired Surface Roughness in Turning of Steel, Technical Journal of Engineering Research (TJER), Vol. 9, No. 1, 37 – 45
[13] Manu, R., Akbar, B. S., and Sharmas, V. S., 2013, Predictive
Machinability Model of Hardened Steel Material in Turning Operation by Response Surface Regression Method, International Journal of Applications or Innovation in Engineering and Management, Vol. 2, Issue 10, 330 – 334
[14] Makadia, A. J. and Nanavati, J. I., 2013, Optimization of
Machining Parameters for Turning Operations Based on Response Surface Methodology, Measurement, Elsevier, Vol. 46, 1521 – 1529
[15] Kannan, A., Esakkiraja, K. and Mataraj, M., 2013, Modeling and
Analysis for Cutting Temperature in Turning of Aluminium 6063 using Response Surface Methodology, Journal of Mechanical and Civil Engineering, Vol. 9, Issue 4, 59 – 64
[16] Phate, M. and Tatwawadi, V. H., 2013, Formulation of a Field
Data Based Model for a surface Roughness using Response Surface Method, International Journal of Science, Engineering and Technology Research, Vol. 2, Issue 4, 793 – 798
[17] Bhulyan, T. H. and Ahmed, I., 2013, Optimization of Cutting
Parameters in Turning Process, Journal of Production Engineering, Vol. 16, No. 2, 11 – 19
[18] Manohar, M., Joseph, J., Selvaraj, T. and Sivakumar, D., 2013,
Application of Box Behnken Design to Optimize the Parameters for Turning Inconel 718 using Carbide Tools, International Journal of scientific and Engineering Research, Vol. 4, Issue 4, 620 – 642
[19] Thiyagu, M., Karunamoorthy, L. and Arunkumar, N., 2014,
Experimental Studies in machining Duplex Stainless Steel using Response Surface Methodology, International Journal of Mechanical Engineering, Vol. 14, No. 3, 48 – 61
[20] Saini, P. and Parkash, S., 2014, A Multi Response Optimization
of Machining Parameters for Surface Roughness and MRR in High Speed CNC Turning of EN-24 Alloy Steel using Response Surface Methodology, International Journal of Engineering Science and Research Technology, Vol. 3, Issue 9, 333 – 345
[21] Saini, P., Parkash, S. and Choudhary, D., 2014, 2014,
Experimental Investigation of Machining Parameters for Surface Roughness in High Speed CNC Turning of EN-24 Alloy Steel using Response Surface Methodology, International Journal of Engineering Research and Applications, Vol. 4, Issue 5, 153 – 160
[22] Soni, V., Mondal, S. and Singh, B., 2014, Process Parameters
Optimization in Turning of Aluminum using a New Hybrid
Approach, International Journal of Innovative Science,
Engineering, and Technology, Vol. 1, Issue 3, 418 – 423
[23] Shunmugesh, K., Panneerselvam, K. and Amal, G., 2014,
Optimization of Turning Parameters with Carbide Tool for
Surface Roughness Analysis using Response Surface
Methodology, International journal of research in Aeronautical and Mechanical Engineering, Vol. 2, Issue 6, 17 – 27
[24] Kumar, M. S., 2014, A Detailed Comparison among Dry, Wet
and Gas Cooled Machining of Super Duplex Stainless Steel, Global Journal of Researches in Engineering: A Mechanical and Mechanics Engineering, Vol. 14, Issue 7,
[25] Khan, M. A., Kittur, J. K. and Kohir, V. D., 2015, Study and
Analysis of Effect of Cutting Parameters on Cutting Forces and Surface Roughness, Advanced Engineering and Applied Sciences,: An International Journal, vol. 5, No. 3, 63 – 73
[26] Devkumar, V., Sreedhar, E. and Prabakaran, M. P., 2015,
Optimization of Machining Parameters on AL 6061 Alloy using Response Surface methodology, International Journal of Applied Research, Vol. 1, No. 7, 01 – 04
[27] Devi, K. D., Babu, K. S. and Reddy, K. H., 2015, Mathematical
Modeling and Optimization of Turning process Parameters using Response Surface Methodology, International Journal of Applied Science and Engineering, Vol. 13, No. 1, 55 – 68
[28] Rajpoot, B. S., Moond, D. R. and Shrivastava, S., 2015,
Investigating the effect of Cutting Parameters on the Average Surface Roughness and materials Removal Rate during Turning
of Metal Matrix Composite using Response Surface
Methodology, International Journal on Recent and Innovation Trends in Computing and Communication, Vol. 3, Issue 1, 241 – 247
[29] Khidhir, B. A., A-Oqaiel, W. and Kareem, P. M., 2015,
Prediction Models by Response Surface Methodology for Turning Operation, American Journal of Modeling and Optimization, Vol. 3, No. 1, 1 – 6
[30] Agrawal, S., Guar, M. K., Kasdekar, D. K., Agrawal, S. and
Malvi, C. S., 2015, Optimal Machining Condition for Turning of Hard Porcelain using Response Surface Methodology, European Journal of Advances in Engineering and Technology, Vol. 2, No. 5, 44 – 51
[31] Ranganath, M. S., Vipin, Kumar, N., and Kumar, R., 2015,
Experimental Analysis of Surface Roughness in CNC Turning of Aluminum using Response Surface Methodology, International Journal of Advanced Research and Innovation, Vol. 3, Issue 1, 45 – 49
[32] Chandra, B. S. and Prasad, M. V. R. D., 2015, Parameter
Optimization while Dry Turning AISI 1045 Steel using CBN Tool by Response Surface Methodology, GE International Journal of Engineering Research, Vol. 3, Issue 7, 69 – 82
[33] Sastry, M. N., Devi, K. D. and Reddy, K. M., 2012, Analysis and
Optimization of machining Parameters using Design of
International Journal of Emerging Technology and Advanced Engineering
Website: www.ijetae.com (ISSN 2250-2459,ISO 9001:2008 Certified Journal, Volume 6, Issue 3, March 2016)
68
[34] Revankar, G. D., Shetty, R., Rao, S. S., and Gaitonde, V. N.,
2013, Response Surface Model for Surface Roughness during Finish Turning of Titanium Alloy under Minimum Quantity Lubrication, International Conference on Emerging Trends in Engineering and Technology, Dec. 7 – 8, 78 – 84
[35] Mahajan, C. K., Mote, M. L., Patil, B. V. and Patil, H. G., 2013,
Formulation and Simulation of a Field Data Based Model for the Turning process by using Response Surface Method, International Journal of Advanced Scientific and Technical Research, Vol. 2, Issue 3, 355 – 370
[36] Shihab, S. K., Khan, Z. A., Mohammad, A. and Siddiquee, A.
N., 2014, Optimization of Surface Integrity in Dry Hard Turning using RSM, Sadhand, Vol. 39, Part 5, 1035 – 1053
[37] Gupta, U. and Kohi, A., 2014, Experimental Investigation of
Surface Roughness in Dry Turning of AISI 4340 Alloy Steel using PVD- and CVD-Coated Carbide Inserts, International Journal of Innovations in Engineering and Technology, Vol. 4, Issue 1, 94 – 103
[38] Kassab, S. Y. and Khoshnaw, Y. K., 2007, The Effect of Cutting
Tool Vibration on Surface Roughness of Work-piece in Dry Turning Operation, Engineering and technology, Vol. 25, No. 7, 879 – 889
[39] Han, X., Wang, M. and Ouyang, H., 2009, Vibration of
Work-Pieces during Turning Operations, Journal of Physics: Conference Series 181, http://iopscience.iop.org/1742-6596/181/1/012032, 1 – 7
[40] Cahuc, O., K’nevez, J Y., Gerard, A., Darnis, P., Albert, G., Bisu,
C. F., and Gerard, C., 2010, Self-Excited Vibrations in Turning: Cutting Moment Analysis, International Journal of Advanced manufacturing Technology, version 1 – 9, 1 – 9
[41] Delijaicov, S., Leonardi, F., Bordinassi, E. C., and Batalha, G. F.,
2010, Improved Model to predict Machined Surface Roughness based on the Cutting Vibrations signal during Hard Turning, Archives of Materials Science and Engineering, Vol. 45, Issue 2, 102 – 107
[42] Rogov, V. A. and Siamak, G., 2013, Optimization of Surface
Roughness and Vibration in Turning of Aluminum Alloy AA2024 Using Taguchi Technique, International Journal of
Mechanical, Aerospace, Industrial, Mechatronic and
Manufacturing Engineering Vol. 7, No. 11, 2330 – 2339
[43] Rogov, V. A. and Siamak, G., 2014, The Effect of Tool