International Journal of Emerging Technology and Advanced Engineering
Website: www.ijetae.com (ISSN 2250-2459,ISO 9001:2008 Certified Journal, Volume 4, Issue 11, November 2014)
511
River Monitoring an Application for Wireless Sensor Network
Platform
Trusha R. Wagh
1, Dr. A. P. Rao
21
Student, 2Faculty, Department of E&TC, Jayawantrao Sawant College of Engg, Hadapsar, Pune, 411028, India
Abstract— WSN system is the most recent and cost effective system for monitoring and controlling the enviournmental applications. It is also a demanding task to use efficiently the energy harvesting system (EHS) technology for WSN. The system performs the measurements using integrated peripherals to process the measured data as well as to co-ordinate the data transport of the WSN to work. Basically River mote is a case study for designing a low cost hardware system architecture combining low-power mote and a highly efficient EHS architecture. The main requirement of this system is continuous operation using Energy Harvesting System. The work includes first the water level monitoring platform using only the ultra sonic sensor and second the PH balance to know the toxicity present in water. This system provides a real-time guidance to those industry that depends on regional water quality conditions like industry, agriculture, aquatic life etc.
Keywords-- Energy Harvesting system (EHS); Zig-Bee module; Ultrasonic sensor; Ph sensor; Wireless sensor network(WSN).
I. INTRODUCTION
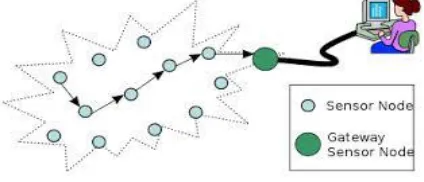
Earth’s surface consists with 71 % of water in it. Water plays a very important role for all living being, but due to growing industries and technical life style the water is getting polluted by man. The environmental monitoring system ie the water monitoring system is hence a recent technology that helps to control water pollution. In previous days man himself had to check the pollutant contents as well as the level using handheld devices as shown in Fig 1. WSN ie wireless sensor network thus helps to reduce the physical efforts to an automatic sytsem. WSN network typically consists of a high number of sensor nodes, also called motes, and of one or few gateway nodes. The gateway node is connected with a computer to access the data of the WSN. Each mote collects information about its environment using the attached sensors.This information is forwarded to gateway nodes in a multi-hop manner as shown in Fig 2.
A. Previous System
[image:1.612.329.552.226.376.2]Fig 1: The Previous Methods for measuring Level and Ph balance
The proposed system mainly consists of three parts:1) data monitoring,2) autonomous monitoring unit and 3) central processing units. The WSN system is thus suitable for the water bodies such as lakes, rivers, dams etc. This topic thus explains an illustrates the designing of a new water monitoring system. The system explains the auto-monitoring of the water level and pH value present in an water body. The requirements on a WSN varies very much, because they are used in many different application areas, e.g. precision agriculture, environmental monitoring, structural health monitoring, industrial applications.
Fig 2: Typical structure of a wireless sensor network.
[image:1.612.336.548.533.624.2]International Journal of Emerging Technology and Advanced Engineering
Website: www.ijetae.com (ISSN 2250-2459,ISO 9001:2008 Certified Journal, Volume 4, Issue 11, November 2014)
512 Such a microcontroller provides a wide range of peripherals that are used for measuring the conversion tasks, e.g. analog to-digital converter (ADC), timer and digital IO. This reduces the amount of components needed and also the hardware costs. The main requirement of the system is very low power consumption.
The motes are generally powered by batteries or energy harvesting systems (EHS) or both. But Batteries have to be replaced after a certain time , hence, the lifespan of a battery is limited. EHS uses energy harvesting devices (EHDs), e.g. solar cells or thermo generators, to harvest energy from the environment. If the EHS is well designed, it is possible to power the mote continuously. However, both solutions need a low power consumption of the mote. The needed processing power and the maximum allowed power consumption lead to a trade-off between these requirements. However, the specific requirements depend on the application area. The mote should be adapted to that application area. Thus, this trade off can be optimized and the needed performance can be achieved by a minimum power consumption. The pic24FJ64GA002 microcontroller supports all these requirements. There are many different models with different peripherals. It also supports different power modes which can be used to minimize the overall power consumption. This topic shows the development of a mote for river monitoring using a pic24FJ64GA002 microcontroller. The mote is supplied by solar cells and ultra capacitors are used to store the energy for the night. The hardware is adapted to the given application area in order to get the best system performance and to reduce costs.
[image:2.612.329.562.242.447.2]B. The Proposed System
Fig 3: The proposed system
The fig 3 shows the proposed system of the topic, which consists of different checkpoints where the nodes are situated and the control structure where the control unit is located. The data is transferred from over all the respective nodes denoted as check point and it is monitored and controlled continuously at the control unit. Using this system will eliminate the manual errors and will provide the accurate values at the control unit.
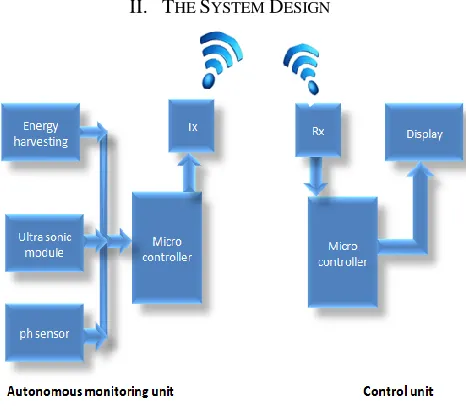
[image:2.612.50.273.520.653.2]II. THE SYSTEM DESIGN
Fig 4: System Block Diagram.
A. Autonomous Monitoring unit
1. Energy Harvesting System
The energy consumption is done using the Energy Harvesting System. The energy is consumed by using the solar panels, then this energy is stored using the Ultra capacitors. Energy is converted using voltage converter and then this voltage is given as input voltage for the microcontroller. Initially from the unpowered state, the primary energy storage element is disconnected from the system using the battery protection circuit. The energy harvester alone charges the capacitor, which is later used to supply energy for the power-on reset. A supply voltage will monitor and regulate the power supply to the embedded system to minimize its power consumption while the capacitor is charging[10].
International Journal of Emerging Technology and Advanced Engineering
Website: www.ijetae.com (ISSN 2250-2459,ISO 9001:2008 Certified Journal, Volume 4, Issue 11, November 2014)
513 The supply monitor has a programmable delay that provides additional time for the capacitor to charge before
enabling power to theembedded system. When the voltage
regulator is enabled the capacitor is discharged into the embedded system and allows it to complete its power-on reset[10].
[image:3.612.328.567.147.253.2]Once the battery charger detects sufficient voltage on the input capacitor, it reconnects the energy storage element to the system, and the energy harvesting system functions in full operation, similar to a swinging pendulum. The voltage is given to the microcontroller[10].
[image:3.612.53.281.278.435.2]Fig 5: Block Diagram of Energy Harvesting System .
Table 1
Solar Panel Characteristics
Model Power Weight(kg)
Pmax Vmp Imp
# of cells
SLP005-06U
5W
6V 0.75 5W 8.6V 0.58A
18 (2x9)
2. Ultrasonic module
For the water level monitoring Ultrasonic module WL705 are used they transmit waves to the surface under water then this wave strikes the surface and it is then reflected and thus we can calculate the level of water. The result is calculated by measuring the time difference between transmitted wave and the received wave. This information is given to the PIC microcontroller and the data is transmitted to the control unit.
Water Level= Transmitted Wave – Received Wave
Fig 6: Mounting of the ultrasonic sensor
3. Ph Sensor
For checking the water quality pH sensor PHE 45P are used they check the presence of hydrogen moles present in water level and then the pH quality is checked. The information is given to the PIC microcontroller and is then transmitted to the control unit.
The data sensed by the sensors is given to the Microcontroller circuit this data is transformed into the WSN nodes using 2.4GHz 802.15.4 transceiver module.
B. Control Unit
The data transmitted from the AMU is then received by control unit using 2.4GHz 802.15.4 transceiver module and this data is displayed on PC using VB software in the form of database.At the receiver side we actually get all the data collected by the Water level sensor and the pH sensor at the duration of every 15 min of the microcontroller timer.
Thus the monitoring is done continuously and efficiently.
III. INTERNAL CIRCUITRY OF THE SYSTEM
1) Energy Harvesting System
[image:3.612.329.570.504.677.2]International Journal of Emerging Technology and Advanced Engineering
Website: www.ijetae.com (ISSN 2250-2459,ISO 9001:2008 Certified Journal, Volume 4, Issue 11, November 2014)
[image:4.612.329.562.125.544.2]514 2) Ultrasonic Module
Fig 8: Circuit Diagram of the Ultrasonic Module.
[image:4.612.85.247.157.260.2]3) Ph Sensor
Fig 9: Circuit Diagram of Ph Module
IV. EXPERIMENTATION RESULT
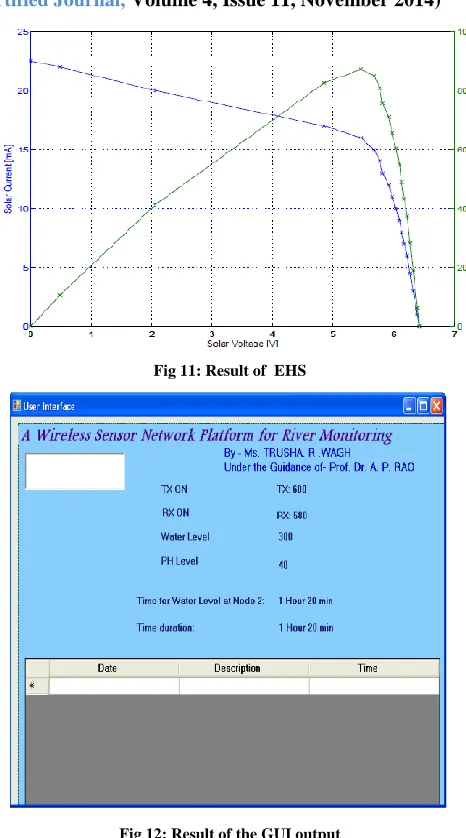
Fig 10: Result of the ultrasonic module
Fig 11: Result of EHS
Fig 12: Result of the GUI output
V. CONCLUSION
[image:4.612.48.301.395.623.2]International Journal of Emerging Technology and Advanced Engineering
Website: www.ijetae.com (ISSN 2250-2459,ISO 9001:2008 Certified Journal, Volume 4, Issue 11, November 2014)
515 REFERENCES
[1] GEORGE T.KARETSOS,THEODORE KOTSILIERIS “A MOBILE AGENT ENABLED WIRELESS SENSOR NETWORK FOR RIVER WATER MONITORING” THE FOURTH INTERNATIONAL CONFERENCE ON
WIRELESS AND MOBILE COMMUNICATIONS IEEE PP 346-351,2008
[2] Peng Jiang , Hongbo Xia , Zhiye He and Zheming Wang“Design of
a Water Environment Monitoring System Based on Wireless Sensor Networks” Sensors, vol.9, pp-6411-6434, 2009.
[3] Jo Ueyama ,Danny Hughes, Ka Lok Man ,Sheng-Uei Guan
“Applying a Multi-Paradigm Approach to Implementing Wireless Sensor Network Based River Monitoring” First ACIS International Symposium on Cryptography, and Network Security vol. 978-0-7695-4332-1/10 pp. 187-191, 2010.
[4] Philipp Maria Glatz, Leander Bernd Hörmann, Christian Steger,
Reinhold Weiss “Designing Perpetual Energy Harvesting Systems explained with River Mote: A Wireless Sensor Network Platform for River Monitoring” EJSE Special Issue: Wireless Sensor Networks and Practical Applications pp. 55-65,2010.
[5] Abdulrahman Alkandari, Meshal alnasheet, Yousef Alabduljader,
Samer M. Moein “Wireless Sensor Network (WSN) for Water Monitoring System: Case Study of Kuwait Beaches” The Society of Digital Information and Wireless Communications, pp. 709-717 2011.
[6] Sabuj Das Gupta, Islam Md. Shahinur, Akond Anisul Haque, Amin
Ruhul, Sudip Majumder “ Design and Implementation of Water Depth Measurement and Object Detection Model Using Ultrasonic Signal System” International Journal of Engineering Research and Development Volume 4, Issue 3), PP. 62-69, October 2012.
[7] Leander B. H¨ormann, Philipp M. Glatz, Christian Steger, Reinhold
Weiss “A Wireless Sensor Node For River Monitoring Using Msp430 R And Energy Harvesting” 2011 .
[8] Panom Petchjatuporn, Wiwat Kiranon, Anatawat Kunakorn “A
Solar-powered Battery Charger with Neural Network Maximum Power Point Tracking Implemented on a Low-Cost PIC-microcontroller” Faculty of Engineering, Mahanakorn University of Technology vol. 2394-525-778-185-8 2012.
[9] Lívia C. Degrossi, Guilherme G. do Amaral, Eduardo S. M. de
Vasconcelos “Using Wireless Sensor Networks in the Sensor Web for Flood Monitoring in Brazil” Proceedings of the 10th International ISCRAM Conference – Baden-Baden, Germany, pp 458-462 2013.
[10]
Http://www.silabs.com/technicaldocs/implementing-energy-harvesting- in- embedded systems-designs.pdf