International Journal of Emerging Technology and Advanced Engineering
Website: www.ijetae.com (ISSN 2250-2459,ISO 9001:2008 Certified Journal, Volume 5, Issue 10, October 2015)
8
Optimal Under-frequency Load Shedding using Cuckoo Search
with Levy Flight Algorithm for Frequency Stability
Improvement
Mwaniki C
1, Muriithi C. M
2, Abungu N. O
3, Nyakoe G. N
41,4Department of Electrical & Electronic Engineering, Jomo Kenyyatta University of Agriculture and Technology, Kenya. 2Department of Electrical & Electronic Engineering, Technical University of Kenya, Kenya.
3
Department of Electrical & Electronic Engineering, University of Nairobi, Kenya.
Abstract— Frequency stability in a power system is very important as it determines the synchronous speed of electrical machines. Therefore it should remain within acceptable limits even when the system is disturbed. In order to ensure that frequency stability is achieved, load shedding is a countermeasure taken as a last resort. However, its consequences might result in huge technical and economic losses. Therefore, this control measure should be optimally and carefully carried out. This paper proposes Cuckoo search with Levy flights (CSwLF) based algorithm for solving the optimal load shedding problem. The amount of load shedding at each bus is determined by applying CSwLF to solve a nonlinear optimization problem formulated in the optimal power flow framework. The performance of the proposed CSwLF based method is tested on the operating conditions of IEEE 14-bus test system. The results shows that load shedding can be done discriminately in a single step to bring back a system from danger of frequency instability
Keywords—Metaheuristic algorithm, Frequency stability, under voltage load shedding, cuckoo search, Levy flights..
I. INTRODUCTION
Under-Frequency load shedding (UFLS) is defined as a coordinated act of controls, which results in the decrease of electrical loads in the power system. This act of possible corrective actions aims at forcing the perturbed system to a new equilibrium state (balancing the load and generation and thus maintaining system frequency within nominal range)
A power system will begin to deteriorate if there is an excess of load over available generation. The prime movers and their associated generators begin to slow down as they attempt to carry the excess load. Tie lines to other parts of the power system, attempt to supply the excess load. This combination of events can cause the tie lines to open from overload or the various parts of the systems to separate due to power swings and resulting instability. The result may be one or more electrically isolated islands in which load may exceed the available generation [1].
Further, the drop in frequency may endanger generation itself. While a hydro-electric plant is relatively unaffected by even a ten percent reduction in frequency, a thermal generating plant is quite sensitive to even a five percent reduction. Power output of a thermal plant depends to a great extent on its motor driven auxiliaries such as boiler feed water pumps, coal pulverizing and feeding equipment, and draft fans. As system frequency decreases, the power output to the auxiliaries begins to fall off rapidly which in turn further reduces the energy input to the turbine generator. The situation thus has a cascading effect with a loss of frequency leading to a loss of power which can cause the frequency to deteriorate further and the entire plant is soon in serious trouble. An additional major concern is the possible damage to the steam turbines due to prolonged operation at reduced frequency during this severe overload condition.
The objective of an under-frequency load shedding is to quickly recognize generation deficiency within any system and automatically shed a minimum amount of load, and at the same time provide a quick, smooth and safe transition of the system from emergency situation to a post-emergency condition such that a generation-load balance is achieved and nominal system frequency is restored
II. CUCKOO SEARCH ALGORITHM WITH LEVY FLIGHTS
A few metaheuritic optimization techniques have been proposed to solve load shedding problem. These includes Genetic Algorithm (GA) and Particle swarm optimisation (PSO) [2],[3]. A new metaheuristic search algorithm, called cuckoo search (CS), based on cuckoo bird’s behavior has been developed by Yang and Deb [4]. However, the new stochastic search method, (CS), has not been applied to steady and dynamic state load shedding problem yet. This paper aims at establishing the applicability of this algorithm into load shedding.
International Journal of Emerging Technology and Advanced Engineering
Website: www.ijetae.com (ISSN 2250-2459,ISO 9001:2008 Certified Journal, Volume 5, Issue 10, October 2015)
9
Female cuckoos from some species of can imitate the patterns of the eggs of a few chosen host birds. This decreases the possibility of the eggs being abandoned and, therefore, increases their re-productivity [5]. If host birds discover the eggs are not their own, they will either throw them away or simply abandon their nests and build new ones, elsewhere. Parasitic cuckoo chooses a nest where the host bird just laid its own eggs and since the cuckoo eggs hatch slightly earlier than their host eggs, the first instinct action of the first cuckoo chick hatched is to evict the host eggs. This behaviour results in increasing the cuckoo chick’s share of food provided by its host bird. In addition, Moreover, cuckoo chick can imitate the call of host chicks to gain access to more feeding opportunity [6],[7]. .
The Cuckoo Search models such breeding behavior. Yang and Deb discovered that the performance of the CS can be improved by using Lévy Flights instead of simple random walk. The variance of Levy flight increases exponentially as compared with random walk whose variance increases linearly. Therefore the convergence is faster with where step size is generated using Levy flights. Levy flights are more efficient in exploring unknown large scale search space [8], [9].
A solution is represented by an egg in the nest. A new solution is represented by a cuckoo egg. The CS endeavors to replace not-so-good solutions in the nests by the new and potentially better solutions represented by cuckoo’s eggs. In the simplest form, each nest has one egg. The CS is based on three rules:
• Each cuckoo randomly lays one egg at a time in a nest; • The best nest with high quality of eggs (solutions) will carry over to the next generations;
• The number of available host nests is fixed, and a host
can discover an alien egg with probability . In
this case, the host bird can either throw the egg away or abandon the nest to build a completely new nest in a new location [9]. The last assumption can be approximated by a fraction pa of the n nests being replaced by new nests, having new random solutions. Based on the above-mentioned rules, the basic steps of the CS can be summarized as the pseudo code, as follows [9],[10].
Levy flights are random walk whose step length is drawn from the Levy distribution, often in terms of simple power-law formula.
When generating new solutions for the ith
cuckoo, the following Lévy flight is performed
where is the step size.
The product means entry-wise multiplications [9].
The generation of random numbers with Levy Flights consists of two steps: the choice of random direction which should be drawn from uniform distribution and generation of steps which obey Levy distribution. The generation of these steps is achieved using Mantegna algorithm for a symmetric Levy distribution. Here symmetric that the steps can be positive and negative. [10]. In Mantegna’s algorithm, the step length s can be calculated by
Where and are drawn from normal distribution. That is
Where
International Journal of Emerging Technology and Advanced Engineering
Website: www.ijetae.com (ISSN 2250-2459,ISO 9001:2008 Certified Journal, Volume 5, Issue 10, October 2015)
10
The fitness of the solutions is determined and the best solution is found. The worst solutions are discarded and replaced with new ones and the fitness of the new set is again determined.
The best solution is again found. The fitness of this best solution is checked to see whether it is within the acceptable tolerance. If it’s not, the process starts over again
III. PROBLEM FORMULATION
During the UFLS, the following consideration need to be done:
Facilities which are essential from a safety standpoint
are not shed.
The amount of load to be shed from the buses should
correspond to the importance of that bus.
The total amount of load shed should be the minimum
possible, but sufficient to avoid the minimum allowable frequency being overcome.
This scenario is therefore formulated as an optimization problem with nonlinear constraints as follows: This scenario is therefore formulated as an optimization problem with nonlinear constraints as follows:
This equation can be written as
Where
are the importance factors for curtailed active power
load of the bus.
Equality Constraints
Where:
and are active and reactive power generations at the
ith bus.
and , are system bus voltages magnitudes and phase
angles.
International Journal of Emerging Technology and Advanced Engineering
Website: www.ijetae.com (ISSN 2250-2459,ISO 9001:2008 Certified Journal, Volume 5, Issue 10, October 2015)
11
Assuming that the increasing or decreasing of the active power generation of all generators was limited to 20% of their current generation, then:
Assuming that all the buses have the same importance factor of 1, then:
(10)
IV. METHODOLOGY
The IEEE 14-bus system was selected for the study. The data for the system is readily available. The power flow analysis was first carried out using the Newton Raphson power flow technique to establish the loading levels of various transmission lines in the system. The main idea in this step is establish the heavily loaded line whose loss is likely to affect the performance of the entire system. This analysis was carried out using Power system Analysis Toolbox (PSAT). PSAT is a Matlab toolbox for static and dynamic analysis and control of electric power systems
A MATLAB code was developed to simulate loss of a transmission line through opening of circuit breaker
associated to that line at time , immediately
capture this post contingency system status and pass it to the Cuckoo Search with Levy Flight algorithm to determine how much load need to be shed considering various constraints and finally simulate the load shedding.
After the algorithm determines the optimal load that need to be shed, the load shedding is simulated through opening of circuit breaker at time t=16.75s. This is the time the frequency drops to the minimum allowable value of 49.7 Hz or 0.994 p.u. The system status and parameters were again captured after the load had been shed to determine the effect of the load shedding.
V. RESULTS ANALYSIS
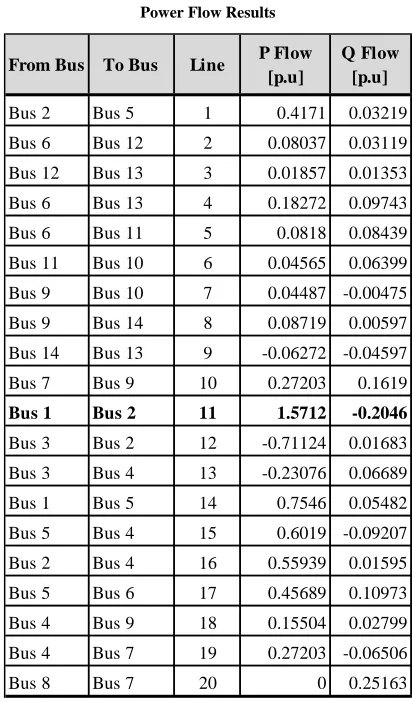
[image:4.612.340.546.141.492.2]Table I shows the results obtained from power flow. Line 11 connected between Bus 1 and Bus 2 was the most heavily loaded line and its loss would be significant to the performance and equilibrium of the system. It’s for this reason that this line was chosen for investigation.
Table I Power Flow Results
Bus 2 Bus 5 1 0.4171 0.03219
Bus 6 Bus 12 2 0.08037 0.03119
Bus 12 Bus 13 3 0.01857 0.01353
Bus 6 Bus 13 4 0.18272 0.09743
Bus 6 Bus 11 5 0.0818 0.08439
Bus 11 Bus 10 6 0.04565 0.06399
Bus 9 Bus 10 7 0.04487 -0.00475
Bus 9 Bus 14 8 0.08719 0.00597
Bus 14 Bus 13 9 -0.06272 -0.04597
Bus 7 Bus 9 10 0.27203 0.1619
Bus 1 Bus 2 11 1.5712 -0.2046
Bus 3 Bus 2 12 -0.71124 0.01683
Bus 3 Bus 4 13 -0.23076 0.06689
Bus 1 Bus 5 14 0.7546 0.05482
Bus 5 Bus 4 15 0.6019 -0.09207
Bus 2 Bus 4 16 0.55939 0.01595
Bus 5 Bus 6 17 0.45689 0.10973
Bus 4 Bus 9 18 0.15504 0.02799
Bus 4 Bus 7 19 0.27203 -0.06506
Bus 8 Bus 7 20 0 0.25163
From Bus To Bus Line P Flow [p.u]
Q Flow [p.u]
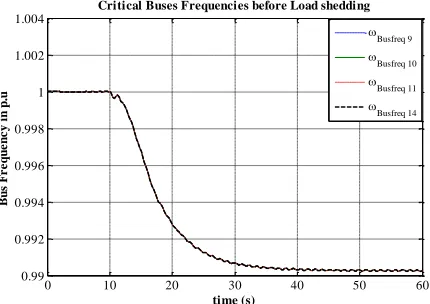
Figure 1 shows the frequencies of the most critical buses when line 11 was lost at t=10s. The figure shows that the frequencies in those buses fell below 49.7 Hz or 0.994 p.u. at time t=16.7s. This implies that the load shedding should occur not later than that time.
International Journal of Emerging Technology and Advanced Engineering
Website: www.ijetae.com (ISSN 2250-2459,ISO 9001:2008 Certified Journal, Volume 5, Issue 10, October 2015)
12
0 10 20 30 40 50 60
0.99 0.992 0.994 0.996 0.998 1 1.002 1.004 time (s) B u s F r e q u e n c y i n p .u
Critical Buses Frequencies before Load shedding
[image:5.612.330.545.133.296.2] Busfreq 9 Busfreq 10 Busfreq 11 Busfreq 14
[image:5.612.56.271.136.288.2] [image:5.612.331.546.324.486.2]Figure 1Critical Buses frequencies before load shedding
Table II:
Amount of Load to be Shed from Each Bus
Bus No.
Bus
Voltage Load Demand Load to Shed
(p.u) MW Mvar MW (p.u)
Mvar (p.u)
1 1.06 0 0 0 0
2 1.05 0.217 0.127 0.0401 0
3 1.01 0.942 0.19 0 0
4 1.01 0.478 0.04 0.0019 0
5 1.02 0.076 0.016 0.0094 0
6 1.07 0.112 0.075 0.0293 0
7 1.05 0 0 0 0
8 1.09 0 0 0 0
9 1.03 0.295 0.166 0 0
10 1.03 0.09 0.058 0.045 0
11 1.05 0.035 0.018 0.0097 0
12 1.05 0.061 0.016 0.0259 0
13 1.05 0.135 0.058 0.0579 0
14 1.02 0.149 0.05 0.0636 0
TOTAL 2.59 0.814 0.2828 0
0 10 20 30 40 50 60
0.995 0.996 0.997 0.998 0.999 1 1.001 time (s) F r e q u e n c y i n p .u
Critical Buses Frequencies after Shedding Load Indiscriminately
Busfreq 9 Busfreq 10 Busfreq 11 Busfreq 14
Figure 2 Critical Buses frequencies after load shedding without discrimination
0 10 20 30 40 50 60
0.995 0.996 0.997 0.998 0.999 1 1.001 1.002 1.003 time (s) F r e q u e n c y i n p .u
Critical Buses Frequencies after Load Shedding
Busfreq 9 Busfreq 10 Busfreq 11 Busfreq 14
[image:5.612.54.284.325.657.2]Figure 3 Critical Buses frequencies after load shedding with discrimination
Figure 2 shows that after an amount of 0.2828 p.u active load was shed at time t=16.75s, the frequency was restored back to acceptable limit. The frequency value did not go back to original value but to new value of 0.9999 p.u This is the new equilibrium state that the systems has taken after the contingency occurred. The load shedding was done in a single step as compared to traditional methods where load shedding is done in steps.
[image:5.612.53.283.335.660.2]International Journal of Emerging Technology and Advanced Engineering
Website: www.ijetae.com (ISSN 2250-2459,ISO 9001:2008 Certified Journal, Volume 5, Issue 10, October 2015)
[image:6.612.82.531.158.414.2]13
Table III
Active Load Shed from Buses with Equal Importance Factor of 0.5
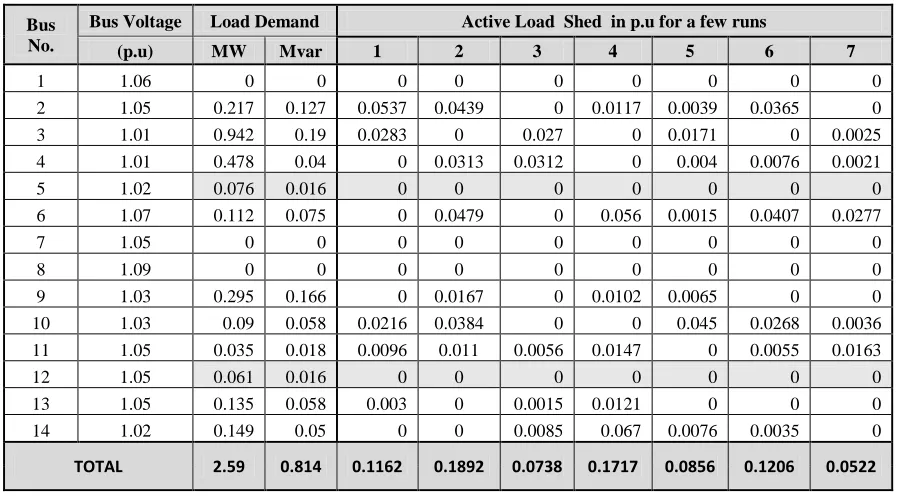
Table IV
Active Load Shed from Buses with Unequal Importance Factor
Bus No.
Bus Voltage Load Demand Active Load Shed in p.u for a few runs
(p.u) MW Mvar 1 2 3 4 5 6 7
1 1.06 0 0 0 0 0 0 0 0 0
2 1.05 0.217 0.127 0.0537 0.0439 0 0.0117 0.0039 0.0365 0
3 1.01 0.942 0.19 0.0283 0 0.027 0 0.0171 0 0.0025
4 1.01 0.478 0.04 0 0.0313 0.0312 0 0.004 0.0076 0.0021
5 1.02 0.076 0.016 0 0 0 0 0 0 0
6 1.07 0.112 0.075 0 0.0479 0 0.056 0.0015 0.0407 0.0277
7 1.05 0 0 0 0 0 0 0 0 0
8 1.09 0 0 0 0 0 0 0 0 0
9 1.03 0.295 0.166 0 0.0167 0 0.0102 0.0065 0 0
10 1.03 0.09 0.058 0.0216 0.0384 0 0 0.045 0.0268 0.0036
11 1.05 0.035 0.018 0.0096 0.011 0.0056 0.0147 0 0.0055 0.0163
12 1.05 0.061 0.016 0 0 0 0 0 0 0
13 1.05 0.135 0.058 0.003 0 0.0015 0.0121 0 0 0
14 1.02 0.149 0.05 0 0 0.0085 0.067 0.0076 0.0035 0
TOTAL 2.59 0.814 0.1162 0.1892 0.0738 0.1717 0.0856 0.1206 0.0522
Bus No.
Bus Voltage Load Demand Active Load Shed in p.u for a few runs
(p.u) MW Mvar 1 2 3 4 5 6 7
1 1.06 0 0 0 0 0 0 0 0 0
2 1.05 0.217 0.127 0.035 0.0593 0.0095 0.0259 0.0028 0 0.0035
3 1.01 0.942 0.19 0 0 0 0 0.0261 0.0095 0.0157
4 1.01 0.478 0.04 0.0036 0 0 0.0033 0.0118 0 0.0712
5 1.02 0.076 0.016 0.0241 0.0282 0.0092 0.038 0.0237 0.0373 0.038
6 1.07 0.112 0.075 0.0345 0.056 0.0182 0.056 0.0525 0.002 0.0318
7 1.05 0 0 0 0 0 0 0 0 0
8 1.09 0 0 0 0 0 0 0 0 0
9 1.03 0.295 0.166 0 0 0.0083 0.0038 0 0.0242 0.0179
10 1.03 0.09 0.058 0.045 0 0.0055 0.0446 0 0.0449 0.0007
11 1.05 0.035 0.018 0.0163 0 0.0119 0.0171 0.0175 0.0014 0.0057
12 1.05 0.061 0.016 0.0185 0.0209 0.0036 0.0131 0.0251 0.0072 0.0304
13 1.05 0.135 0.058 0 0.0128 0.0325 0.0203 0.0212 0.0559 0
1.02 0.149 0.05 0 0 0.0038 0.0403 0.0319 0 0.0614
[image:6.612.82.531.440.688.2]International Journal of Emerging Technology and Advanced Engineering
Website: www.ijetae.com (ISSN 2250-2459,ISO 9001:2008 Certified Journal, Volume 5, Issue 10, October 2015)
14
Table III shows the amount of load shed from the buses for several runs with all buses treated equally i.e with equal importance factor of 0.5. No load was shed from buses 1, 7 and 8 since no load is connected to those buses.
Table IV shows the amount of load shed from the buses for several runs with the buses treated differently. The importance factor ranges from 0 to 1 with 1 being the least important and 0 being the most important. Therefore buses 5 and 12 were assigned importance factor of 0. With Buses 5 and Buses 12 being treated as very important, no load was shed from these buses. This means that the load shedding was done discriminately depending on the importance factor of the bus.
VI. CONCLUSION
The above results shows that load shedding using Cuckoo search with Levy flights can be done in a single step to bring back a system from danger of frequency instability. It also shows that it is possible to spare very
important facilities from disconnection without
compromising on system stability
REFERENCES
[1] A.J. Wood, B.F. Wollenberg, Power generation, Operation and Control, 2nd edition, New York, John Wiley & Sons, 1996.
[2] Ahmad Reza Malekpour, ―Application of Constriction Factor Particle Swarm Optimization to Optimum Load Shedding in Power System‖, Modern Applied Science Vol. 4, No. 7; July 2010 [3] Olamaei, T. Niknam & G. Gharehpetian ―Application of particle
swarm optimization for distribution feeder reconfiguration considering distributed generators‖, Electric Power Systems Research, Applied Mathematics and Computation, 2008.
[4] Yang, X. S., 2010. Engineering Optimization: An Introduction with Metaheuristic Applications, John Wiley and Sons.
[5] Yang, X. S., and Deb, S. Engineering Optimization by Cuckoo Search, Int. J. of Mathematical Modelling and Numerical Optimization, Vol. 1, No. 4, 2010, pp. 330– 343.
[6] Milan Tuba, Milos Subotic, Nadezda Stanarevic: Modified cuckoo search algorithm for unconstrained optimization problems, Proceedings of the European Computing Conference (ECC ’11), pp. 263-268, Paris, France, April 2011
[7] Payne R B, Sorenson M D, Klitz K (2005), The cuckoos. Oxford University Press.
[8] Ehsan Valian, Shahram Mohanna and Saeed Tavakoli, ―Improved Cuckoo Search Algorithm for Global Optimization‖ InternationaL Journal of Communications and Information Technology, IJCIT, Vol.1-No.1 Dec. 2011
[9] Yang XS, Deb S (2010) Engineering Optimization by Cuckoo Search, Int. J. Mathematical Modelling and Numerical Optimization, 1(4):330–343.