R E S E A R C H
Open Access
Combining creatinine and volume kinetics
identifies missed cases of acute kidney injury
following cardiac arrest
John W Pickering
1*, Azrina Md Ralib
1and Zoltán H Endre
1,2Abstract
Introduction:Fluid resuscitation in the critically ill often results in a positive fluid balance, potentially diluting the serum creatinine concentration and delaying diagnosis of acute kidney injury (AKI).
Methods:Dilution during AKI was quantified by combining creatinine and volume kinetics to account for fluid type, and rates of fluid infusion and urine output. The model was refined using simulated patients receiving crystalloids or colloids under four glomerular filtration rate (GFR) change scenarios and then applied to a cohort of critically ill patients following cardiac arrest.
Results:The creatinine concentration decreased during six hours of fluid infusion at 1 litre-per-hour in simulated patients, irrespective of fluid type or extent of change in GFR (from 0% to 67% reduction). This delayed diagnosis of AKI by 2 to 9 hours. Crystalloids reduced creatinine concentration by 11 to 19% whereas colloids reduced concentration by 36 to 43%. The greatest reduction was at the end of the infusion period. Fluid dilution alone could not explain the rapid reduction of plasma creatinine concentration observed in 39 of 49 patients after cardiac arrest. Additional loss of creatinine production could account for those changes. AKI was suggested in six patients demonstrating little change in creatinine, since a 52 ± 13% reduction in GFR was required after
accounting for fluid dilution and reduced creatinine production. Increased injury biomarkers within a few hours of cardiac arrest, including urinary cystatin C and plasma and urinary Neutrophil-Gelatinase-Associated-Lipocalin (biomarker-positive, creatinine-negative patients) also indicated AKI in these patients.
Conclusions:Creatinine and volume kinetics combined to quantify GFR loss, even in the absence of an increase in creatinine. The model improved disease severity estimation, and demonstrated that diagnostic delays due to dilution are minimally affected by fluid type. Creatinine sampling should be delayed at least one hour following a large fluid bolus to avoid dilution. Unchanged plasma creatinine post cardiac arrest signifies renal injury and loss of function.
Trial registration:Australian and New Zealand Clinical Trials Registry ACTRN12610001012066.
Introduction
Resuscitation of intravascular volume of critically ill patients is essential for hemodynamic support [1-3]. Accurate estimates of kidney function remain elusive in the absence of real-time measurement of the glomerular filtration rate (GFR). Plasma creatinine remains the default surrogate biomarker of GFR [4-6]. Dilution of
plasma creatinine by fluid loading [7] is usually not con-sidered. However, if fluid resuscitation dilutes plasma creatinine, the incidence of acute kidney injury (AKI) may be under-reported, diagnosis and intervention delayed, and GFR overestimated.
Creatinine kinetic modeling and back-calculating base-line creatinine from presumed GFR have evaluated AKI definitions [5,8,9], identified creatinine-based outcome metrics for clinical trials [10], quantified the effect of cal-culated baseline creatinine on AKI epidemiology [11-13], and compared methods of normalizing urinary injury * Correspondence: [email protected]
1
Christchurch Kidney Research Group, Department of Medicine, University of Otago, P.O. Box 4345, Christchurch 8140, New Zealand
Full list of author information is available at the end of the article
biomarkers [14,15]. None of these models incorporates the dilution effect of fluid loading on plasma creatinine con-centration, nor do they allow for dynamic changes in crea-tinine generation.
Volume kinetic modeling is used to simulate the distri-bution and clearance of infused fluids [16]. It has been used to investigate the differences in distribution of col-loids and crystalcol-loids in volunteers, the influence of anesthesia and surgery on clearance [17,18], and patient response to crystalloid infusion (for example, in women with pre-eclampsia) [19].
We developed a model that combined volume and crea-tinine kinetics. The model was first applied to simulated patients to assess the extent of plasma creatinine concen-tration change due to fluid loading and its effect on AKI diagnosis. We then used the model to assess the changes in renal function and creatinine generation in a cohort of 49 cardiac arrest patients. The limitations of the model were further assessed by a detailed examination in three patients.
Materials and methods
A compartment creatinine kinetic model and a two-compartment volume kinetic model were combined into a volume-creatinine kinetic model. The initial conditions of the model were assessed in a simulated patient. The model was then tested in a cohort of patients resuscitated after cardiac surgery. Three patients were presented as case studies. Data collection was approved by the Upper South A Regional ethics committee of New Zealand (URA/09/09/062). Screening on entry to the emergency department (ED) was by presumptive consent, followed by written consent from the patient or family.
Creatinine kinetics
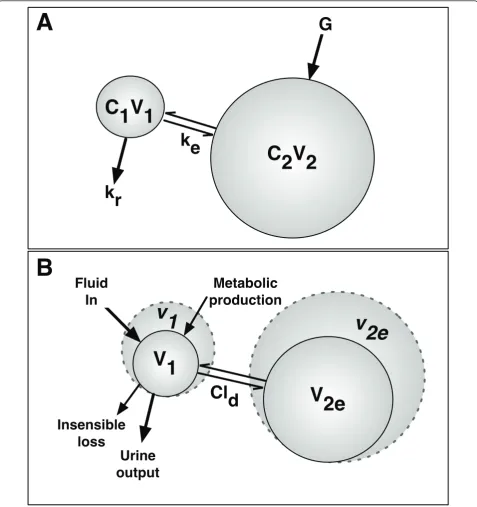
The creatinine kinetic model is shown in Figure 1a. Creati-nine generated in muscle cells enters the extravascular compartment (V2) at a rateĠ, is freely exchanged with the
plasma compartment (V1), and is eliminated by the kidney
at a rate determined by the rate constant,kr(note:GFR= krV10). We used dot notation for differentiation (for
exam-ple, G˙ =dG
dt) and a subscript‘0’to represent the value of
the variable at time zero.
Given that the total volume of distribution of creati-nine (V1 +V2) is equal to the total body water, the
extravascular volume is equal to the total body water minus the plasma volume; it is assumed that creatinine is not bound and flows freely from one compartment with the same permeability as water. The rate of change of mass in each compartment was determined by mass balance (Table 1). Because creatinine was not bound,
the rate of exchange between compartments (ke) was
the same in both directions. Conditions at equilibrium, where there is zero rate of change of creatinine, creati-nine production, and compartment volumes, were used to ascertain initial conditions for kr andkd(see
Addi-tional file 1 containing extended methods).
Volume kinetics
Volume kinetics simulates the distribution and elimi-nation of infused fluids and usually involves two
com-partments: one approximates the plasma volume (V10
prior to expansion) and the other approximates the expandable component of the interstitial fluid space (Vt0 prior to expansion) [16] (Figure 1b). V2e0 is
smal-ler than the interstitial space because expansion of body fluids is not possible in all regions (for example, in the skeleton) [16]. As fluid is infused into the vascu-lature, the plasma compartment volume will expand at a rate dependent on the rate of infusion (Ḃ), metabolic production (Ṁ), insensible loss (İ), urine output (U˙), and exchange between compartments. The rate of exchange between compartments depends on the dis-tribution clearance (Cld) and the relative differences in
the expansion of the two volumes (Table 1). We assume that water can flow freely in both directions between compartments [16] and that there is no signif-icant loss to a third space.
Combined creatinine kinetic and volume kinetic model
The creatinine and volume kinetic models were combined assuming that creatinine kinetic plasma compartment and volume kinetic plasma volume were the same [16]. The extravascular creatinine compartment volume (V2) is equal
to the sum of the expandable (v2e) and non-expandable
(V2n0) fluid volumes: V2 = v2e + V2n0; therefore,
˙
V2=V2˙ e.V2n0 equals the difference between the initial
extravascular and expandable interstitial space volumes (V2n0 = V20 - V2e0). The model was programmed in
Matlab (Matlab 2011b; MathWorks Inc., Natick, MA, USA) and solved numerically with the ordinary differential equation solverode45. Extended methods are presented in Additional file 1.
The simulated patient
Effect of fluid loading and differential rates of urine output
Urine output
The rate of urine output depends on hydration status. In someone with normal kidney function, extreme hyper-tonic dehydration (loss of 10% of total body water)
results in approximately a 70% reduction in urine output [22,23], whereas overhydration will produce a rapid increase in urine output, peaking at approximately 900 mL/hour. These initial conditions were used to develop
kr
C2V2
ke
G
Insensible
loss
Metabolic
production
Urine
output
V2e
Cld
V1
v
2e
v
1
Fluid
In
A
B
[image:3.595.59.537.89.597.2]C1V1
a formula to describe change in urine output (Additional file 1). Failure of reabsorption results in polyuric AKI, which was not modeled.
Fluid input
Two fluid input scenarios were modeled: (a) maintenance fluid alone and (b) maintenance + boluses of either crystal-loids or colcrystal-loids of 1 L per hour for 6 hours beginning at the end of hour one. This represents a high fluid input and corresponded to the 80th percentile of the fluid input over the course of the first 6 hours of the patients in the cardiac arrest cohort. For each fluid input scenario, there were four GFR scenarios: no change in GFR and a decrease by one third, one half, or two thirds at the time of insult (t = 1 hour). These correspond to GFR criteria for RIFLE AKI severity stages R (Risk), I (Injury), and F (Failure). On the basis of creatinine kinetic modeling alone, these produce creatinine increases of 50%, 100%, and 200%, respectively [9].
The crystalloid distribution exchange rate (Cld) was set
at 200 mL/minute. This was based on multiple studies with Ringer’s lactate (Table S3 in Additional file 1). Colloids have much longer half-lives in the vasculature
[1,24,25] and correspondingly smaller distribution exchange rates.Cldfor colloids was set at 10 mL/minute.
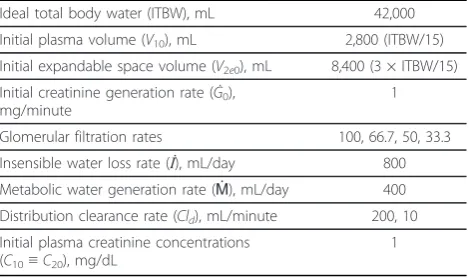
Metabolic water production was assumed to be 400 mL/ day (16.7 mL/hour), and insensible losses 800 mL/day (33.4 mL/hour). At a GFR of 100 mL/minute followed by 99% reabsorption, urine output was 1 mL/minute (60 mL/hour). Therefore, maintenance fluid was set at 76.7 mL/hour(maintenance =U˙ + (˙I− ˙M)).
Sensitivity analysis
The sensitivity of the model was assessed for differences in
Cld(50, 100, 300, and 400 mL/minute compared with 200
mL control), the difference between insensible loss and metabolic water production (0 and 800 mL compared with 400 mL control), the ratio of the plasma volume to volume of expandable interstitial space (1:2 and 1:4 ratios compared with 1:3 control), and a loss or gain of creati-nine production for the duration of the illness (30%).
Patient cohort
Patients admitted following cardiac arrest were a subco-hort from the Early Detection of Acute Kidney Injury (EDAKI) study conducted in the ED and intensive care unit of Christchurch Hospital (Christchurch, New Zeal-and). Ethics approval was obtained from the Upper South A Regional Ethics Committee (URA/09/09/062), and informed consent was obtained from patients or relatives.
After ICU admission, each patient immediately under-went therapeutic hypothermia for 24 hours (core tem-perature reduced to 33°C). The resuscitation fluid was 0.9% saline in each case prior to arrival at the ED. Hourly urine output and fluid input were recorded for each patient. Plasma samples were collected on admission to the ED, on admission to the ICU, and at least daily there-after. Urine samples for measurement of neutrophil gela-tinase-associated lipocalin (NGAL), cystatin C, alkaline phosphatase (ALP), gamma-glutamyltranspeptidase (GGT), anda- andπ-glutahione-S-transferase (a- and
π-GST) were taken on catheterization in the ED, on
admission to the ICU, and 4, 8, and 16 hours later and daily.
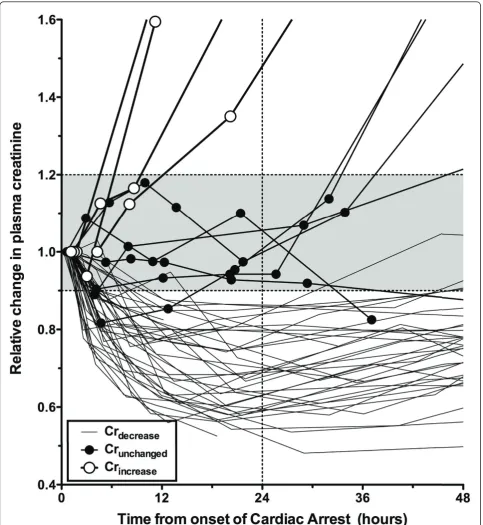
To assist assessment, patients were divided into three groups: Crincrease(a plasma creatinine increase of more
than 20% at 24 hours after cardiac arrest), Crdecrease
(a plasma creatinine decrease of more than 10% at 24 hours), and Crunchanged(neither Crincreasenor Crdecrease).
The first male enrolled in each group was selected as a case study:
[image:4.595.57.291.99.224.2]Patient A was a 90-kg male with a history of hyper-trophic obstructive cardiomyopathy and with severely impaired left ventricular function (ejection fraction of 25%). He had presented to the ED, complaining of abdominal pain, nausea, and vomiting. His condition deteriorated, requiring intubation, during which time he
Table 1 Creatinine and volume kinetic components
Compartment Rate of change of mass/volume
Gain Losses
Creatinine 1 C1V1˙ +C1V1˙ keC2V2 keC1V1+
krC1V1
Creatinine 2 C2V2˙ +C2V2˙ Ġ+keC1V1 keC2V2
Plasma, 1 V1˙ Ḃ+Ṁ ˙I+U˙ +V2˙ e
Expandable, 2e V2˙ e Cld
(v1−v10)
v10
Cld
(v2e−v2e0) v2e0
Note: dot notation was used for differentiation (for example,C˙=dC
dt).C1and C2, creatinine concentrations for compartments 1 and 2, respectively.vcand
vt, time-varying volumes;V1andV2, creatinine volumes for compartments 1 and 2, respectively.V10andV2e0, time zero compartment volumes.
Table 2 Simulated virtual-in-patient demographics
Ideal total body water (ITBW), mL 42,000
Initial plasma volume (V10), mL 2,800 (ITBW/15)
Initial expandable space volume (V2e0), mL 8,400 (3 × ITBW/15)
Initial creatinine generation rate (Ġ0), mg/minute
1
Glomerular filtration rates 100, 66.7, 50, 33.3
Insensible water loss rate (İ), mL/day 800
Metabolic water generation rate (Ṁ), mL/day 400
Distribution clearance rate (Cld), mL/minute 200, 10
Initial plasma creatinine concentrations (C10≡C20), mg/dL
[image:4.595.57.292.582.721.2]suffered a cardiac arrest followed by cardiopulmonary resuscitation (CPR). He was defibrillated twice (at 360 J), and adrenaline was given. After 50 minutes, he regained cardiac output and was transferred to the ICU. Over the next 4 days, his cardiopulmonary status improved stea-dily; however, presumably owing to hypoxic brain injury, there was no neurological recovery. Therapy was with-drawn and he died.
Patient B was an 87-kg male with a history of alcohol-ism. He collapsed during a shower. Resuscitation time was 20 minutes with marginal CPR. He received 1.5 L of normal saline in the ED and 1 L in the first two hours in the ICU. Prognosis was assessed as poor after rewarming. Multiple fluid boluses were given, but the patient became oliguric and died 53 hours after arrest.
Patient C was an 80-kg male with no medical history. He suffered a cardiac arrest during a motor vehicle inspection. Immediate CPR was performed by a nurse bystander before the arrival of paramedics. Resuscitation lasted 27 minutes with defibrillation (once) and two adre-naline boluses. An electrocardiograph showed an infero-lateral myocardial infarct, and the patient underwent emergency percutaneous coronary intervention with a stent inserted to repair the left circumflex artery, which was completely occluded. He was transferred to the ICU for cooling. There were several occasions of bradycardia needing boluses of atropine and later adrenaline infusion. After rewarming, his condition improved and he was extubated. He was discharged to a coronary care unit on day 3. Model application to the cardiac arrest patients used the measured urine output from each patient rather than the simulated urine output of the simulated patient.
Results
Model application in simulated patients
Glomerular filtration rate maintained
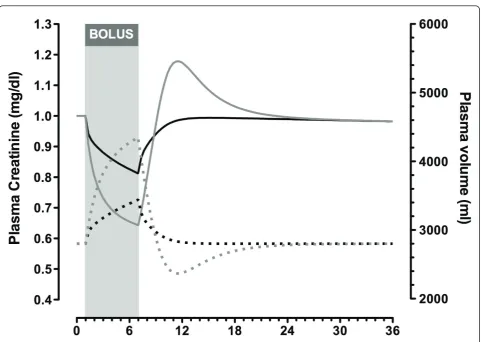
Creatinine concentration decreased as fluid was infused, and plasma volume increased while GFR was held constant (Figure 2). The minimum concentration at the end of the infusion was 19% below the starting concentration for the crystalloid infusion and 36% below for the colloid infusion. The concentration returned to normal within about 6 hours after crystalloid infusion but took an additional approximately 10 hours after colloid infusion. Colloid infu-sion produced an increase in creatinine concentration above baseline from 2 to approximately 16 hours following infusion. During this period, renal elimination of excess body water occurred at a rate greater than the flow of water from the extravascular space into the plasma, result-ing in a brief decrease in plasma volume. Urine output peaked at 825 mL/hour at the end of the fluid bolus, at which time the simulated patient was 5.7% overhydrated. It required a further 6 hours before urine output decreased below 100 mL/hour.
Glomerular filtration rate decreased
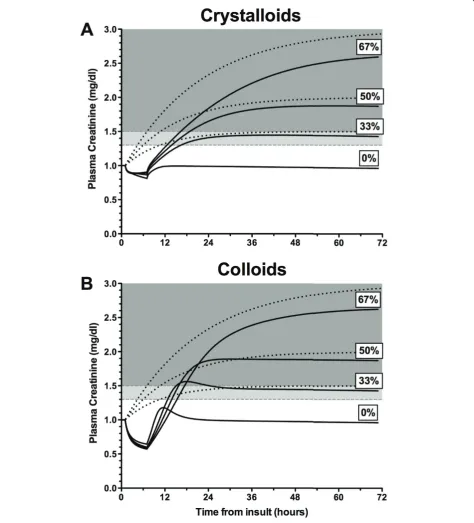
Even with concomitant loss of GFR, there was a reduction in plasma creatinine during fluid infusion. This reduction was similar irrespective of the degree of GFR decrease. After fluid administration, the increase in creatinine was smaller than expected in AKI based on creatinine kinetic modeling alone (Figure 3), except for a brief period follow-ing colloid infusion when there was a transient increase in creatinine above that predicted by creatinine kinetics alone. Diagnosis of AKI was delayed by 2 to 9 hours by administration of fluids, depending on the extent of loss of GFR and type of fluid administered.
Sensitivity analysis
A sensitivity analysis of input variables was performed for patients receiving 6 L of crystalloid the course of 6 hours with no change in GFR. The model was insensitive to dif-ferences in the rate of water distribution, ranging from 50 to 400 mL/minute, with a maximum difference in plasma creatinine concentration of 8.9%. The model was even less sensitive to a ± 400 mL/day difference between insensible loss and metabolic water production, with a maximum dif-ference of 4.7%. Similarly, the model was insensitive to variations in the ratio of the plasma to expandable space (V10toVe0), with maximum differences in creatinine
con-centration from the 1:3V10toVe0ratio of -5.5% (1:2 ratio)
and 3.6% (1:4). A decrease of 30% in creatinine generation maintained for 72 hours led to a 30% decrease in plasma concentration (Additional file 1).
Model application to patients after cardiac arrest
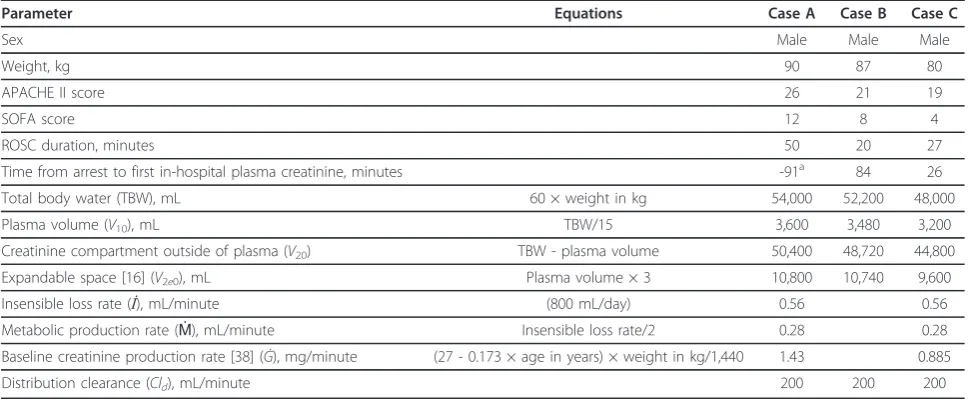
Forty-nine patients were enrolled on entry to the ED. Patient demographics and initial parameters are shown in Table 3 for all 49 patients and in Table 4 with addi-tional model parameters for the three case studies. Three main patterns of change in creatinine concentra-tion were observed during the first 24 hours: a rapid increase (Crincrease:n= 4), little change (Crunchanged:n=
6), or a rapid decrease (Crdecrease: n = 39) (Figure 4).
Crincreasepatients were all designated as clinical AKI by
the Acute Kidney Injury Network (AKIN) definition (> 0.3 mg/dL increase in plasma creatinine within
48 hours). The Crunchanged group showed fluctuations
between a 20% increase and a 10% decrease in creati-nine relative to the initial ED concentration. Patients had a relative reduction of 14% to 47% (median 32%,
IQR 21% to 39%) within 24 hours. In the Crdecrease
group, the plasma cystatin C concentrations also had a relative reduction of 6% to 41% (median 37%, IQR 28% to 43%), and urinary creatinine concentrations were low or rapidly decreased. All in the Crincrease, 5 of 6 Crunchanged,
and 36 of 39 Crdecreasegroups had urine outputs of less
Creatinine decrease (Crdecrease)
Applying the volume-creatinine kinetic model while assuming no loss of GFR showed that dilution could explain 43% (IQR 26% to 67%) of the maximum reduction in creatinine concentration in the Crdecreasepatients within
the first 24 hours. The remaining reduction in creatinine concentration may be explained and modeled as a loss of creatinine production (Figure 5) or an increase in GFR assuming patients had AKI on admission.
Creatinine unchanged (Crunchanged)
Over the course of the first 24 hours, a mean 52% (stan-dard deviation 13%) decrease in GFR was required to account for the lack of reduction in plasma creatinine taking into account fluid input and urine output and assuming a loss of creatinine production the same as the median loss for the Crdecreasecohort (Figure 5b). Multiple
injury biomarkers were increased in the Crunchanged
patients: plasma NGAL (P< 0.01), urinary NGAL (P< 0.01), and urinary cystatin C (P< 0.01) compared with the Crdecreasecohort (Figure 6). All 10 of the Crincreaseor
Crunchangedpatients died within 30 days, whereas 13 of
the 39 Crdecreasepatients died (P< 0.0001).
Case studies
Case A: Crincrease
AKI was detected 11 hours 46 minutes after cardiac arrest (plasma creatinine of 1.36 mg/dL compared with 0.67 mg/dL on admission). Plasma NGAL was elevated in the first sample 1:49 hours after arrest (286 ng/mL).
Urinary NGAL (2,990 ng/mL), GGT (613 U/L),π-GST
(38μg/L), and albumin (2,900 mg/L) were elevated in the first urine sample (6:59 hours after arrest). The patient was oliguric (urine output of less than 0.5 mL/kg per hour) for 19 hours from 3 hours after arrest (AKIN stage 2) and had a 3-hour period of anuria from 29 hours.
[image:6.595.58.540.84.426.2]the median loss of creatinine determined from the Cr de-crease patients (Figure 5b), the best-fit GFR showed an
initial greater loss of GFR (90%). A short rapid rise in crea-tinine at the end of the observation period was due to a brief period of polyuria shortly prior to death (Figure 7b).
Case B: Crunchanged
Plasma creatinine remained static for the first 24 hours before doubling prior to death. Urinary biomarkers were all elevated in the ED sample and increased, reaching a maximum 5 hours after arrest: NGAL 1,016 ng/mL,
cystatin C 3.0 mg/L, GGT 1,050 U/L, a-GST 34 μg/L,
and π-GST 143 μg/L. Plasma NGAL was also elevated
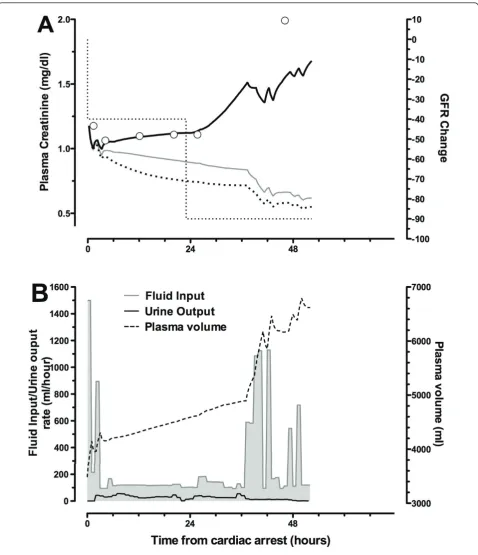
in the first sample: 302 ng/mL. Urine output varied between 20 and 60 mL/hour during the first 18 hours. The patient then showed periods of oliguria during the ensuing 35 hours prior to death, despite large fluid boluses.
During the first 24 hours, the retained fluid should have resulted in a decrease in creatinine concentration (grey line, Figure 8a). If creatinine production had also decreased, this would have increased the expected reduction in creatinine concentration (dotted line, Figure 8a). Failure to observe this reduction could be accounted for by a GFR decrease of 40% during this period. A further reduction after 24 hours accounted for the rapid increase in plasma creatinine.
Case C: Crdecrease
[image:8.595.57.291.100.433.2]The patient received three boluses of normal saline in the ED (totaling 1,600 mL) and four small boluses (250 to 450 mL) each hour for the first 4 hours in the ICU. Plasma creatinine decreased more rapidly than can be explained by dilution (Figure 9a). Urinary creatinine decreased from 15.2 mmol/L 50 minutes after arrest to
Table 3 Cardiac arrest patient demographics (n= 49)
Demographic Value
Male 38 (78)
Age, years 61 (16)
Weight, kg 80 (13)
APACHE II score 20 (4.4)
SOFA score 8.1 (2.3)
Sepsis 4 (8)
Mechanical ventilation 49 (100)
Cooling 46 (94)
Emergency PCI 15 (31)
ROSC duration, minutes 20 (12.5-30)
DC shock, number 3 (1-5)
Adrenaline, mg 1 (0-3)
First plasma sample
B-type natriutetic peptide, pg/mL 64 (19-194)
Creatinine kinase, U/L 365 (185-920)
Troponin,μg/L 0.05 (0.03-0.175)
Creatinine, mg/dL 1.21 (1.11-1.37)
Cystatin C, mg/L 0.93 (0.77-1.11)
Urea, mmol/L 6.6 (5.4-7.8)
Outcomes
Renal replacement therapy 3 (6)
Death 23 (47%)
ICU LOS, hours 66 (48-103)
Hospital LOS, days 8.7 (3.9-14)
[image:8.595.56.542.514.715.2]Data are presented as number (percentage), mean (standard deviation), or median (lower quartile to upper quartile). APACHE II, Acute Physiology and Chronic Health Evaluation II; DC, Direct Current; ICU, intensive care unit; LOS, length of stay; PCI, percutaneous coronary intervention; ROSC, return of spontaneous circulation; SOFA, Sequential Organ Failure Assessment.
Table 4 Demographic and model parameters applied to case studies
Parameter Equations Case A Case B Case C
Sex Male Male Male
Weight, kg 90 87 80
APACHE II score 26 21 19
SOFA score 12 8 4
ROSC duration, minutes 50 20 27
Time from arrest to first in-hospital plasma creatinine, minutes -91a 84 26
Total body water (TBW), mL 60 × weight in kg 54,000 52,200 48,000
Plasma volume (V10), mL TBW/15 3,600 3,480 3,200
Creatinine compartment outside of plasma (V20) TBW - plasma volume 50,400 48,720 44,800
Expandable space [16] (V2e0), mL Plasma volume × 3 10,800 10,740 9,600
Insensible loss rate (İ), mL/minute (800 mL/day) 0.56 0.56
Metabolic production rate (Ṁ), mL/minute Insensible loss rate/2 0.28 0.28
Baseline creatinine production rate [38] (Ġ), mg/minute (27 - 0.173 × age in years) × weight in kg/1,440 1.43 0.885
Distribution clearance (Cld), mL/minute 200 200 200
a
Figure 6Kidney injury biomarkers associated with Crincreaseand Crunchangedgroups. Urinary and plasma neutrophil gelatinase-associated lipocalin (NGAL) (P< 0.0001) and urinary cystatin C (P= 0.0017) showed an increasing trend, and both Crunchangedand Crincreasewere
3.1 mmol/L 3:40 hours later. It did not recover to the ear-lier level until 42 hours after arrest. Injury biomarkers appeared briefly elevated in the first ED sample (NGAL
347 ng/mL, cystatin C 0.54 mg/L, GGT 900 U/L,a-GST
3,800μg/L, andπ-GST 56μg/L) but rapidly returned to normal ranges by the first ICU sample 95 minutes later.
Discussion
The combined volume and creatinine kinetic model clearly demonstrates that fluid resuscitation leads to an underestimation of plasma creatinine concentration and AKI severity or alternatively to diagnostic delay or fail-ure to detect AKI. This strongly supports the use of an adjusted creatinine on the basis of fluid balance, as sug-gested by Macedo and colleagues [26]. The model shows that the extent to which plasma creatinine was underestimated depended on the rate of fluid infusion, the type of fluid (crystalloid or colloid), the timing of the plasma creatinine sample in relation to the timing of fluid infusion, and the rate at which excess fluid was excreted by the urine. The type of fluid minimally affected diagnosis delay in the scenario of 6 L of fluid given over the course of 6 hours.
AKI severity was underestimated because of fluid loading. Even a stage 3 decrease in GFR (a decrease by two thirds [9] by the RIFLE classification) failed to result in an increase in plasma creatinine during infusion in the simulated patient. The decrease in plasma creatinine concentration was substantial (approximately 20% for crystalloids and approximately 40% for colloids) irre-spective of AKI severity. The rapid reduction in plasma creatinine during fluid boluses suggests that care must be taken in the timing of plasma sampling. If the bolus is large, sampling should be delayed at least 1 hour.
The majority of cardiac arrest patients demonstrated a creatinine concentration reduction that was greater than could be explained by dilution alone. We hypothesized that creatinine production ceased temporarily because shock brings a temporary halt to all metabolic processes. This could also explain a reduction in plasma cystatin C. The relative extent of change of creatinine and cystatin C depends on the differences in their volumes of distribu-tion. The clinical consequences were that reliance on plasma creatinine underestimated the severity of AKI in the 5% of patients in whom AKI was detected (Crincrease),
and failed to classify another 8% (Crunchanged) as having
AKI. As identified by Prowle and colleagues [27], who demonstrated that many cases of oliguria in the ICU are not associated with increased creatinine, 41 of the 44 patients not classified as AKI by plasma creatinine in this study developed oliguria during the first 48 hours. Injury biomarkers confirmed that in Crunchangedthere had been
substantial renal injury despite an apparently normal plasma creatinine throughout the first 24 hours. These
patients illustrate the new category of creatinine-negative, biomarker-positive AKI [28].
A possible explanation for poorer outcomes in patients with AKI when nephrology consultation is delayed is that continuing excess fluid administration results in creatinine dilution leading to an underestimation of the severity of the loss of renal function [29]. In a retrospective analysis of 253 patients with AKI, Macedo and colleagues [26] adjusted for creatinine dilution by multiplying the absolute creatinine by the proportional increase in total body water measured by the daily cumulative fluid balance. In 64 patients (25%), the adjusted creatinine reached the thresh-old for AKI (50% increase) at least one day earlier than the unadjusted creatinine. While clearly useful, this approach does not take into account the dynamic creatinine kinetics reported in this study, particularly with respect to timing of sampling and the reduction in creatinine excretion rate with increased dilution. In a prospective study, it was shown that nephrology intervention within 18 hours trig-gered by a plasma creatinine rise of 0.3 mg/dL reduced the subsequent peak creatinine concentration compared with standard practice [30]. Unfortunately, the absence of fluid data makes it difficult to decide whether this outcome resulted from the potential therapeutic effect of fluid load-ing or from dilution of the creatinine concentration [31]. Several goal-directed therapy trials under way may help to determine the therapeutic effect of fluid loading (see ClinicalTrials.gov registered trials NCT00510835, NCT00975793, NCT00306059, and NCT01654003).
In an ICU setting, the cost of adjusting for fluid balance and creatinine kinetics is minimal given that urine output is normally recorded and creatinine regularly sampled. For most of the Crdecreasepatients, creatinine
concentra-tion decreased within 4 hours. We suggest that if plasma creatinine has not decreased after 4 hours in clinical practice, kidney injury biomarker(s) be measured. This obviates the expense of screening all patients and is prob-ably within a clinically meaningful time frame with respect to early intervention.
survivors than non-survivors both at AKI diagnosis and at peak creatinine in the study by Bouchard and collea-gues [4]. Duration of fluid overload (> 10% fluid accumu-lation) was also associated with increased mortality. It was noted that patients with fluid overload had lower urine output and plasma creatinine at AKI diagnosis. Thus, a possible contributing cause to both of these find-ings is that patients with fluid overload on diagnosis of AKI had, on average, a greater loss of GFR than those without but that this was masked by dilution of plasma creatinine.
Limitations
Because several parameters were not measureable in the case studies, the model relied on several assumptions. The distribution clearance was approximated to be 200 mL/minute, an expandable interstitial volume was assumed to be three times the plasma volume, and meta-bolic water production was assumed to be half that of the insensible losses (at 800 mL/day). The model was not sensitive to these parameters. We are unaware of any experimental or clinical studies that have measured rapid changes in creatinine production following cardiac arrest. There is experimental, but as yet no clinical, evidence that creatinine production may fall in sepsis by as much as 30% [34]. It is possible that, rather than a change in production, metabolic changes that prevent creatinine moving between compartments may be responsible for the phenomena observed. However, it should be noted that our definition of Crdecreaseis simply a pattern
recog-nition based on decreasing creatinine. The modeled change in GFR in each patient may be modified if they had loss of renal function as might be expected after a sudden loss of renal perfusion following cardiac arrest.
The model did not take into account potential increased capillary permeability, which is known to occur in sepsis and possibly during therapeutic hypothermia. Capillary leakage may reduce plasma volume; however, colloids (albumin) have been shown in patients with sepsis to increase the interstitial and plasma volumes more than the volume of infused fluids, possibly because of movement of fluid from the intracel-lular compartment [35]. On the other hand, resuscita-tion with cold fluids (crystalloids) appears to cause hypovolemia despite a positive fluid balance [36,37]. All of the case study patients underwent therapeutic hypothermia; none was septic. If increased capillary per-meability had resulted in hypovolemia, the plasma con-centrations would have been artificially elevated. We restricted analysis to cardiac arrests in order to mini-mize heterogeneity. Further study is required to see whether the results are generalizable to other forms of shock.
Conclusions
The model accounts for fluid input and urine output and helps avoid misdiagnosis of AKI and AKI severity. Creati-nine and volume kinetics were combined to quantify dynamic changes in GFR in the critically ill, providing insight into disease progression. The model enabled diag-nosis of AKI in a cohort of cardiac arrest patients despite maintenance of a normal plasma creatinine concentra-tion. This highlights that plasma creatinine alone cannot be relied upon to diagnose AKI after cardiac arrest and suggests caution in interpreting AKI epidemiology and trials that rely solely on plasma creatinine to define out-comes. This suggests that injury biomarkers are essential for identifying AKI in some clinical scenarios. Volume kinetic modeling could also enhance our understanding of the effects of fluid loading as a mediator of poor clini-cal outcomes [3] by quantifying the effects of fluid load-ing on different compartments.
Key messages
•Dilution delays acute kidney injury (AKI) diagnosis.
•Avoid measurement of serum creatinine for 1 hour
after a fluid bolus.
•AKI after cardiac arrest may be missed by relying on serum creatinine.
•A stable creatinine after cardiac arrest indicates AKI.
•Injury biomarkers are essential for identifying AKI in some scenarios.
Additional material
Additional file 1: Extended methods and sensitivity analysis. Details of the mathematical formulation of the combined creatinine and volume kinetic model. Sensitivity analysis of the model input variables: the rate of water distribution, the difference between insensible loss and metabolic water production, variations in the ratio of the plasma to expandable space, and creatinine generation.
Abbreviations
AKI: acute kidney injury; ALP: alkaline phosphatase; Crdecrease: group of patients with a plasma creatinine decrease of more than 10% at 24 hours after cardiac arrest; Crincrease: group of patients with a plasma creatinine increase of more than 20% at 24 hours after cardiac arrest; Crunchanged: group of patients not Crdecreaseor Crincrease; ED: emergency department; GFR: glomerular filtration rate; GGT: gamma-glutamyltranspeptidase; GST: glutahione-S-transferase; ICU: intensive care unit; NGAL: neutrophil gelatinase-associated lipocalin; PCI: percutaneous coronary intervention; RIFLE: Risk, Injury, Failure, Loss, and End-stage kidney disease; ROSC: return of spontaneous circulation.
Creatinine kinetic model: C1: creatinine concentration in the plasma compartment; C2: creatinine concentration in the extracellular compartment; Ġ: creatinine generation rate; ke: rate constant for diffusion of creatinine to the plasma compartment from the extravascular compartment and vice versa (per minute); kr: rate constant for renal excretion of creatinine from the plasma (per minute); V1: volume of the plasma compartment; V2: volume of the extracellular compartment.
output rate;v1,v2e: expanded compartment volumes; V10: volume of the plasma compartment at time zero; V2e0: volume of the expandable compartment at time zero; V2n0: volume of the non-expandable compartment (constant).
Authors’contributions
JWP conceived of, developed, and wrote the program for the model; co-designed the Early Detection of Acute Kidney Injury (EDAKI) study and carried out the data analysis and interpretation; and led the manuscript writing. AMdR collected the EDAKI data and participated in data interpretation and manuscript approval. ZHE participated in model development, co-designed the EDAKI study (principal investigator), and participated in data interpretation, manuscript writing, and approval. All authors read and approved the final manuscript.
Competing interests
The authors declare that they have no competing interests.
Acknowledgements
JWP was supported by a Marsden Foundation New Zealand government grant administered by the Royal Society of New Zealand and a University of Otago Research Grant. AMdR was supported by a Malaysian Government Scholarship. Lottery Health New Zealand funded the EDAKI study from which the cardiac arrest cohort was drawn. We thank Argutus Medical Ltd (Dublin, Ireland) for assaying fora- andπ-GST, Abbott Diagnostics (Chicago, IL, USA) for providing kits for urine NGAL measurements, and Alere Inc. (Waltham, MA, USA) for providing The Triage®NGAL Test for plasma NGAL. We thank Jill Robinson, Jan Mehrtens, and the staff of Christchurch Hospital ED, ICU, and Canterbury Health Laboratories for sample collection and assay. We are grateful to Robert Hahn for several informative discussions.
Author details
1Christchurch Kidney Research Group, Department of Medicine, University of Otago, P.O. Box 4345, Christchurch 8140, New Zealand.2Prince of Wales Hospital and Clinical School, University of New South Wales, High Street, Randwick, Sydney NSW 2031, Australia.
Received: 25 September 2012 Revised: 5 November 2012 Accepted: 9 January 2013 Published: 17 January 2013
References
1. Ragaller MJ, Theilen H, Koch T:Volume replacement in critically ill patients with acute renal failure.J Am Soc Nephrol2001,12(Suppl 17): S33-39.
2. Prowle JR, Echeverri JE, Ligabo EV, Ronco C, Bellomo R:Fluid balance and acute kidney injury.Nat Rev Nephrol2010,6:107-115.
3. Mehta RL, Bouchard J:Controversies in acute kidney injury: effects of fluid overload on outcome.Contrib Nephrol2011,174:200-211. 4. Bouchard J, Soroko SB, Chertow GM, Himmelfarb J, Ikizler TA, Paganini EP,
Mehta RL:Fluid accumulation, survival and recovery of kidney function in critically ill patients with acute kidney injury.Kidney Int2009, 76:422-427.
5. Solomon RJ, Segal A:Defining acute kidney injury: what is the most appropriate metric?Nat Clin Pract Nephrol2008,4:208-215. 6. Endre ZH, Pickering JW, Walker RJ:Clearance and beyond: the
complementary roles of GFR measurement and injury biomarkers in acute kidney injury (AKI).Am J Physiol-Renal2011,301:F697-707. 7. Bouchard J, Mehta RL:Fluid accumulation and acute kidney injury:
consequence or cause.Curr Opin Crit Care2009,15:509-513.
8. Waikar SS, Bonventre JV:Creatinine kinetics and the definition of acute kidney injury.J Am Soc Nephrol2009,20:672-679.
9. Pickering JW, Endre ZH:GFR shot by RIFLE: errors in staging acute kidney injury.Lancet2009,373:1318-1319.
10. Pickering JW, Frampton CM, Endre ZH:Evaluation of trial outcomes in acute kidney injury by creatinine modeling.Clin J Am Soc Nephro2009, 4:1705-1715.
11. Bagshaw SM, Uchino S, Cruz DN, Bellomo R, Morimatsu H, Morgera S, Schetz M, Tan I, Bouman C, Macedo E, Gibney N, Tolwani A, Oudemans-van Straaten HM, Ronco C, Kellum JA, Beginning and Ending Supportive Therapy for the Kidney (BEST Kidney) Investigators:A comparison of observed versus estimated baseline creatinine for determination of
RIFLE class in patients with acute kidney injury.Nephrol Dial Transpl2009, 24:2739-2744.
12. Siew ED, Matheny ME, Ikizler TA, Lewis JB, Miller RA, Waitman LR, Go AS, Parikh CR, Peterson JF:Commonly used surrogates for baseline renal function affect the classification and prognosis of acute kidney injury. Kidney Int2010,77:536-542.
13. Pickering JW, Endre ZH:Back-calculating baseline creatinine with MDRD misclassifies acute kidney injury in the intensive care unit.Clin J Am Soc Nephro2010,5:1165-1173.
14. Waikar SS, Sabbisetti VS, Bonventre JV:Normalization of urinary biomarkers to creatinine during changes in glomerular filtration rate. Kidney Int2010,78:486-494.
15. Ralib AM, Pickering JW, Shaw GM, Devarajan P, Edelstein CL, Bonventre JV, Endre ZH:Test characteristics of urinary biomarkers depend on quantitation method in acute kidney injury.J Am Soc Nephrol2012, 23:322-333.
16. Hahn RG:Volume kinetics for infusion fluids.Anesthesiology2010, 113:470-481.
17. Hahn R, Resby M:Volume kinetics of Ringer’s solution and dextran 3% during induction of spinal anaesthesia for Caesarean section.Can J Anaesth1998,45:443-451.
18. Ewaldsson C, Hahn R:Volume kinetics of Ringer’s solution during induction of spinal and general anaesthesia.Br J Anaesth2001,87:406-414. 19. Drobin D, Hahn RG:Distribution and elimination of crystalloid fluid in
pre-eclampsia.Clin Sci2004,106:307-313.
20. Plank LD, Connolly AB, Hill GL:Sequential changes in the metabolic response in severely septic patients during the first 23 days after the onset of peritonitis.Ann Surg1998,228:146-158.
21. Griffiths R:Muscle mass, survival, and the elderly ICU patient.Nutrition 1996,12:456-458.
22. Coller FA, Maddock WG:A study of dehydration in humans.Ann Surg 1935,102:947-960.
23. McCance RA, Young WF, Black DA:The secretion of urine during dehydration and rehydration.J Physiol1944,102:415-428. 24. Waitzinger J, Bepperling F, Pabst G, Opitz J, Muller M, Baron J:
Pharmacokinetics and tolerability of a new hydroxyethyl starch (HES) specification [HES (130/0.4)] after single-dose infusion of 6% or 10% solutions in healthy volunteers.Clin Drug Invest1998,16:151-160. 25. Wilkes N, Woolf R, Powanda M, Gan T, Machin S, Webb A, Mutch M,
Bennett-Guerrero E, Mythen M:Hydroxyethyl starch in balanced electrolyte solution (Hextend((R)))-pharmacokinetic and
pharmacodynamic profiles in healthy volunteers.Anesth Analg2002, 94:538-544.
26. Macedo E, Bouchard J, Soroko SH, Chertow GM, Himmelfarb J, Ikizler TA, Paganini EP, Mehta RL, Program to Improve Care in Acute Renal Disease Study:Fluid accumulation, recognition and staging of acute kidney injury in critically-ill patients.Crit Care2010,14:R82.
27. Prowle JR, Liu YL, Licari E, Bagshaw SM, Egi M, Haase M, Haase-Fielitz A, Kellum JA, Cruz DN, Ronco C, Tsutsui K, Uchino S, Bellomo R:Oliguria as predictive biomarker of acute kidney injury in critically ill patients.Crit Care2011,15:R172.
28. Haase M, Devarajan P, Haase-Fielitz A, Bellomo R, Cruz DN, Wagener G, Krawczeski CD, Koyner JL, Murray P, Zappitelli M, Goldstein SL, Makris K, Ronco C, Martensson J, Martling C-R, Venge P, Siew E, Ware LB, Ikizler TA, Mertens PR:The outcome of neutrophil gelatinase-associated lipocalin-positive subclinical acute kidney injury a multicenter pooled analysis of prospective studies.J Am Coll Cardiol2011,57:1752-1761.
29. Mehta RL, McDonald B, Gabbai F, Pahl M, Farkas A, Pascual M, Zhuang S, Kaplan R, Chertow G:Nephrology consultation in acute renal failure: Does timing matter?Am J Med2002,113:456-461.
30. Balasubramanian G, Al-Aly Z, Moiz A, Rauchman M, Zhang Z, Gopalakrishnan R, Balasubramanian S, El-Achkar TM:Early nephrologist involvement in hospital-acquired acute kidney injury: a pilot study.Am J Kid Dis2011,57:228-234.
31. Pickering JW, Ralib AM, Endre ZH:Was it the nephrologists or the fluid? Am J Kid Dis2011,58:154.
32. Prowle JR, Chua H-R, Bagshaw SM, Bellomo R:Clinical review: volume of fluid resuscitation and the incidence of acute kidney injury - a systematic review.Crit Care2012,16:230.
balance is associated with a worse outcome in patients with acute renal failure.Crit Care2008,12:R74.
34. Doi K, Yuen PST, Eisner C, Hu X, Leelahavanichkul A, Schnermann J, Star RA: Reduced production of creatinine limits its use as marker of kidney injury in sepsis.J Am Soc Nephrol2009,20:1217-1221.
35. Ernest D, Belzberg AS, Dodek PM:Distribution of normal saline and 5% albumin infusions in septic patients.Crit Care Med1999,27:46-50. 36. Nordmark J, Johansson J, Sandberg D, Granstam S-O, Huzevka T, Covaciu L,
Mortberg E, Rubertsson S:Assessment of intravascular volume by transthoracic echocardiography during therapeutic hypothermia and rewarming in cardiac arrest survivors.Resuscitation2009,80:1234-1239. 37. Heradstveit BE, Guttormsen AB, Langørgen J, Hammersborg S-M,
Wentzel-Larsen T, Fanebust R, Larsson E-M, Heltne J-K:Capillary leakage in post-cardiac arrest survivors during therapeutic hypothermia - a prospective, randomised study.Scand J Trauma Resusc Emerg Med2010,18:29. 38. Bjornsson T:Use of serum creatinine concentrations to determine
renal-function.Clin Pharmacokinet1979,4:200-222.
doi:10.1186/cc11931
Cite this article as:Pickeringet al.:Combining creatinine and volume kinetics identifies missed cases of acute kidney injury following cardiac arrest.Critical Care201317:R7.
Submit your next manuscript to BioMed Central and take full advantage of:
• Convenient online submission
• Thorough peer review
• No space constraints or color figure charges
• Immediate publication on acceptance
• Inclusion in PubMed, CAS, Scopus and Google Scholar
• Research which is freely available for redistribution