© 2017, IRJET | Impact Factor value: 5.181 | ISO 9001:2008 Certified Journal
| Page 2987
Study on Business Intelligence Tools for Enterprise Dashboard
Development
K.Gowthami
1, M.R. Pavan Kumar
21
Student(M.Tech), Dept of CSE, Sree Vidyanikethan Engineering College, Tirupati, India.
2Assistant Professor, Dept. Of CSE, Sree Vidyanikethan Engineering College, Tirupati, India.
---***---Abstract -
This paper presents detailed information onBusiness Intelligence (BI) tools for developing a dashboard in a typical enterprise setup. Few most popular BI tools like SpagoBI, Power BI, Tableau, Qliksense and Jaspersoft are considered based on the ease of use, support in terms of training and minimal initial cost at the end, a sample dashboard has been developed using one of the tools Power BI to demonstrate the feasibility of the same for the Business data visualization.
Key Words: Dashboard, Business Intelligence, Data
Reports, Visualization, Data Analytics.
1.INTRODUCTION
Business Analytic or Business Intelligence (BI) is becoming more needed by the top management of any enterprise to visualize, analyze and prepare the strategic planning for the future. However, the availability of business intelligence tools, the support on the existing infrastructure (including software and hardware), usability, scalability, financial commitment and other parameters make it challenging for the Information Technology team to decide the right BI tool for the organization. This work attempts in easing the decision making process on the Business Intelligence tools, particularly useful for a typical enterprise setup by surveying the top BI tools in the market in terms of cost, scalability, support and other necessary parameters. This paper discusses about the Business Intelligence tools that are available either open source or running on open source with less cost in implementing for a enterprise. This is prepared with an intention of identifying a suitable tool for the data visualization/ dashboard/business intelligence in an enterprise for business and management purpose.
2. SPAGO BI
SpagoBI(Business Intelligence) is part of the SpagoWorld open source initiative tool founded by Italian IT services company Engineering Group.
Developers announced officially SpagoBI is the only “entirely open source” business intelligence suite. The BI suite consists of some 15 components like reporting,
dashboards, OLAP and data mining to charting and ETL. It covers all the analytic areas of Business Intelligence projects, with innovative themes and engines. The SpagoBI server includes an interactive dashboard and integration with other reporting tools.
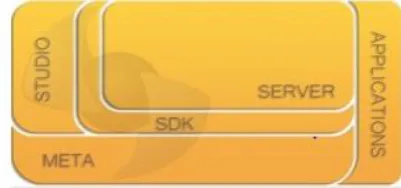
[image:1.595.327.528.321.415.2]SpagoBI mainly consists of the following modules:
Fig 1: SpagoBI Architecture
SpagoBI Server, It includes analytic tools and features act as a core for the suite.
SpagoBI Studio, The integrated development environment
SpagoBI Meta, The meta data environment
SpagoBI SDK(Software Development Kit), It is the integration layer allowing to use SpagoBI with external tools
SpagoBI Applications, Using it a collection of vertical analytic models are developed.
Data can be accessed from the MySQL, Oracle, Postgre or Ingres SQL databases. In addition to the BI product, SpagoWorld includes apps for SOA development, enterprise Java, middle ware and quality measurement.
2.1. Additional Features
1) Fully Open source: Spago has a strong community and forum to support the users and also has a tracker which is used to report the bugs and fix it.
© 2017, IRJET | Impact Factor value: 5.181 | ISO 9001:2008 Certified Journal
| Page 2988
3) Mobile Support: SpagoBI supports mobile interfaceby allowing access through interactive reports, cockpits and dashboards. SpagoBI mobile enables
Role-based document and data access User authentication.
Scheduled analysis. Data update
periodicals and automatic access to identify possible alarms and notifications.
3. POWER BI
Power BI is developed by Microsoft in September 2013 as Power BI for Office 365. Power BI was first released to the general public on July 24, 2015.
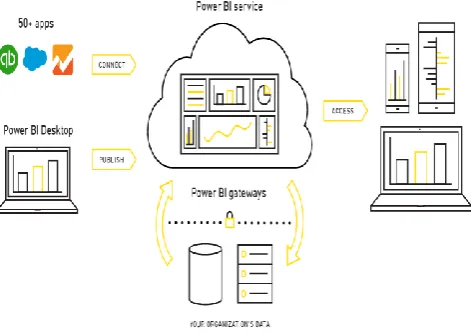
[image:2.595.324.555.128.196.2]Power BI (Business Intelligence) is a cloud based data analysis, From wide range of data sources, which can be used for data analysis and reporting. Power BI is user friendly and simple that power users and business analysts can work with it. Power BI is mature and powerful that can be used by BI developers in enterprise systems for modeling scenarios and complex data mash-up.
Fig 2: Power BI Work flow
3.1. Components
1) Power Query: Power Query is a self-service ETL (Extract, Transform, and Load) tool, runs an Excel add-in. It accepts data from various sources manipulate data into a form and load it into Excel.
2) Power Pivot: Power Pivot is an in-memory data modeling component, which enables extremely fast aggregation and calculation and highly compressed data storage. It is used to create a data model within an Excel workbook. Itself can load data, by Power Query can have data loaded into it. Power Pivot is exactly similar to SSAS
[image:2.595.44.280.415.582.2](SQL Server Analysis Services) Tabular model, which is like a server-based version of Power Pivot.
Fig 3: Power BI Components
3) Power View: Power View is an interactive visualization tool, it provides with drag-and-drop interface to build quick and easy visualizations of the data in their excel workbooks.
4) Power Map: Power Map for Excel is a three-dimensional (3-D) data visualization tool that lets you look at information in new ways. A power map lets you discover insights you might not see in traditional two-dimensional (2-D) tables and charts.
5) Power Q&A: Q&A recognizes the words you enter and figures out where to find the answer. Q&A helps you to form your question with restatement, auto-completion and other textual and visual aids.
6) Power BI Desktop: Power BI desktop puts analytic at your fingertips with intuitive report authoring. Drag-and-Drop to place content exactly where you want it on the flexible and fluid canvas. Quickly discover patterns as you explore a single unified view of linked, interactive visualizations.
3.2. Data Sources
Data is a heart of Power BI. For exploring data, creating charts, dashboards and asking questions with Q&A, all of these visualizations and answers are really getting from data set.
Files.
Content Packs Databases.
3.3. Features
1) Dashboards: Dashboards combine multiple data visualizations in a single interface, easy way to visualize/monitor key performance indicators.
2) Visualizations: New Visualizations include gauges, tree maps, combo charts, funnel charts and fill maps.
3) Connectors for SaaS services: These connectors tap into services including Github, CRM, Sales force, ERP, Marketo, Sendgrid and Zendesk.
© 2017, IRJET | Impact Factor value: 5.181 | ISO 9001:2008 Certified Journal
| Page 2989
5) Power BI Designer: It lets you import, model dataauthor and publish Power BI reports without Excel.
3.4. Benefits
Reports and Pre-built dashboards for SaaS solutions. Real-time dashboard updates.
Live connection to your data sources, secure, on premises and in the cloud.
Using natural language intuitive data exploration. Secure, hybrid connection, fast deployment and
integrated with existing IT systems. Integrated with familiar Microsoft products.
4. TABLEAU
Tableau has been very aggressive in marketing by the most attractive feature of drag and drop products. Anyone can analyze data with Tableau's intuitive drag & drop products. No programming, just insight. Connecting and visualizing your data in minutes, Tableau is 10 to 100x faster than existing solutions are some of the significant features for the business analysts to choose this tool.
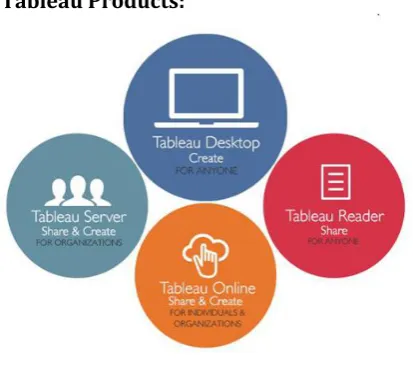
Sharing of the data is made easy through web and mobile. It connects to a wide range of data sources. The dashboards are rich in terms of data visualization and very interactive. Fig 4 shows the versions of Tableau product available for various purposes.
[image:3.595.56.263.495.680.2]4.1. Tableau Products:
Fig 4: Tableau Products
1) Tableau Desktop: This version of Tableau is available in two editions as Professional Edition which supports all data sources and connects to Tableau server for web-based analytics and Personal Edition which supports only Excel, Access and CSV formats of data sources and doesn’t provide any server support. Both of them are priced for commercial purpose and available for academic purpose for one year.
2) Tableau Server: Tableau Server is an online & mobile business intelligence solution. This is used to publish dashboards with Tableau Desktop and share them throughout your organization. IT supports all the same data sources as Tableau Desktop. Also it extends support to all browsers across platforms and devices.
3) Tableau online: Tableau Online is a hosted version of Tableau Server. It is used to publish dashboards with Tableau Desktop and share them with colleagues, partners or customers. With this version, it is easy to find answers in minutes—whenever, wherever you are. It provides storage of 100 Gigabytes for the commercial license.
4) Tableau Public: Tableau Public is for anyone who wants to tell interactive data stories on the web. You’ll be able to connect to data, create interactive data visualizations and publish them directly to your website. This is useful for some who share lots of data online.
5) Tableau Reader: Tableau Reader is a free desktop application that can be used to open and view visualizations built in Tableau Desktop. With Tableau Reader it is possible to open and interact with visualizations built with Tableau Desktop, data included. However, it won’t allow editing or performing any interactions if the author hasn’t built it.
5. JASPERREPORTS
JasperReports is a BI(Business Intelligence) tool and open source reporting engine developed by Jaspersoft in Java language. It mainly consists of several functions include tables, charts, dashboards crosstabs and gauges.
Data sources can be flat files or XML, relational databases and reports can be generated in PDF, HTML, or office suite formats. A single report contains multiple kinds of multiple data sources.
JasperReports is a part of several suites of tools that make up Jaspersoft Business Intelligence suite community edition. There are several tools available for ETL, SOA web services and OLAP.
© 2017, IRJET | Impact Factor value: 5.181 | ISO 9001:2008 Certified Journal
| Page 2990
5.1. Additional Features
1) Training support: The JasperReports has a strong learning sources which includes training (self-paced and instructor lead), scheduled events and webinars, learning material, on-demand webinars and resource centers.
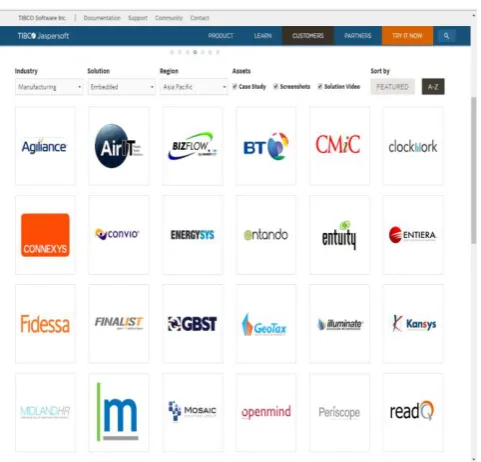
[image:4.595.39.280.240.471.2]2) Cloud Support: The JasperReports suite is available on the cloud to host the services on a license basis. However, for a trial, it provides a cloud based live trial environment with sample data, reports, analysis views and dashboards.
Fig 5: Shows the industrial partners of JasperReports.
6. QLICKSENCE
Qlik Sence is an interactive self-service visualization, discovery tool to analyze, interpet and visualize huge data sources. The drag and drop features of the interface is efficient/good for rapid building of dashboards, reports and data visualization.
6.1. Versions for different users
1) Qlik Sence Desktop: This is for individual users for importing their own data and visualize on a personal computer. It is free to download for personal use. Before going on a large scale, this would be the best choice for analysis.
2) Qlik Sence Enterprise: This version is for enterprises having large data sources with custom visuals.
3) Qlik Sence Cloud: This version supports the cloud hosting of the data analysis and visualization.
[image:4.595.306.553.292.488.2]It provides wide support through forums, training material, webinars and video tutorials.
Fig 6: Qlik Sense desktop
7. COMPARISON AND INFERENCE
© 2017, IRJET | Impact Factor value: 5.181 | ISO 9001:2008 Certified Journal
| Page 2991
Note: A quote is a formal document. It explains your pricing for a order and gives to a customer a clear cost for the workTable -1: Comparison of BI Tools
8. DASHBOARD DEVELOPMENT
In this section, a sample dashboard development has been demonstrated. It shows only a module of the whole dashboard. We have considered showing the visual interpretation of Sample Information in the organization. The dashboard represents different visualizations to present our data in different formats. The data source is from Oracle Database.
We used Power BI Desktop for experimentation because Power BI have advanced features like using Data Connectivity Gateways can access on-premises data, Connect live data sources with full interactivity and Create, view and publish organizational content packs and many more. Also availed the feature of Power BI to demonstrate the availability of Dashboard online.
Fig 7, shows one of the screen shots of data visualization produced in organization. The data source include oracle database and few data from Excel sheets. The front end is built interactive to filter the data Interpretation.
Fig 7: Power BI dashboard
BI Tool License Trail Ease of Use
Training/
Forums Platform Data
Integration Pricing model Price
Power BI Commercial Yes
Easy to install Tutorials Windows
All Free/Monthly
Payment $9.99 Simple to Use Videos Android
Security for data Demo/Webinar Iphone/I pad
Live connections Training and
Document Web based
Qlik Sence Commercial Yes Easy to install and
import data
Tutorials
Windows8 (Not on earlier versions)
All Free/Monthly Payment/One-time payment.
$20 Online Forums
Tableau Commercial Yes Importing data is easier.
Videos
Windows All One-time
payment/Annual subscription
$500 Tutorials
Demos
Jasper Reports Commercial Yes Simple preparation of visualizations
Demos Windows
All Quote based By quote
Tutorials
Android
Web based
SpagoBI Fully Open
source
Full version
Bit tricky
Forums Windows
All Quote based By quote Training and
[image:5.595.307.563.492.734.2]© 2017, IRJET | Impact Factor value: 5.181 | ISO 9001:2008 Certified Journal
| Page 2992
9. CONCLUSION
There are plenty of BI tools available in the market. In this paper, we have considered few potential BI tools that could be used for the purpose of business whereas the preference of this paper was on research on Business Intelligence. With the limited resources and the cost of investment, we explored the tools presented in this paper. However, considering the size of organization and initial cost of investment, it is recommended to go with fully open source or partial open source where the training, deployment and continuous support are provided by the service provider.
10. REFERENCE
[1] Spago BI, a fully open source business intelligence tool
(http://www.spagobi.org/).
[2] Presentations of SpagoBI tools as slides
(http://www.slideshare.net/spagoworld/ ).
[3] Mobile development platform for SpagoBI
(http://www.spagobi.org/homepage/product/mobile/).
[4] Power BI- Business Intelligence and Analytics Tool
(https://powerbi.microsoft.com/en-us/).
[5] Power BI- Guided Learning material
(https://powerbi.microsoft.com/en-us/guided-learning/).
[6] Power BI- Webinars ( https://powerbi.microsoft.com/en-us/documentation/powerbi-webinars/).
[7] Microsoft Power BI Blog
(https://powerbi.microsoft.com/en-us/blog/)
[8] Tableau - Business Intelligence and Analytics tool
(http://www.tableau.com/).
[9] TIBCO Jaspersoft Open Source Business Intelligence
tool “Jaspersoft”(http://www.jaspersoft.com/ ).
[10] Jaspersoft Learning and Training (Webinars/Training)
( https://www.jaspersoft.com/learn).
[11] Jaspersoft Cloud Analytic tool
(http://www.jaspersoft.com/cloud-analytics).
[12] Qliksense a tool for data visualization family