© 2017, IRJET | Impact Factor value: 5.181 | ISO 9001:2008 Certified Journal | Page 1301
Spectrum Sensing with Energy Detection in Cognitive Radio Networks
Milan Patel
1, Kirtan Patel
2, Sagar Patel
31
B.Tech Student, Electronics and Communication, Chandubhai S. Patel Institute of Technology, Gujarat, India
2
B.Tech Student, Electronics and Communication, Chandubhai S. Patel Institute of Technology, Gujarat, India
3
Assi. Professor, Electronics and Communication, Chandubhai S. Patel Institute of Technology, Gujarat, India
---***---Abstract -
Cognitive radio could be a low-pricecommunication system, which might opt for the on the market frequencies and waveforms mechanically on the boundaries of avoiding interrupting the authorized users. The spectrum sensing is that the key modify technology in psychological feature radio networks. It ready to fill area within the wireless spectrum and might dramatically increase spectral potency. The author use matlab to breed the received signals from the psychological feature radio networks associated an energy observe or to detect whether or not the spectrum is being employed. The report additionally parallels the on paper worth and therefore the simulated result so describes the connection between the signal to noise quantitative relation and therefore the detections. At last, the method, energy detection and simulation and result are mentioned that is taken into account because the pointers for the longer term work.
1. INTRODUCTION
1.1
Background
Today with the technology and therefore the science developing the spectrum was nearly totally occupied. But there area until still sizable amount of multiple allocations required producing enough capability for the numerous wireless services for money and non-financial application, like defense, traffic, and scientific exploration.
Fig-1:Spectrum allocations in the US [1]
Figure (1) shows the spectrum allocations within the US. every color stands for a service kind which is allotted to the special band within the US. Several of the first allocations such as TV (TV), FM (FM) radio, international positioning systems (GPS), Wi-Fi, Bluetooth, etc. area unit identical. 2.4 GHz and 5 GHz bands area unit usually used for wireless laptop networking, these bands, and a few others area unit referred to as the economic, scientific, medical (ISM) bands.
[image:1.595.310.561.347.505.2]Fig-2:Received power vs. frequency in Singapore [2]
Fig-3: Band by band average spectrum occupancy in Singapore [2]
[image:1.595.322.558.539.686.2] [image:1.595.48.278.581.734.2]© 2017, IRJET | Impact Factor value: 5.181 | ISO 9001:2008 Certified Journal | Page 1302 to get from the figure that the use of the spectrum is
extremely low in high frequencies and also the utilization of the spectrum in low frequencies is far higher. A survey in [2] shows the common occupancy of the spectrum is 4.54% in Singapore.
Under these things, a way to improve the employment of the spectrum bands could be a matter of nice urgency. The simplest thanks to improve the employment potency of the spectrum allocations is that the psychological cognitive radio (CR) technology, and therefore the definition of CR may be expressed as:
“Cognitive radio is a radio of an intelligent wireless communication system that senses and is aware of its surrounding environment and capable to use or share the spectrum in an opportunistic manner without interfecing the licensed users” [4]
In [5], it's given that in 1999, Joseph Mitola given the concept of CR 1st, in an exceedingly seminar at KTH, The Royal Institute of Technology, then Mitola and Gerald Q. Maguire, J printed CR later in an article. CR has been thought-about as a promising and effective technology to radio technology.
The inefficient mistreatment of allotted spectrum to primary licensed users may be a quite common development, and CR technology has been thought-about as a key answer for that. It permits unauthorized or secondary users WHO square measure referred as CR users to access spectrum bands that are allotted to be licensed. To get the aim of accessing spectrum bands, CR users sense the spectrum so that they will sight the standing through a primary transmitter signal. Thus, spectrum sensing is one in every of the foremost vital problems in CR networks [6].
1.2 Research Aim
The aim of the analysis is to grasp the use of spectrum sensing in psychological cognitive radio networks, and investigate the technique of the spectrum sensing. We’ll use matlab to simulate the signals from the psychological feature radio networks associate degreed an energy detector to see the standing of the first users.
After obtaining the result, try and notice the connection between the issue SNR to and therefore the final detections and investigate however the SNR influence the detections. Comparison the theoretical price and therefore the
measured price to see whether or not the simulation operating with success.
2. THEORY
The Gaussian distribution, Maximum a Posteriori Energy Detection for Spectrum Sensing Additive white Gaussian noise and Q-function are mainly used through the whole process. This part indicates the details of the theories.
2.1 Gaussian Distribution
In applied math, the Gaussian distribution could be a continuous like distribution that's usually used as a primary approx. to explain real valued random variables with 2 parameters value μ and also the variance , the previous makes the placement of the height and also the latter makes the breadth of the distribution.
(1)
Fig-4: Graph of Gaussian distribution.
© 2017, IRJET | Impact Factor value: 5.181 | ISO 9001:2008 Certified Journal | Page 1303
2.2 Addictive white Gaussian noise
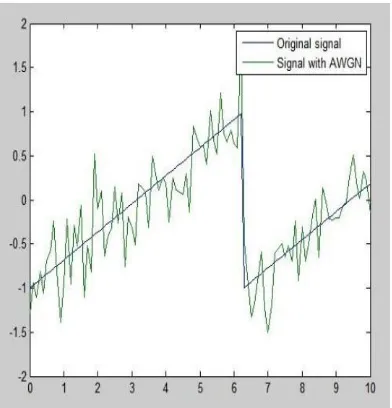
[image:3.595.313.550.71.331.2]Additive white Gaussian noise could be a style of noise that exists within the communication channels typically. In an Additive white Gaussian noise channel model, we tend to continually assume that there's no alternative distortion or effects from other sources. Additive white Gaussian noise could be a model for the thermal noise generated by random negatron movement within the receiver [7]. Here is an example signal with Additive white Gaussian noise in Figure.
Fig-5: Graph of Additive white Gaussian noise
Figure shows the instance signal with AWGN, the blue signal is that the example and therefore the inexperienced signal is that the signal with AWGN. There will be continually AWGN throughout the transmission of signals in metallic element network. Wherever we all simulate the received signal, the AWGN ought to be supplemental to the received signal.
2.3 Q-function
The Q-function may be a convenient thanks to categorical right-tail possibilities for Gaussian random variables. For x∈R, letter (x) is outlined because the chance that a typical traditional chance exceeds x:
(2)
The qualities of the Q-function are as follows:
Q(a)=
Fig-6: Graph of Q-function
The graph of the Q-function is shown in Figure that is drawn by matlab. Wherever we are going to derive the warning chance and therefore the threshold, since they conform the statistical distribution, the previous are going to be expressed in terms of the letter of the alphabet operate and therefore the latter are going to be expressed in terms of the inverse of the letter of the alphabet operate.
2.4 Maximum Posteriori Energy Detection for
Spectrum Sensing
The maximum a posteriori detector is known to be optimum in CR networks [8]. Once CR users begin the spectrum sensing to search out the primary users standing, the received signal r (t).
= (3)
Where stands for no signal transmitted, and stands for signal transmitter, s(t) is that the signal wave, and additionally the n(t) is also a zero-mean AWGN. The detection chance and additionally the warning chance are going to be expressed in Equation through the MAP detection:
(4)
[image:3.595.72.268.247.451.2]© 2017, IRJET | Impact Factor value: 5.181 | ISO 9001:2008 Certified Journal | Page 1304 avoid underutilization of transmission opportunities, in
another hand, have to be compelled to be unbroken as big as potential for constant reason.
Among the MAP detection, the output of the measuring instrument is known as a result of the Chi-square distribution [10]. If the amount of samples is large, with the central limit theorem, we have a tendency to area unit able to assume that the Chi-square distribution is approximate as scientist distribution[9]:
Y (5)
Where n is that the variability of the samples, is that the variance of the noise, the is that the variance of the received signal s(t), as we know, the minimum rate got to be 2W from the Nyquist sampling theorem, so n are going to be delineated as a try of W, where is that the observation time and W is that the data live of the spectrum. From Equation (4)(5). Expressed as follows [8]:
(6)
From the relative atomic mass we are able to get that the warning chances varies with the W and also the observation time. We are able to get the edge as:
(7)
The parameters, the warning likelihood and also the threshold square measure the vital parameters in chromium networks, the warning likelihood ought to be unbroken as tiny as potential to avoid underutilization of transmission opportunities, and that we can take a look at the detections if it's affordable below the warning direction[8].
3. TYPES OF COGNITIVE RADIO
Depending on transmission and reception parameters, there are two prime types of cognitive radio:
Full Cognitive Radio (Mitola radio), during
which each doable parameter discernible by a wireless node is considered.
Spectrum Sensing Cognitive Radio in which only the
radio-frequency spectrum is considered.
Other types are dependent on parts of the spectrum available for cognitive radio:
Licensed Band Cognitive Radio, capable of using bands
assigned to licensed users which will operate on unused television channels.
Unlicensed-Band Cognitive Radio, which can only use
unlicensed parts of the radio frequency spectrum. One such system is described in the IEEE 802.15 Task Group 2 specifications, which focus on the coisidence of IEEE 802.11 and Bluetooth.
Spectrum mobility: method by whichever a cognitive-radio
user changes its frequency of operation. Cognitive-radio networks aim to use the spectrum in an exceedingly dynamic look by permitting radio terminals to work within the best offered band, maintaining uninterrupted communication needs throughout transitions to higher spectrum.
Spectrum sharing: Spectrum sharing psychological
feature radio networks grants psychological feature radio users to share the spectrum bands of the licensed-band users. However, the psychological feature radio users ought to prohibit their transmit power in order that the checking caused to the licensed-band users is unbroken below a precise threshold.
Sensing-based Spectrum sharing: In sensing-based
spectrum allocation psychological feature radio networks, psychological feature radio users initial receive the spectrum allotted to the accredited users to sight the state of the accredited users. Supported the detection results, psychological feature radio users set their transmission methodology. If the accredited users don't seem to be victimization the bands, psychological feature radio users can transmit over those bands. If the certified users area unit victimization the bands, psychological feature radio users share the spectrum bands with the accredited users by proscribing their transmit power.
4. PROCESS AND RESULT
© 2017, IRJET | Impact Factor value: 5.181 | ISO 9001:2008 Certified Journal | Page 1305 signal we've got a bent to induce. Comparison the energy
we've got a bent to sight with the sting.
We know that the minimum SNR is that the smallest amount amplitude needed to rewrite the received signals. So, we tend to modify the SNR to look at the affiliation between the SNR and thus the ultimate detections. In the end, comparison the theoretical value and thus the simulated value to examine whether or not or not the simulation operative commonly and thus the detections we've got a bent to induce is reasonable.
3.1 Encode the Energy Detector
Then we tend to came upon the energy observe or in matlab to detect and compare the signaling that is simulated with threshold. the concept of the energy observe or is to detect the energy of the various samples signal and so examination the energy with the brink to ascertain if there's primary user or not.
In this experiment, we tend to take the SNR = 10 dB and the false alarm probability = 0.01 and take a hundred samples from the simulated signaling to calculate their energy compared with the brink severally to work out whether or not a authorized user is gift or not, and add all the samples that area unit detected. The every samples energy is shown in Table.
Through the detection we tend to get the every samples energy and also the threshold lambda = 0.2147. Examination with the detections, there are a unit 3 samples energy larger than threshold thus there are a unit three spectrums occupied and there three detections.
Since we set the false alarm probability = 0.01, thus there caught to be ninety nine detections in a hundred samples in theory. However the simulated result we tend to get is three detections. It’s wholly completely different compared with the theoretical result. As we all know that the minimum SNR is that the least amplitude required rewriting the received signals, thus SNR perhaps influence the result we tend to get. we are going to modification the SNR and so repeat the simulation to ascertain the link between the SNR and also the detections.
3.2 SNR and Detection
We know that In metallic element networks, to see the spectrum convenience, metallic element user want applied
mathematics data on the received primary signals, therefore the minimum SNR is that the least amplitude required to decipher the received signals. 1 we tend to take the SNR = 10 dB for Associate in example, however we tend to get the result that is completely totally different with the theoretical result. Thus we modify the SNR from 10 dB to zero and find the detections that square measure showed in Table.
Table-1: Detections get from different SNRs
SNR detection
-10 3
-9 4
-8 10
-7 18
-6 40
-5 71
-4 80
-3 96
-2 98
-1 99
0 100
Fig-7: detections get from different SNRs
© 2017, IRJET | Impact Factor value: 5.181 | ISO 9001:2008 Certified Journal | Page 1306 get conjointly inflated and among 7 dB and 5 dB, the
increasing slope is that the largest. That the SNR influences the detections. It indicates that with the increasing of the SNR, the additional spectrums that square measure occupied we will sight.
3.3 Comparison with Theory and Simulated Result
We can ensure that the worth of SNR can influence the detections we have a tendency to get. Thus during this section, we will compare the theoretical worth and therefore the simulated result to urge an appropriate worth for SNR. We modify the SNR from 10 dB to 0 then get the warning likelihood in Equation and therefore the results showed in Table.
(8)
Table-2: SNR & false alarm probability
SNR False alarm probability
-10 0.97
-9 0.96
-8 0.90
-7 0.82
-6 0.60
-5 0.29
-4 0.20
-3 0.04
-2 0.02
-1 0.01
[image:6.595.307.547.104.337.2]0 0
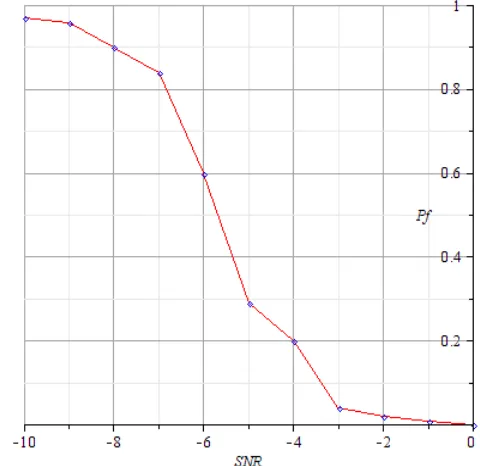
Fig-8: SNR & false alarm probability
[image:6.595.372.551.590.777.2]Figure shows the diagram between SNR and therefore the warning chance. As we all know that that the false alarm probability = 0.01, the figure higher than shows that once SNR is between 2 dB and 0, that the false alarm probability= 0.02, 0.01, and 0, that square measure the principally approximate to the theory value = 0.01. Therefore once SNR is between -2 dB to 0, the energy detector performs best. During this half we have a tendency to take many times of the simulation to form the result we have a tendency to get additional scientific. We have a tendency to take the SNR = 1dB, which may let the energy detector performs best that the false alarm probability = 0.01, then we have a tendency to simulate ten times, and that we get the result showed in Table.
Table-3: Times& detections
Times
we try False alarm probability
1 0.03
2 0.01
3 0.02
4 0.03
5 0
6 0.02
© 2017, IRJET | Impact Factor value: 5.181 | ISO 9001:2008 Certified Journal | Page 1307
8 0.02
9 0.01
10 0.02
Fig-9: false alarm probabilities in several times
The Figure shows the warning likelihood in 10 times of the experiment with SNR = 1 dB, the average value of the 10 results is 0.017; therefore false alarm probability is 0.017. It’s approximate to theory worth 0.01, it matches the warning theoretical worth Pf= 0.01 so the result we have a tendency to get is cheap.
3.4 Discussion of the Simulation and the Result
As we have a tendency to do the simulation, we have a tendency to succeed obtaining the energy of a 100 samples and calculate the warning chance. It’s totally different from the idea price we have a tendency to take. That the SNR are often thought of as a crucial issue to influence the detections. By dynamical the worth of the SNR, we have a tendency to get the link between the SNR and therefore the detections, from the diagram, we are able to see from 2dB to 0, SNR makes the energy detector performs best. We decide a correct price of SNR and repeat the simulation 10 times, we are able to the theory value = 0.017, it matches the idea price = 0.01 inside acceptable errors. Therefore, the results area unit satisfactory and therefore the energy detector work with success within the simulation.
4. CONCLUSIONS
We accomplish simulate the output signals, and that we distinguish whether or not there are primary users or not, we have a tendency to get however the SNR influences the detections. We have a tendency to additionally get the acceptable SNR for the energy detector. Therefore we have a mindset to around get the ultimate results of the spectrum sensing for subjective feature radio supported Energy Detection as we have a tendency to expected. By comparison the theoretical price and also the simulated price we will get that the result we have a tendency to get is cheap and scientific. Considering the disadvantages and restriction of the man oeuvre as mentioned in discussion half, we are going to do further job. 1) Set the vary of the failure between the brink and also the detected energy to tell apart the result at intervals the suitable errors. 2) Undertaking and implement the energy detection in C code to sense the spectrum in metallic element networks at intervals the LINUX operating system.
REFERENCES
[1] A. F. Bruce, “History and Background of Cognitive Radio
Technology” in Cognitive Radio Technology, Elsevier Inc.2006, pp. 1-28. [1] S. Haykin, “Cognitive radio: Brain-empowered wireless communications,” IEEE J. Sel. Areas Commun., vol. 23, no. 2, pp. 201–220, Feb. 2005.
[2] M. H. Islam, C. L. Koh, S. W. Oh, X. Qing, Y. Y. Lai, C. Wang,
Y. C. Liang, B. E. Toh, F. Chin, G. L. Tan, and W. Toh, “Spectrum Survey in Singapore: Occupancy Measurements and Analyses,” CrownCom, vol. 3, no. 14, pp. 1-7, Jul. 2008
[3] D. Cabric, S. M. Mishra, and R. W. Brodersen,
“Implementation Issues in Spectrum Sensing for Cognitive Radios,” Signals, Systs .and comput., vol.1, no. 38, pp. 772-776, Nov. 2004.
[4] S. Haykin, “Cognitive radio: Brain-empowered wireless
communications,” IEEE J. Sel. Areas Commun., vol. 23, no. 2, pp. 201–220, Feb. 2005.
[5] J. Mitola III and G. Q. Maguire, “Cognitive radio: making
software radios more personal,” IEEE Pers. Commun., vol. 6, no. 4, pp. 13-18, Aug. 1999.
[6] N. T. Khajavi and S. M. S. Sadough, “Improved Spectrum
Sensing and Achieved Throughputs in Cognitive Radio Networks,” WiAD, vol. 6, pp. 1-6, Jun. 2010
[7] H. Tang, “Some physical layer issues of wide-band
cognitive radio system,” DySPAN, pp. 151-159, Nov. 2005.
[8] W. Y. Lee and I. F. Akyildiz, “Optimal spectrum sensing
framework for cognitive radio networks” IEEE Trans. Wireless Commun., vol. 7, pp. 3845-3857, Oct. 2008
[9] F. F. Digham, M. S. Alouini, and M. K. Simon, “On the
energy detection of unknown signals over fading channels, Communications, 2003.ICC '03. IEEE International Conference on 11-15 May 2003
[10] J. G. Proakis, Digital communications, fourth ed.
© 2017, IRJET | Impact Factor value: 5.181 | ISO 9001:2008 Certified Journal | Page 1308
[11] A. B. Idris, R. F. B. Rahim and D. B. M. Ali, “The Effect of
Additive White Gaussian Noise and Multipath Rayleigh Fading on BER Statistic in Digital Cellular Network,” RF and Microwave, pp. 97- 100, Sep. 2006.
[12] Jigar Kumar,Arpita Patel and Sagar Patel,
“Multiuser-MIMO Broadcast Channel techniques”,International Research Journal of Engineering and Technology,vol. 3,no. 2, pp. 1587-1590, Feb. 2016.
[13] Sagar Patel, DevangkumarPatil andDhvanit Mehta,
“Performance of 8×1 COSTBC MIMO System under Different Transmit Antenna Selection Scheme with Reduced feedback bit”,International Journal of Wireless Communication,vol. 7,no. 10, pp. 307-311, Oct. 2015.
BIOGRAPHIES
“Milan Patel did his B.E. in Electronics and Communication Engineering from, Chandubhai S. Patel Institute of Technology changa, His research areas are wireless communication engineering, especially in cognitive radio. He is presently studying in the department of EC engineering at Charotar University of Science and Technology Changa Gujarat India since July 2013."
“Kirtan Patel did his B.E. in Electronics and Communication Engineering from, Chandubhai S. Patel Institute of Technology changa, His research areas are wireless communication engineering, especially in cognitive radio. He is presently studying in the department of EC engineering at Charotar University of Science and Technology Changa Gujarat India since July 2013." “
“Sagar Patel did his B.E. in Electronics and Communication Engineering from North Maharashtra Uni. His research areas are wireless communication engineering, especially in MIMO - STBC. He is presently serving in the department of EC engineering at Charotar University of Science and Technology Changa Gujarat India since Oct. 2008 and also doing Ph.D. form CHARUSAT University, Changa. He is teaching the subjects of under graduate engineering students of this university.”
![Fig-2: Received power vs. frequency in Singapore [2]](https://thumb-us.123doks.com/thumbv2/123dok_us/8173853.808657/1.595.310.561.347.505/fig-received-power-vs-frequency-singapore.webp)