http://dx.doi.org/10.4236/jbise.2015.84022
How to cite this paper: Darwich, M.A., Langevin, F. and Darwich, K. (2015) Local Pulse Wave Velocity Estimation in the Ca-rotids Using Dynamic MR Sequences. J. Biomedical Science and Engineering, 8, 227-236.
http://dx.doi.org/10.4236/jbise.2015.84022
Local Pulse Wave Velocity Estimation in the
Carotids Using Dynamic MR Sequences
Mohamad Ayham Darwich
1*, François Langevin
2, Khaldoun Darwich
31Faculty of Technical Engineering, Tartus University, Tartus, Syria
2Advanced Medical Imaging Center, University of Technology of Compiègne, Compiègne, France 3Faculty of Dentistry, Damascus University, Damascus, Syria
Email: *[email protected]
Received 27 February 2015; accepted 3 April 2015; published 7 April 2015
Copyright © 2015 by authors and Scientific Research Publishing Inc.
This work is licensed under the Creative Commons Attribution International License (CC BY). http://creativecommons.org/licenses/by/4.0/
Abstract
The current study presents a new protocol for local pulse wave velocity (PWV) measurement us-ing dynamic MR sequences, which have a high temporal resolution (TR < 6 ms). MR images were obtained at two positions along the common carotid artery, separated by a distance of 5 cm. In each phase of a MR series, carotid region was automatically extracted and then its area distension waveform could be obtained. Sixteen volunteers with no symptoms of cardiovascular diseases were studied. For local PWV estimation, three delay estimation principles were tested and pro-duced the following values: intersecting tangents method (M1): 4.72 ± 1.40 m/s, second derivative method (M2): 4.94 ± 1.68 m/s and cross-correlation method (M3): 5.03 ± 1.17 m/s. The cross- correlation method showed a relative high reliability as its least standard deviation.
Keywords
Local Pulse Wave Velocity, Arterial Elasticity, Dynamic Magnetic Resonance Imaging
1. Introduction
Heartbeat generates pressure waves traveling along the aorta and main pulmonary artery to the peripheral branches. The velocity of a pressure wave, which is called the pulse wave velocity (PWV), is considered to be an important surrogate marker for biomechanical properties of vessels [1]. It provides information about the mechanical properties of the vessel: the stiffer the artery is, the higher the PWV will be [2]. So measuring the PWV is the simplest way to assess arterial stiffness, which is a key factor in cardiovascular physiology [3].
In recent years, different techniques have been developed to assess the PWV noninvasively. It is commonly
estimated by dividing a known distance between two measurement sites by the propagation time of the pressure or flow wave. Usually, the PWV is measured over a long pathway, often the carotid-femoral arterial trajectory.
Commercially available PWV measuring devices can directly record pulse waves by means of transducers, such as mechanotransducers or applanation tonometers, calculate the PWV, which is a global PWV value, and provide a general arterial stiffness evaluation [4]. These devices utilize different timing algorithms to assess the wave transit time. This is determined by identifying a characteristic time-point on each waveform, then calcu-lating the delay between them. However, the shape of the pulse wave varies along the arterial system because of the differences in arterial wall properties along the trajectory. Thus, the accurate identification of time-point is practically difficult. Moreover, the vessel path between carotid and femoral is not a straight line, so distance measurement is also a major source of error.
The global PWV that we have described is an average PWV over a long segment composed of arteries with different mechanical characteristics [2]. This global evaluation does not give information about the position of the arterial abnormalities, so local estimation studies are advantageous and clinically important in local investi-gations of arterial wall properties. Some local PWV estimation attempts on the carotid artery have been made by means of ultrasonographic system [2] [5] [6]. The transit time is calculated based on carotid diameter waveforms, while segment length is set by characteristics of US probes.
On the other side, magnetic resonance imaging (MRI) has also been proposed to determine PWV. It has the advantage of determining the central aortic PWV globally and eliminating errors of vessel segment length mea-surements [7]. The most commonly used MRI method is also the transit-time method, which is similar to ultra-sound methods. Several methods based on phase contrast sequence have been described [1] [7]. In these at-tempts, flow waveforms were recorded in aorta, and then their time-point could be identified. However, because of the limiting temporal resolution (~30 ms), these characteristic points may be marked inaccurately.
To our knowledge, few literatures describe a “gold standard” method for local PWV assessment.
In the present study, we propose a new method to derive the local carotid PWV using gated dynamic MRI sequences with a high temporal resolution (<6 ms) for normal and healthy persons. In contrast to other existent methods, cross-sectional area distension waveforms were analyzed. These waveforms are composed by about one hundred sample points, so that pulse propagation time can be calculated more accurately.
2. Materials and Methods
2.1. Subjects and Image Acquisition
Sixteen volunteers with no symptoms of cardiovascular disease were studied (11 male and 5 female, mean age 26.1 ± 10.2 years; systolic blood pressure: 116.8 ± 11.1 mmHg; diastolic blood pressure: 81.6 ± 9.7 mmHg). This population with a low mean age allows us to study and approach the standard value of local PWV in carotid.
All acquisitions were performed on two 1.5T MRI units (Signa® HDxt 1.5T imaging system, GE Healthcare, Milwaukee, WI, USA), one in CIMA-UTC (Compiègne, France) and the other in Necker Hospital (Paris, France). Meanwhile, we used 16-channel head-neck-spine volumetric coils (GE Signa® HD Head-Neck-Spine array coils, GE Healthcare) as reception coils.
Images were acquired through a Fast Cardiac Gating Gradient Recalled Echo Sequence (FastCard GRE, GE Healthcare) which is an ECG-gated, 2D gradient echo sequence that acquires multiple phases of a cardiac cycle at a single slice (repetition time TR = 6 ms, echo time TE = 1.7 ms, matrix size = 256 × 256, field of view (FOV) = 16 cm, flip angle = 50˚, slice thickness (Tck) = 5 mm, views per segment (VPS) = 1, Arrhythmia Rejection Window (ARW) = 10%, trigger delay minimum = 10 ms). As a result of time of flight (TOF) effect, this se-quence ensures an ideal contrast between flowing blood and static tissues. TR was so short that fluid T2 decay could be ignored [8].
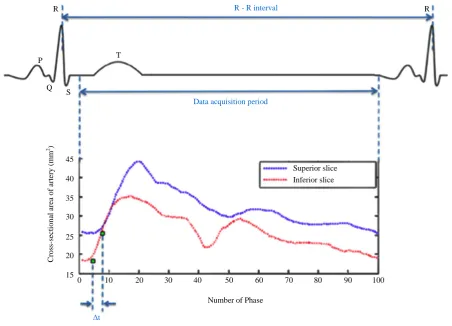
During each phase of a cardiac cycle, a row of data space would be filled successively. The number of phases was calculated based on the heart rate, minimum TR, trigger window and views per segment. Data acquisition is launched after a trigger delay of 10 ms. This delay is applied similarly on both slices, so its effect on delay esti-mation was neglected. Irregular R-R intervals are rejected by ARW. An entire image (256 × 256) filled by 256 rows requires 256 heartbeats.
2.2. PWV Estimation
PWV L
t =
∆
where Lis the distance between two slices and Δt is the transit time.
In order to measure local PWV, images were obtained at two perpendicular slice positions along the common carotid artery, separated by a distance (L) of 4 to 5 cm. The superior slice locates near the bifurcation (Figure 1). Before launching MR sequences, slice positions and the distance could be determined on MRI console. Al-though common arteries are not strictly perpendicular to cross-sectional slices, for such a little segment of artery, the difference between its real length and the vertical length could be ignored. In addition, the transit time was defined as the pressure wave propagation time crossing the distance between these two slices.
In each image of MR series, carotid region was extracted using a previously developed algorithm [9], thus, a waveform of artery cross-sectional area (distension waveform) within a cardiac cycle could be computed. Brief-ly, there are two major steps in the segmentation process. First, a threshold of gray-level was set to isolate the carotid artery from the other tissues in the image. But during a cycle of heartbeat, turbulences of blood flow ap-peared and would cause a loss of MR signal. Thus, in a second step a corrective mask obtained from the last image of the series was used applied to fit the deformed carotid image. Finally, the area of corrected section shape could be calculated.
2.3. Estimation of Pulse Transit Time
To estimate pulse wave velocity, different characteristics of pulse wave have been analyzed in other studies, such as arterial pressure [2] [3], artery diameter [5] [6] and flow velocity [1] [7]. Here analyses were applied to the artery cross-sectional area at the early phase of a cardiac cycle. This arterial distension waveform was con-sidered as the first evidence of the opening pulse process with a wave impulse.
As no standard value of local PWV exists, different transit time estimation methods have been used and com-pared.
Superior slice
[image:3.595.197.434.399.684.2]Inferior slice L = 5 cm Tck = 5 mm
2.3.1. Estimation by Foot Point of Waveform
A crucial point called “foot of waveform” is considered as the reference part of pulse wave. The transit time is determined by the delay between the two feet of the pulse waves of superior and inferior slices. But early wave reflection hinders the identification of the foot of waveform [2] [3], especially in carotid sites. To avoid that, the location of the foot should be chosen at the beginning part of systole, which is little affected by reflected waves.
Two principal algorithms have been used to identify the foot of pulse waves: intersecting tangents method and second derivative maximum method [2] [3].
1) Intersecting tangents method (denoted as M1)
In this method, the foot of the waveform is identified by the intersection of an upstroke line with a horizontal line through the minimal value of the pre-systolic portion. The upstroke line is defined as the tangent to the maximum slope point in systolic upstroke [3][10] (Figure 2).
2) Second derivative maximum method (denoted as M2)
An assumption is made that the foot of the waveform corresponds the maximum value in artery cross-sectional area acceleration, which corresponds to the second derivative maximum of the distension waveform.
When the second derivative curve was obtained, we notice that it was very sensitive to interferences by the original one. Hence, a triangular moving average filter has been applied to smooth the first and the second de-rivative waveforms [11] [12] (Figure 3).
2.3.2. Estimation by Normalized Waveforms
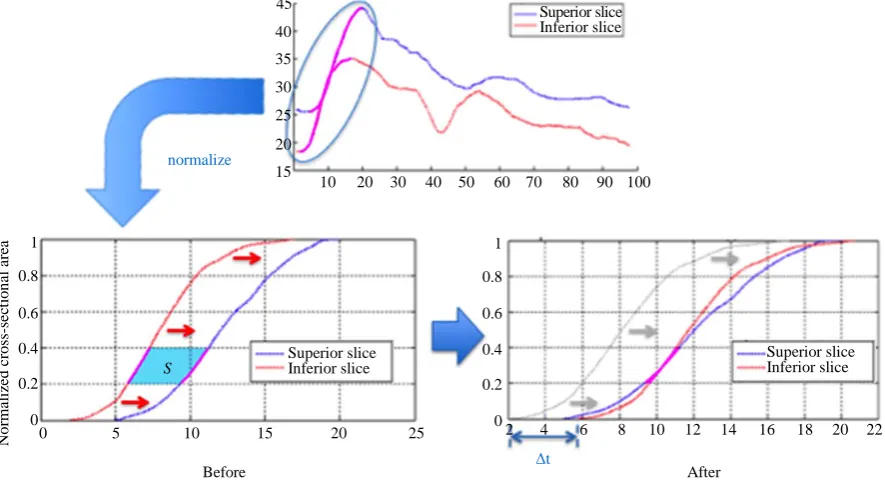
This method is also called cross-correlation method (denoted as M3). The two distension waveforms were nor-malized using the maximal value, then the inferior waveform has been moved horizontally, and an enclosed area between the two curves was determined. When the area is equal to 0, the horizontal displacement is considered as the transit time.
In a first step, the amplitude of systolic parts has been normalized and scaled up into an interval between 0
R - R interval
Data acquisition period
Δt
0 10 20 30 40 50 60 70 80 90 100 15
25 35 45
40
30
20
Number of Phase
Superior slice Inferior slice
R R
P
Q S
T
C
ro
ss
-s
ec
ti
o
n
al
a
re
a
o
f a
rt
e
ry
(m
m
[image:4.595.86.539.382.708.2]2)
and 1. Besides, phase index of waveforms were kept and not modified during the normalization. For the deter-mination of correlation area, we only considered the normalized values in the interval between 0.2 and 0.4 in order to avoid the confounding influence of wave reflection (Figure 4).
3. Results
3.1. Inter Subject Reproducibility Study
To approach a standard value of local PWV in carotid artery for healthy persons, all mentioned algorithms were
0 10 20 30 40 50 60 70 80 90 100 25 35
45 40
30 Original curve
Superior slice Inferior slice
1st derivative
2rd derivative
0 10 20 30 40 50 60 70 80 90 100
[image:5.595.89.537.198.394.2]0 10 20 30 40 50 60 70 80 90 100 0 10 20 30 40 50 60 70 80 90 100 0 10 20 30 40 50 60 70 80 90 100 0 10 20 30 40 50 60 70 80 90 100 20 15 -2 -1 0 1 2 3 -2 -1 0 1 2 3 -1 -0.5 0.5 1 0 -1 -0.5 0.5 1 0 25 35 40 30
Figure 3. Second derivative maximum method. First row: original distension waveforms. Second row: first derivative waveform smoothed by a triangular moving average filter. Third row: second derivative waveform also smoothed by a tri-angular moving average filter. The blue and red curves indicate the superior and inferior slices respectively.
2
10 20 30 40 50 60 70 80 90 100 45 normalize Superior slice 25 35 40 30 15 20 Inferior slice
0 5 10 15 20 25
Before After
4 6 8 10 12 14 16 18 20 22 0 0.2 0.4 0.6 0.8 1 0 0.2 0.4 0.6 0.8 1 Superior slice Inferior slice Superior slice Inferior slice S Δt N o rm al iz ed c ros s-sec ti o n al ar ea
[image:5.595.90.533.444.685.2]applied to all subjects. Carotid arteries in both two sides were considered, and no sign shows that there exists a correlation between the PWV values acquired from different sides. As a result, they may be considered as the values measured from independent subjects.
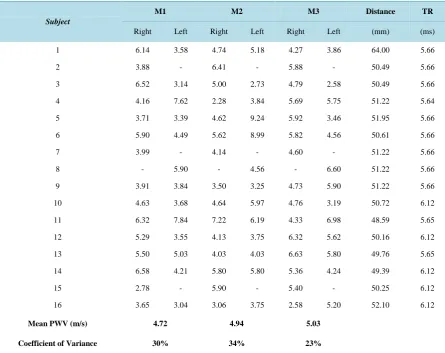
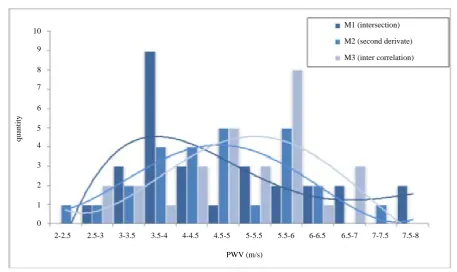
The estimated PWV obtained from those methods were listed in Table 1. From the variation coefficient asso-ciated with each method, we notice that M3 produced PWV values with the minimal coefficient. Furthermore, Figure 5 shows that the PWV values calculated by the three different algorithms yielded from 3.5 to 5.5 m/s, without the influence of the heart rate [3] [10], while the cross-correlation method yielded superior interest re-producibility than the other two methods.
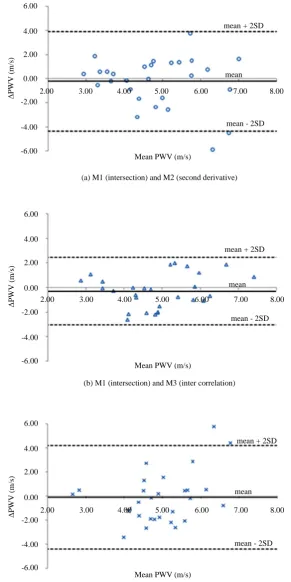
With the results in Table 1, we noticed that M1 and M2 show relative lower reproducibility with regard to M3. Their coefficients of variance (CV) are 30% and 34% respectively, whereas the one of M3 is 23%. Here the results largely depend on real PWV of investigated subjects. In spite of that, M3 shows the best reproducibility Figure 6 shows the comparisons of the three mentioned algorithms. Bland-Altman plot reveals the relationship between the mean difference of values ± 2SD, and the mean value of results obtained by two different algo-rithms. Differences between methods are −0.21 ± 4.12 m/s for M1 and M2, −0.31 ± 2.76 m/s for M1 and M3, and −0.09 ± 4.32 m/s for M2 and M3. Thus, M1 and M3 show much more significant correlation.
Some errors may originate from algorithms. In M2, the shape of second derivative is too sensitive and has small variations. This prevents the determination of the characteristic point even with the application of a trian-gular moving average filter.
[image:6.595.92.538.364.717.2]With the cross-correlation method, only the portions between 0.2 and 0.4 of normalized waveform have been considered. That permitted to eliminate irregular shapes at the beginning part of the waveforms, and to minimize reduce the influence of reflected waves [6] [7].
Table 1. Inter subject study. The coefficient of variance represents the rate of the standard deviation to mean PWV.
Subject
M1 M2 M3 Distance TR
Right Left Right Left Right Left (mm) (ms)
1 6.14 3.58 4.74 5.18 4.27 3.86 64.00 5.66
2 3.88 - 6.41 - 5.88 - 50.49 5.66
3 6.52 3.14 5.00 2.73 4.79 2.58 50.49 5.66
4 4.16 7.62 2.28 3.84 5.69 5.75 51.22 5.64
5 3.71 3.39 4.62 9.24 5.92 3.46 51.95 5.66
6 5.90 4.49 5.62 8.99 5.82 4.56 50.61 5.66
7 3.99 - 4.14 - 4.60 - 51.22 5.66
8 - 5.90 - 4.56 - 6.60 51.22 5.66
9 3.91 3.84 3.50 3.25 4.73 5.90 51.22 5.66
10 4.63 3.68 4.64 5.97 4.76 3.19 50.72 6.12
11 6.32 7.84 7.22 6.19 4.33 6.98 48.59 5.65
12 5.29 3.55 4.13 3.75 6.32 5.62 50.16 6.12
13 5.50 5.03 4.03 4.03 6.63 5.80 49.76 5.65
14 6.58 4.21 5.80 5.80 5.36 4.24 49.39 6.12
15 2.78 - 5.90 - 5.40 - 50.25 6.12
16 3.65 3.04 3.06 3.75 2.58 5.20 52.10 6.12
Mean PWV (m/s) 4.72 4.94 5.03
M1 (intersection)
M2 (second derivate)
M3 (inter correlation) 10
9
8
7
q
u
an
tity
6
5
4
3
2
1
0
PWV (m/s)
[image:7.595.81.539.80.352.2]2-2.5 2.5-3 3-3.5 3.5-4 4-4.5 4.5-5 5-5.5 5.5-6 6-6.5 6.5-7 7-7.5 7.5-8
Figure 5. Distributions of the results of PWV estimated by three methods. We notice that PWV values of three different al-gorithms yielded from 3.5 to 5.5 m/s, and the cross-correlation method yield superior interest reproducibility than other me-thods.
3.2. Intra Subject Reproducibility Study
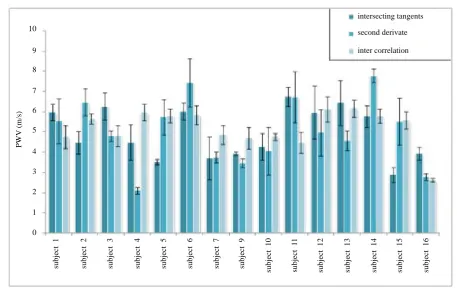
In this part, the reproducibility of segmentation has been studied. For each subject, we have applied five times of segmentation process to extract the right carotid region (15 subjects in all) with different sizes of determination windows (used to frame the carotid). Then we observed their influences to the PWV. The results (mean value and standard deviation) are shown in Figure 7. We notice that M3 method was the least affected when changing the windows of segmentation. In fact, we think that the deviations caused produced in the segmentation process, will result in a mild variation of extracted area and elevated variance coefficient.
4. Discussion
In this study, we present a new method to assess the local PWV in normal carotid artery using dynamic MRI. This method is totally noninvasive and is suited to studies of large population. Compared with other MRI based methods, distension waveforms obtained by the proposed technique has a much higher temporal resolution (6 ms). This allows us to calculate characteristic time-points (“foot”) more accurately. In addition, the variation of carotid during a complete cardiac cycle could be observed, with the FastCard gating method, although a tiny de-lay (10 ms) exists before each data acquisition period.
In this context, few attempts of local PWV measurement in carotid exist at present, and the present study pro-vides seem to introduce a new alternative of “gold standard” in this field.
Hermeling et al. and Meinders et al. used multiple M-line ultrasound system to obtain artery diameter disten-sion waveform simultaneously at multiple positions along the common carotid artery. The former got 14 wave-forms spaced over 17 mm while the latter applied 16 echo lines spanning a total width of 15.86 mm. These two studies have found estimated PWV of 3.5 ± 0.7 m/s with 4 subjects [6] and 5.5 ± 1.5 m/s with 23 subjects re-spectively [5]. Our results seem to be situated in the middle of the two mentioned ranges, but the insufficient subjects number and the significant variation coefficient raise doubts about the reliability of their techniques.
mean + 2SD 6.00
Δ
PWV
(
m/
s)
mean - 2SD mean 4.00
2.00
0.00
-2.00
-4.00
-6.00
2.00 3.00 4.00 5.00 6.00 7.00 8.00
mean + 2SD 6.00
Δ
P
W
V (
m/
s)
mean - 2SD mean 4.00
2.00
0.00
-2.00
-4.00
-6.00
2.00 3.00 4.00 5.00 6.00 7.00 8.00
mean + 2SD 6.00
Δ
P
W
V (
m/
s)
mean - 2SD mean 4.00
2.00
0.00
-2.00
-4.00
-6.00
2.00 3.00 4.00 5.00 6.00 7.00 8.00 Mean PWV (m/s)
Mean PWV (m/s)
Mean PWV (m/s)
[image:8.595.166.458.85.668.2](c) M2 (second derivative) and M3 (inter correlation) (b) M1 (intersection) and M3 (inter correlation) (a) M1 (intersection) and M2 (second derivative)
intersecting tangents second derivate inter correlation 10 9 8 7 P W V ( m /s
) 6
[image:9.595.82.540.79.372.2]5 4 3 2 1 0 su b ject 1 su b ject 2 su b ject 3 su b ject 4 su b ject 5 su b ject 6 su b ject 7 su b ject 9 su b ject 10 su b ject 11 su b ject 12 su b ject 13 su b ject 14 su b ject 15 su b ject 16
Figure 7. Right carotid intra subject study of 15 valid subjects.
5. Conclusions
We presented a new protocol for local PWV estimation in normal common carotid artery, using dynamic MR sequence having high temporal resolution. Dynamic images were used to obtain two distension waveforms which illustrate the variation of cross-sectional area of the carotid artery.
With the obtained waveforms, we effectuated the delay estimation using three different algorithms.
Cross-correlation method (M3) showed an estimated PWV result of 5.03 ± 1.40 m/s (CV = 23%) with a rela-tive high reliability, while the results of the other two methods, intersecting tangents (M1) and second derivarela-tive method (M2), are 4.72 ± 1.68 and 4.94 ± 1.17 m/s (CV = 30% and 34%) respectively.
It would be highly recommended to apply this new protocol in pathologic cases. This would determine the in-fluence of different pathologies on vessel properties. In addition, detections and diagnostics of lesions or patho-logic changes could be performed locally and more precisely.
References
[1] Yu, H., Peng, H., Wang, J., Wen, C. and Tseng, W. (2006) Quantification of the Pulse Wave Velocity of the Descend-ing Aorta UsDescend-ing Axial Velocity Profiles from Phase-Contrast Magnetic Resonance ImagDescend-ing. Magnetic Resonance in Medicine, 56, 876-883. http://dx.doi.org/10.1002/mrm.21034
[2] Hermeling, E., Reesink, K.D., Reneman, R.S. and Hoeks, A.P. (2007) Measurement of Local Pulse Wave Velocity: Effects of Signal Processing on Precision. Ultrasound in Medicine and Biology, 33, 774-781.
http://dx.doi.org/10.1016/j.ultrasmedbio.2006.11.018
[3] Boutouyrie, P., Briet, M., Collin, C., Vermeersch, S. and Pannier, B. (2009) Assessment of Pulse Wave Velocity. Ar-tery Research, 3, 3-8. http://dx.doi.org/10.1016/j.artres.2008.11.002
[4] Salvi, P., Magnani, E., Valbusa, F., Agnoletti, D., Alecu, C., Joly, L. and Benetos, A. (2008) Comparative Study of Methodologies for Pulse Wave Velocity Estimation. Journal of Human Hypertension, 22, 669-677.
http://dx.doi.org/10.1038/jhh.2008.42
[6] Hermeling, E., Reesink, K.D., Reneman, R.S. and Hoeks, A.P. (2006) Measurement of Local Pulse Wave Velocity Using Non-Invasive Multiple M-Line Ultrasound. Artery Research, 1, S33.
http://dx.doi.org/10.1016/S1872-9312(07)70047-9
[7] Fielden, S.W., Fornwalt, B.K., Jerosch-Herold, M., Eisner, R.L., Stillman, A.E. and Oshinski, J.N. (2008) A New Me-thod for the Determination of Aortic Pulse Wave Velocity Using Cross-Correlation on 2D PCMR Velocity Data. Journal of Magnetic Resonance Imaging, 27, 1382-1387. http://dx.doi.org/10.1002/jmri.21387
[8] Langevin, F., Darwich, M.A. and Capellino, S. (2009) Signal Reduction at High Velocities during One Plug MR In-flow. IRBM, 2, 6-18. http://dx.doi.org/10.1016/j.irbm.2009.09.002
[9] Darwich, M.A., Capellino, S. and Langevin, F. (2008) Adaptive Segmentation for Vessels Dynamic Characterization Using High Resolution MR Sequences. Machine Version and Image Processing, 33, 125-129.
http://dx.doi.org/10.1109/IMVIP.2008.12
[10] Millasseau, S.C., Stewart, A.D., Patel, S.J., Redwood, S.R. and Chowienczyk, P.J. (2005) Evaluation of Carotid-Fe- moral Pulse Wave Velocity: Influence of Timing Algorithm and Heart Rate. Hypertension, 45, 222-226.
http://dx.doi.org/10.1161/01.HYP.0000154229.97341.d2
[11] Reesink, K.D., Hermeling, E., Hoeberigs, M.C., Reneman, R.S. and Hoeks, A.P. (2007) Carotid Artery Pulse Wave Time Characteristics to Quantify Ventriculoarterial Responses to Orthostatic Challenge. Journal of Applied Physiology, 102, 2128-2134. http://dx.doi.org/10.1152/japplphysiol.01206.2006