© 2016, IRJET | Impact Factor value: 4.45 | ISO 9001:2008 Certified Journal | Page 1057
MODELING OF A CRACKED PIPE INTO A BEAM AND PREDICTION OF
FATIGUE CRACK PROPAGATION
K. Srinivasa Rao
1, G .Sai Meghana
2,Sk.Umar
3, K.Mounika Chowdary
4,,N.Krishna Reetika
5.
T. Phaneendra
61
Assistant Professor, Dept.of Mechanical Engineering, V.R.Siddhartha Engineering College,
Vijayawada, AP, INDIA.
2,3,4,5,6
Final Year B.Tech. Dept.of Mechanical Engineering, V.R.Siddhartha Engineering College,
Vijayawada, AP, INDIA.
---***---Abstract
- When pipes are subjected to different types ofloading like compression, tension, internal pressure, bending or any combination of these may initiate and propagate a crack. This becomes more important if the pipes carry hazardous fluid. To predict fatigue crack propagation in circumferentially cracked pipe using its three dimensional data becomes cumbersome. In the first part of this project the pipe is converted into a beam using conformal transform. After the pipe was converted to beam it was found that the crack in the beam is not through. Hence the fatigue crack propagation cannot be simulated using FRANC2D as it is finite element based two dimensional crack propagation simulator software. In the second part of the project, the fatigue crack growth tests were carried out on an EN8 steel specimen in Instron 8800 machine. The crack propagation in EN8 steel beam was also simulated using FRANC 2D. Then the results obtained experimentally and from FRANC 2D were compared.
Key Words:
Pipe, Compression, Bending, Fatigue
Crack
1.0 INTRODUCTION
Pipes are often used in plants and industries like gas transmissions, coolants transmission in nuclear power plants etc. Fatigue crack growth prediction for an existing surface flaw is important for developing flaw acceptance criteria. Researchers have studied crack growth behavior and fatigue fracture of pipes containing surface flaws under different loading conditions [10, 11]. Many practical methods have been considered to study fatigue crack growth in structural components like plate, bar, pipe etc. but these are destructive in nature and require a lot of money, skill and time. To solve these problems many logical approach based on fracture mechanics and finite element method have been suggested. Three dimensional analysis of partial circumferential crack in pipe requires huge computational effort to meet the acceptable mesh pattern and enormous computer storage. In conformal transform method two coordinate systems are introduced which are named as ω-plane and the z-plane. The ω-plane
describes the geometry of the (pipe) cracks under investigation in the initial coordinate system. The z-plane describes the geometry where a known solution exists[1]. Four point bending test was performed using INSTRON MACHINE on a beam of EN 8 steel. Then crack propagation simulation was performed on the dimensions of beam obtained using a mesh generator program CASCA and a FEM based crack propagation simulator program FRANC2D. Results obtained from both the cases were then compared
1.1 FATIGUE:
Failures arising under conditions of dynamic or alternating loading are called fatigue failures, apparently because it is generally observed that these failures happen only after certain period of time and service. Fatigue failure usually occurs at stresses below those required for yielding or in some cases above the yield strength but below the tensile strength of the material. A fatigue failure can usually be recognized from appearance of the fracture surface, which shows a smooth region due to rubbing action as the crack propagated through the section and through a region, where the member has failed in a ductile manner when cross section was no longer able to carry the load. The progress of the fracture is indicated by a series of rings or beach marks, progressing inwards from point of initiation of failure [5].
Fatigue process involves
1. Crack initiation – This includes the early development of fatigue damage which can be removed by a suitable thermal anneal.
2. Slip band crack growth – This involves the deepening of the initial crack on planes of high shear stress. This is called stage-I.
3. Crack growth on planes of high tensile stress-involves growth of well-defined crack in a direction normal to maximum tensile stress. Usually it is called stage-II crack growth.
© 2016, IRJET | Impact Factor value: 4.45 | ISO 9001:2008 Certified Journal | Page 1058
1.2 FRACTURE:
Fracture is a form of failure. It is defined as the fragmentation of a solid body into two or more parts under the action of stress. Process of fracture can be considered to be made up of two components crack initiation and crack propagation. They are basically two types of fracture - ductile and brittle fracture.
The fracture can be called ductile or else brittle depending on the capability of a material to endure plastic deformation during the fracture. A ductile fracture is described by substantial amount of plastic deformation prior to and during the crack propagation. Whereas, brittle fracture is characterized by micro-deformation during the crack propagation. The plastic deformation that occurs during ductile fracture, if examined, can be useful as caution mark to the fracture that may occur in later stages. Thus brittle fracture shall be avoided because it might happen without warning
2.0 FATIGUE CRACK PROPAGATION:
Usually, fatigue crack propagation can divided into 3 stages-
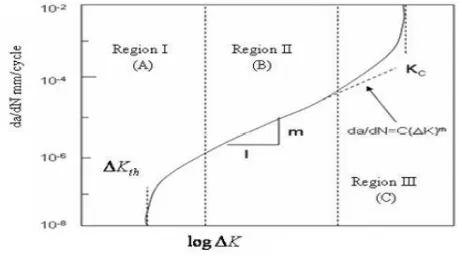
1. region I (short cracks), 2. region II (Long cracks) 3. region III (final fracture). Description of Region I
Once initiated, the fatigue crack propagates along high shear stress planes (45 degrees). It represents the early development of a fatigue crack and the crack growth rate. This is a slow crack growth process which is related to non-continuum mechanisms. da/dN is normally of the order 10-6 mm/cycle or smaller. This region is very sensitive and it is largely influenced by the microstructure features of the material such as the mean stress of the applied load, grain size, the environment present and the operating temperature. Region I is bounded by a threshold value
ΔKth below which there is no observable fatigue growth. At stresses below ΔKth cracks behave as non-propagating cracks. ΔKth occurs at crack propagation rates of the order of 0.25 nm/cycles or less.
Description of Region II
Stage II initiates when the slip start to develop in different planes close to the crack tip and the stress intensity factor K increases as a consequence of crack growth or higher applied loads. Propagation in stage II is perpendicular to the load direction, while stage I is orientated 45 degrees in relation to the applied load. An important characteristic of stage II is the presence of surface ripples known as striations; these are visible with the aid of a scanning electron microscope. The region II represents an essentially linear relationship between log da/dN and log K.
=C (ΔK)m (Paris law)
where, a = crack length; N = no. of cycles; ΔK = stress intensity factor range
ΔK=Kmax-Kmin
The crack growth rate is typically on the order of 10-6 to 10-3 mm/cycle. This region corresponds to stable crack growth and the influence of microstructure, mean stress, ductility, environment and thickness are small. The influence of the mean stress is probably the most significant and usually results in closely spaced lines parallel to each other. The mean stress effect is greater for some material than others.
Description of Region III
[image:2.595.312.543.427.558.2]This is a region of accelerated crack growth which is unstable as Kmax approaches KIC, the fracture toughness of material. crack growth is controlled by static modes of failure and is very sensitive to the load ratio, microstructure and stress state(plane stress or plane strain loading). Region III represents the fatigue crack growth at very high rates, da/dN > 103 mm/cycle due to rapid and unstable crack growth just before the final failure. The da/dN versus K curve is not gradual and asymptotically approaches the fracture toughness Kc for the material. The mean stress, materials microstructure and thickness have a large influence in this region and the environment has little influence. Fatigue crack propagation analysis is very complex in this region but often ignored because it has little importance in most fatigue situations. The reason that the fatigue crack growth rates are very high and little fatigue life is involved
Figure 1. typical da/dn vsΔK curve
2.1 STRESS ANALYSIS FOR MEMBERS WITH
CRACKS-FRACTURE
MECHANICS APPROACH
Fracture mechanics is an engineering method for analyzing fracture and fatigue behavior of sharply notched structural members (cracked or flawed) in terms of stress and crack length. Stress concentration factor and stress intensity factor are two quantities which are used to analyze a stress in vicinity and ahead of a well-defined notch or a sharp crack respectively.
© 2016, IRJET | Impact Factor value: 4.45 | ISO 9001:2008 Certified Journal | Page 1059
example notches, fillets, holes etc. if these discontinuitieshave well-defined geometry, it is usually possible to determine the stress concentration factor ,Kt for these geometries. Stress concentration factor gives a relation between local maximum stress and applied nominal stress. However, if the concentration of stress is severe, an analytical method different from the stress concentration approach is needed to analyze the behavior of structural components containing sharp imperfections
Stress Intensity Factor (K) is asharp crack. It is related to both and has units of (MPa√m), ksi√in.
parameter which is used to analyze stress field ahead of a nominal stress level in the member and the size of crack
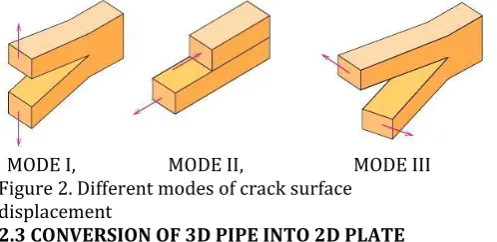
2.2 MODES OF CRACK DISPLACEMENT
There are three basic modes of crack displacement MODE:I-Tensile type of fracture corresponds to fracture where the crack surfaces are displaced normal to themselves.
MODE II- It is sliding mode. Here shear stress acts parallel to the plane of crack and perpendicular to the crack front MODE III- It is tearing mode. Here shear stress acts parallel to the plane of crack and parallel to the crack front.
[image:3.595.311.570.259.426.2]MODE I, MODE II, MODE III Figure 2. Different modes of crack surface
displacement
2.3 CONVERSION OF 3D PIPE INTO 2D PLATE USING CONFORMAL TRANSFORM METHOD
In conformal transform method two coordinate systems are introduced which are named asω-plane and the z-plane. The ω-plane describes the geometry of the (pipe) cracks under investigation in the initial coordinate system. The z-plane describes the geometry where a known solution exists.
The two planes are related by equation
ω = f(z) =ez = reiθ --- 1 (1) where, r and θ are coordinates in w-plane and
z=α*+iβ* --- 2 (2)
where α* and β* are coordinates in the z-plane.
Figure: 3. Partly elliptical circumferential
surface crack in pipe
Figure 4. ω plane Figure 5. z plane
Figure 5. z plane[1]
This technique is only applicable for R1>0 as the solutionwill become undefined when R1 approaches zero. To determine stress intensity factors, a semi-analytical solution technique that involves the use of an analytical solution combined with a numerical algorithm is used. The analytical solution is based upon the solution by Vijayakumar and Atluri (1981) for a semi-elliptical crack in a flat plate. To compute the stress intensity factors for a crack in an infinite body under the influence of arbitrary load, the analytical solution and knowledge of the stress field on the crack face. The solution can then be corrected to account for the influence of the boundaries near the crack. Quite simply the above methodology can be expressed as:
KI=K∞Fρ
Here K∞ is the infinite body solution and Fρ is the modification factor used to correct the solution resulting from the interactions of the boundaries around the crack Fρ =Fe+(Fs−Fe) e−αda/ρ a=crack length ρ=local curvature This correction factor was used in the present analysis. Here Fe and Fs are the boundary correction factors for a fixed elliptical crack and semi-elliptical crack in a finite body, respectively.
[image:3.595.37.286.406.527.2]partly-© 2016, IRJET | Impact Factor value: 4.45 | ISO 9001:2008 Certified Journal | Page 1060
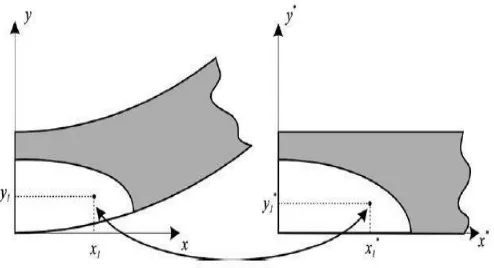
circumferential elliptical crack are converted intodimensions and coordinates for the associated semi-elliptical surface flaw in a flat plate. The solution then continues as if the problem were a semi-elliptical flaw in a flat plate. This step is diagrammatically represented.
Figure 6. Conversion from a circumferential crack to a semi-elliptical crack
[image:4.595.37.284.404.538.2]The point in the fictitious domain of the semielliptical flaw in the flat plate can be related directly to the point (x1,y1) in the real domain of the partly elliptical circumferential crack.
Figure 7. Relationship between points in two planes
X1=(Ri+t)× ×sin
Y1=(-1)×(Ri+t)× ×cos -1)
Necessary parameters are determined the stress intensity factor in the z-plane K can now be determined. To determine K for a semi-elliptical flaw in a flat plate the present approach uses an approximate semi analytical solution. Thus the resulting numerical solution cannot be converted to KI without a fully analytical solution for a semi-elliptical flaw in a flat plate. To both domains
Since the crack is not through the beam it is impossible to do simulation of fatigue crack growth on Franc2D software. A 3D software is to be needed. Now conducting experiments on a EN8 steel beam
3.1 EXPERIMENTAL METHOD FOR BEAM:
A beam of material EN8 with dimensions given below were considered for experimental work. The tests were
carried out on an Instron 8502 machine with 250 kN load capacity. The machine was also interfaced to a computer for control and data acquisition. Tests were conducted in air and in room temperature. Test on pipe were done by loading it under four point bending. Loading was up to large scale plastic deformation. After the test, the crack surface was broke open and exact crack length was measured at various loading stages. Experiments considered in this study were conducted using the four-point bend method schematically shown in Figure 8.
Figure 8. Shear Force and Bending Moment Diagram for Four Point Bend Test
During the test the load was quasi-statically increased under displacement control, until the maximum load was reached. As the low compliance of the test rig, unstable crack propagation never occurred.
The test specimen was gripped between rollers on the INSTRON machine. This type of loading ensured that the notched section of the pipe was subjected to pure bending stress as only point contact was on the surfaces of two circles. The pipes with part through and through-wall notches were fatigue pre-cracked before the fracture tests to ensure sharpness of the crack tip. Pre-cracking was done using a hack-saw and the wire EDM
© 2016, IRJET | Impact Factor value: 4.45 | ISO 9001:2008 Certified Journal | Page 1061
Dimensions of rectangular beam:Length of the beam = 500 mm Breadth of the beam =25 mm Thickness = 25 mm
Notch length = 3 mm
3.2 EXPERIMENTAL SETUP:
Four point bending test has been done on Instron 8502. This type of loading confirms that the mid-section of the sample where the notch located is subjected to pure bending. Beam test arrangement constituted loading the beam under four point bending up to large scale plastic deformation with periodic significant unloading so as to create a beach mark on the crack surface. The load is given in the form of sinusoidal wave.
The load range considered for the fatigue crack growth test was of the order of 11 KN(maximum and minimum 1100N) which is below the yield strength of the beam material (EN8 STEEL) corresponding to given notch dimensions. This is to ensure that the crack growth is under gross elastic conditions.
Figure 9. Schematic diagram for four point bending test
For the EN8 beam the graph showing the variation of crack length with the number of cycles is plotted below:
2000 3000 4000 5000 6000 7000 8000 9000 No. of cycles
Figure 10.Crack length vs No. of cycles for EN8 steel
3.3 SIMULATION ON FRANC2D:
FRANC2D is a two dimensional, finite element based program for simulation of curvilinear crack propagation in planar structures. Other 2D finite element programs can also be used as a pre-processor for FRANC2D provided the data can be converted to FRANC2D input. CASCA is a simple pre-processor for FRANC2D. CASCA and FRANC2D softwares were developed by Cornell Fracture Group of Cornell University, NY (Ithaca).
Simulation techniques for both the methods stated above are as follows:
1.CASCA pre-processor was used to create geometrical layout of the beam of required dimension and a mesh pattern was generated for the same.
Figure 11.Mess generated in Casca
2.The mesh generated in CASCA was then saved as a file that can be reopened in FRANC2D for simulation process. 3.After the file was saved and exited from CASCA, FRANC2D was opened. The mesh file saved in CASCA was then opened in FRANC2D.
4.The problem type was then defined and appropriate material properties were set for the beam material considered by following command sequence.
PROBLEM TYPE =>PLANE STRESS
for material option command MATERIAL was selected. Corresponding values of thickness, Young’s modulus, Poisson’s ratio was given by selecting THICKNESS, E and NU option respectively.
5.After returning from the materials page, the element stiffness matrices is required to be reformulated. ELEM STIFF option was used for this. Then file was saved. 6.Then the boundary conditions were specified. This was done by selecting PRE-PROCESS and then FIXITY. Two nodes were fixed approximately in X or Y direction. The tolerance window given below is used to adjust the size of the box containing the node.
7.After providing the boundary conditions, loads were given by selecting LOADS→POINT LOAD. Then the corresponding values of load were entered and point of loading was specified for both the simulations
© 2016, IRJET | Impact Factor value: 4.45 | ISO 9001:2008 Certified Journal | Page 1062
9. After the analysis, DEFORMD MESH option was used tosee if the boundary conditions were properly given. Then selecting the POST-PROCESS option, followed by CONTOUR option which provided us with various colour stress contours to indicate effective stress(EFF STRESS), principle tensile stress(SIG 1), shear stress(TAU MAX) etc.
Figure 12.Deformed mess after applying boundary conditions and Load
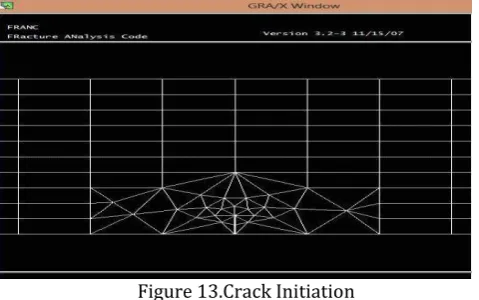
[image:6.595.38.278.402.552.2]10.Now crack was put in the beam. Crack was initiated by selecting MODIFY→NEWCRACK→NONCOHESIVE→EDGE CRACK. The crack location was specified inthe middle of the beam. Crack length was then entered and theminimum number of elements along crack extension was taken as 2. Then ACCEPT option was selected. Re-meshing of nodes takes place.
Figure 13.Crack Initiation
11.For this new structure, new analysis was performed by selecting ANALYSIS>LINEAR>DIRECT STIFF. A report on the model was generated.
12.Then FRACT MECH option was selected and the stress intensity factors were computed using J integral technique (J-INTEGRAL), displacement correlation technique (DSP CORR SIF) and modified crack closure technique (MD CRK-CLOS). The three techniques gave the similar values.
13.Now the crack was propagated from the crack tip. This was done by selecting
[image:6.595.307.561.513.672.2]MODIFY>MOVE CRACK>AUTOMATIC. CRACK INCR option was chosen togive the amount of crack growth at each step and crack increment value per step was specified. The number of propagation steps was set by using STEPS option. Then PROPAGATE option was selected to begin crack propagation.
Figure 14. Fatigue Crack Propagation
14.Then the file was saved using WRITE option.
15.Now the fatigue crack growth analysis was done by selecting POST –PROCESS and FRACT MECH options. SIF HISTORY option was used to find the stress intensity factor. A KI vs. crack length graph was generated.
16. Now, fatigue analysis was done by using the FATIGUE PLTS option. Since it is based on Paris model, constants (C and m)are provided using SET C and SET m option. Then the CYCLE PLOT option created a plot of the number of load cycles as a function of crack length.
RESULTS AND DISCUSSIONS:
4.1STRESS INTENSITY FACTOR HISTORY FROM FRANC2D
The variation of stress intensity factor was plotted as a function of crack length using FRANC2D.
Figure 16. SIF History for EN8 steel beam
Units of crack length and KI in above plots are inch and Mpa√m. as all the units taken in simulation process were mm, Mpa.
4.2 CYCLE PLOT FROM FRANC 2D:
© 2016, IRJET | Impact Factor value: 4.45 | ISO 9001:2008 Certified Journal | Page 1063
the variation in the number of cycles during the course ofcrack propagation
.
Figure 16. Cycle plot for EN8 steel Beam 4.3 EXPERIMENTAL DATA vs FRANC 2D DATA
After simulation the data are obtained from franc 2d. Experimental data and franc 2D data have been compared.
[image:7.595.36.284.138.282.2]10000 100000 1000000
Figure 17.Crack length vs No of cycles
CONCLUSION:
By using conformal transform method the pipe is converted into a beam. But the problem here is that the crack obtained due to conversion is not through the plate. So it is impossible to simulate it in franc 2D as it is a two dimensional software. For pipe crack growth simulation a 3D software is required since the crack is not a through-crack. For beam, the Franc 2D data are verified with respect to experimental data. The graph above shows that the ratio a/W up to 0.164 has given satisfactory results as till this point the actual fatigue crack growth is less than the predicted crack growth. So, it is safe. Beyond that limit, actual fatigue crack growth is more than the predicted one.
REFERENCES:
1.Wallbrink C.D., Peng D. and Jones R. (2003). Assessment of partly circumferential cracks in pipes. International Journal of Fracture (2005): 167-181.
2. Toshihiko Ono and Kohichi Tanaka: “Effective of Scribing wheel dimensions on the cutting of AMLCD
glass substrates” Technical Information Paper, Corning Incorporated, 306, November 2004.
3.Vijayakumar, K. and Atluri, S.N. (1981). Embedded elliptical crack in an infinite solid subject to arbitrary crack-face tractions. Journal of Applied Mechanics,
Transactions ASME 48, 88–96.
4.Materials science and engineering. William D. Callister, Jr. , Department of metallurgical engineering, The university of Utah.
5. G. E. Dieter, Mechanical Metallurgy, Third Edition, McGraw-Hill, New York, 1986.
6.P. C. Paris and F. Erdogan, Trans. ASME J. Basic. Eng., Vol. 85, pp. 528-534, 1963.
7. S. M. Beden, S. Abdullah and A. K. Ariffin. Review of Fatigue Crack Propagation Models for Metallic Components . European journal of scientific research (2009): 4 – 6.
8.W.D.Pilkey, Peterson’s Stress Concentration Factors, 2nd Edition, John Wiley & Sons, 1997.
9.Stress Intensity Factors Handbook, Vol. 1, Committee on Fracture Mechanics, The Society of Material Science, Japan, Pergamon Press (1986).
10.Anthony Andrews and Peter Folger-Nuclear Power Plant Design and Seismic Safety Considerations, Congressional Research Service, 2012
11.Sharif Rahman- “Probabilistic elastic-plastic fracture analysis of circumferentially cracked pipes with finite-length surface flaws” Nuclear Engineering and Design, 195 (2000) 239-260.
BIOGRAPHIES
K.SrinivasaRao. Assistant Professor.
Dept of Mechanical Engineering.
V.R.Siddhartha Engineering College, Vijayawada - 520 007
G. Sai Meghana. Final Year B-Tech
Dept of Mechanical Engineering.
© 2016, IRJET | Impact Factor value: 4.45 | ISO 9001:2008 Certified Journal | Page 1064
Shaik Umar.Final Year B-Tech
Dept of Mechanical Engineering.
V R Siddhartha Engineering College, Vijayawada - 520 007
K.Mounika Chowdary. Final Year B-Tech
Dept of Mechanical Engineering.
V R Siddhartha Engineering College, Vijayawada - 520 007
N.Krishna Reetika, Final Year B-Tech
Dept of Mechanical Engineering.
V R Siddhartha Engineering College, Vijayawada - 520 007