http://dx.doi.org/10.4236/ijis.2015.52007
How to cite this paper: Xu, Z.L., Yang, K.F. and Li, Y.J. (2015) A Physiologically-Based Adaptive Three-Gaussian Function Model for Image Enhancement. International Journal of Intelligence Science, 5, 72-79.
http://dx.doi.org/10.4236/ijis.2015.52007
A Physiologically-Based Adaptive
Three-Gaussian Function Model
for Image Enhancement
Zilong Xu, Kaifu Yang, Yongjie Li*
Key Laboratory for Neuroinformation of Ministry of Education, School of Life Science and Technology, University of Electronic Science and Technology of China, Chengdu, China
Email: *[email protected]
Received 1 December 2014; accepted 25 December 2014; published 13 January 2015
Academic Editor: Prof. Zhongzhi Shi, Institute of Computing Technology, Chinese Academy of Sciences, China
Copyright © 2015 by authors and Scientific Research Publishing Inc.
This work is licensed under the Creative Commons Attribution International License (CC BY).
http://creativecommons.org/licenses/by/4.0/
Abstract
Image enhancement is an important pre-processing step for various image processing applica-tions. In this paper, we proposed a physiologically-based adaptive three-Gaussian model for image enhancement. Comparing to the standard three-Gaussian model inspired by the spatial structure of the receptive field (RF) of the retinal ganglion cells, the proposed model can dynamically adjust its parameters according to the local image luminance and contrast based on the physiological findings. Experimental results on several images show that the proposed adaptive three-Gaussian model achieves better performance than the classical method of histogram equalization and the standard three-Gaussian model.
Keywords
Image Enhancement, Receptive Field, Visual System, Three-Gaussian Model
1. Introduction
Images play an important role in transferring information. In order to obtain more information from collected images, image enhancement techniques are commonly required to improve image quality. Traditional image enhancement methods can be roughly divided into two categories: 1) spatial domain methods, such as gray-level transformation, piecewise-linear transformation, and histogram equalization, etc. 2) frequency domain methods,
which include high-pass filtering, high-frequency emphasizing filtering, and homomorphic filtering etc. How-ever, these methods mentioned above are in general difficult to balance well among various requirements of image quality, such as contour enhancement, dynamic range, denoising and so on. In addition, the ability of tra-ditional image enhancement methods is far behind the human visual system in almost all aspects.
Early physiological studies have revealed that the retinal ganglion cells have a receptive field (RF) consisting of concentric regions, i.e., an approximately circular center and an annular surround [1] [2]. DOG model was proposed by Rodieck to describe the classical receptive field (CRF) of the ganglion cells [1]. Li et al. found that the cells at some distance from the contrast borders were less affected, while the border enhancement might be-come quite stronger when the centre was close to the corner of a bright contour [2]. Ramachandran found that the luminance gradients of an area are essential for producing perception of three-dimensional visual scenes [3]. By analyzing the length-response functions of lateral geniculate neurons in the cat, Li et al. have demonstrated an extensive disinhibitory region (DIR, i.e., non-CRF) outside the classical inhibitory surround of the receptive field [4]. According to this finding, a three-Gaussian function model was proposed in [5]. By setting appreciate parameters of the three-Gaussian model, good fit could be obtained almost for all data that show disinhibitory phenomenon [5]. Functionally, the three-Gaussian model can not only enhance the edge information but also transmit brightness information with low spatial frequency [5][6].
However, the three-Gaussian model cannot dynamically adjust its parameters according to the local stimulus. In fact, the adaptation to the stimulus features (e.g., the luminance contrast) of the receptive field in the visual system has been deeply studied [7]-[12]. Some experiments [7] showed that the responses of retinal ganglion cells first increased abruptly, and then decayed exponentially to a lower value following the abrupt increase in stimulus contrast. Based on extracellular recordings from 69 LGN cells in the anesthetized cat, Nolt et al. found that the spatial summation within their receptive fields was dependent on the contrast of the stimuli presented. They reported that the contrast-dependency in the retinal ganglion cells directly resulted from a reduction in the size of the center mechanism due to an increase in contrast [8]. By characterizing the adaptation of neurons in the cat lateral geniculate nucleus (LGN) to changes in stimulus contrast and correlations, Lesica et al. found that the space constant of the excitatory center increased with a decreasing in stimulus contrast [9]. In addition, it has been shown that spatial summation in the primary visual cortex of the cat and monkey is strongly dependent on stimulus contrast; the area (length and width) over which responses summate generally increases as the stimulus contrast decreases; fitting summation curves with a DOG model shows that this contrast-dependent spatial summation seems to derive from a change in the actual size of the receptive field [10]-[12].
To simulate the dynamic properties of the RF, in this work we present an adaptive three-Gaussian function model to automatically adjust its parameters according to the properties of local stimulus, i.e., local contrast and luminance, for image enhancement.
2. Computational Model
2.1. Three-Gaussian Function Model
Figure 1 shows the model of three-Gaussian model, in which the center and surround denote respectively the excitatory region (Center) and inhibitory region (Surround) of CRF. The disinhibitory region usually covers a larger range of visual field. The response amplitude of cells with stimulus radius is shown in the top-right corner of Figure 1. The three-Gaussian function model is described as [5]
(
)
(
)
(
)
(
)
2 2
2 2 2 2
2
2 2
3
1 2
1 2 3
, e e e
x y
x y x y
f x y A σ A σ A σ
− +
− + − +
= − + (1)
where A1 and σ1 are the strength and space constant of the excitatory center, A2 and σ2 are the strength
and space constant of the inhibitory surround, and A3 and σ3 are the strength and space constant of the
dis-inhibitory outer-surround region.
sur-round mechanisms in the DOG model of most cells [5].
2.2. Adaptive Mechanism
Based on the experimental findings about the stimulus-dependant RF properties, we specifically introduce two dynamic RF features: 1) the excitatory strength of the center (A1) increases nonlinearly with the increasing of the local contrast; 2) the inhibitory space constant (σ2) of the RF surround is decreased with the increasing of
the local luminance.
In this paper, we define the feature of local luminance contrast as the standard deviation within a small image patch around each pixel in the image. We denote local luminance contrast as Con. In addition, we use a mod-ified sigmoid function to simulate the nonlinear transformation of neural information. The relationship between
1
A and Con is experimentally defined as
( )
1 10 0.5
1 6
1 e Con
A = + − × −
[image:3.595.245.381.318.499.2]+ (2)
Figure 2 shows the relationship of center excitation (A1) along with the local contrast (Con).
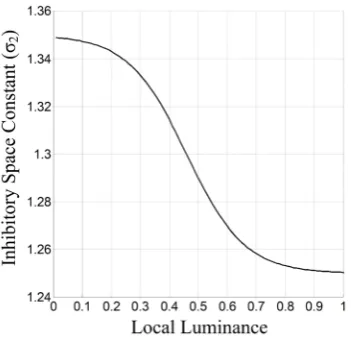
On the other hand, in order to improve the contrast of shading regions of the image, another parameter (σ2) is
[image:3.595.227.403.534.696.2]adjusted with local luminance. In our adaptive three-Gaussian function model, we can reduce inhibitory space constant (σ2) to weaken the surround inhibition when the luminance value of the pixel to be processed is high.
Figure 1. The spatial strucutre of the receptive field of the ganglion cells and LGN cells.
Figure 2. The relatinship of center excitatory (A1)
We use L to denote local luminance value of each pixel in the image. Similar to Equation (2), we also em-ploy a modified sigmoid function to represent the relationship between the inhibitory space constant (σ2) and
the local luminance feature. The relationship between σ2 and L is experimentally defined as
( )
2 10 0.45
0.1 1.25
1 e L
σ = + × −
[image:4.595.227.403.525.695.2]+ (3)
Figure 3 shows the relationship between σ2 and L. Note that a simple smoothing filtering is applied on the
map of Con and L to removing noises.
As described in Equations (2) and (3), the kernel idea of our adaptive three-Gaussian model is that two im-portant parameters (i.e., A1 and σ2 in Equation (1)) are adaptively adjusted based on the features of local
contrast and local luminance, respectively.
It should be pointed out that the curves in Figure 2 and Figure 3 are sigmoid shaped, because sufficient ex-perimental evidence indicates that the change of receptive field properties (e.g., the sensitivity and spatial size) with the stimulus features (e.g., the luminance contrast) seems nonlinear [7]-[12]. Note that the constants in Eq-uations (2) and (3) determining the shapes of the sigmoid curves (e.g., the slope) were experimentally obtained and we have found that these settings are suitable for most of the real-world images, as indicated by several examples shown in the next section.
3. Results
In this experiment, we compared our adaptive three-Gaussian method with the popular method of histogram equalization and the standard (non-adaptive) three-Gaussian model. Experimental results on several images are shown in Figure 4, Figure 5, Figure 6, and Figure 7. Note that the zoomed in view of each test image is also listed in Figures 4-7, respectively. From the figures, the results of the standard three-Gaussian model usually in-clude more details than original images, but some regions are over-enhanced (especially in the high contrast place); in addition, the contrast of high-light and shading regions are not enhanced enough. Histogram equaliza-tion is efficient in adjusting global dynamic range of images, but it is difficult to obtain good local contrast. In addition, three-Gaussian model usually obtains better performance than histogram equalization.
Our adaptive three-Gaussian function model performs better in both enhancing the local contrast and adjust-ing global dynamic range. Meanwhile, the proposed method is capable of overcomadjust-ing the phenomenon of over- enhancement. In addition, the performance of our new approach in edge enhancement is much better than the other two methods mentioned above, which can be clearly seen from Figures 4-7, especially from the zoomed in view of each test image.
For quantitative comparison, we employed EME (a measure of enhancement) [13] and SNR (Signal to Noise Ratio) [14] for performance evaluation of image enhancement. SNR is usually defined as the mean target signal to the standard deviation of the noise [13]. In this paper, we define E as the mean value of the all pixels in the
Figure 4.Results on the Lenna image. (a) Original image; (b) Results of histogram equalization; (c) Results of three-Gaussian function model; (d) Results of the proposed method (adaptive three-Gaussian function model). The zoomed in view of the patch in the red rectangle is also shown for each image.
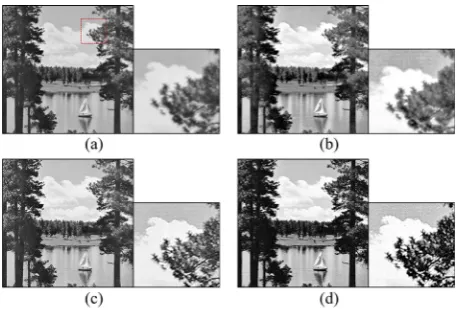
Figure 5. Results on the Goldhill image. (a) Original image; (b) Results of histogram equalization; (c) Results of three- Gaussian function model; (d) Results of the proposed method (adaptive three-Gaussian function model).
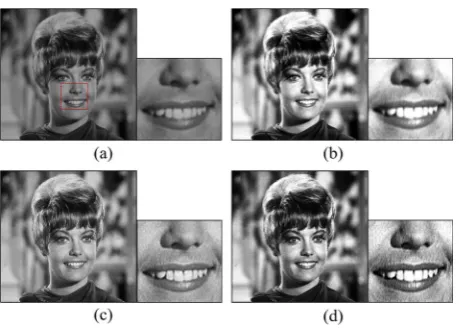
[image:5.595.199.428.520.675.2]Figure 7.Results on the Zelda image. (a) Original image; (b) Results of histogram equalization; (c) Results of three-Gaussian function model; (d) Results of the proposed method (adaptive three-Gaussian function model).
image and σ as the standard deviation of the all pixels in the image. Therefore, SNR is computed as
10 2
10 log E
SNR
σ
= (4)
EME is computed as [14]
2 1
max, , min, , 1 1
1 2 max, , min, ,
1
20 ln
k k
k l k l
l k k l k l
V V
EME
k k = = V V c
− =
+ +
∑∑
(5)where Vmin,k,l and Vmax,k,l are respectively the minimum and maximum inside a certain block w(k,l) when the
whole image is split into k1k2 blocks w(k,l) of equal sizes. c is a small constant that equals to 0.0001 to avoid
di-viding by zero. In general, a higher EME indicates a better enhancement in image details.
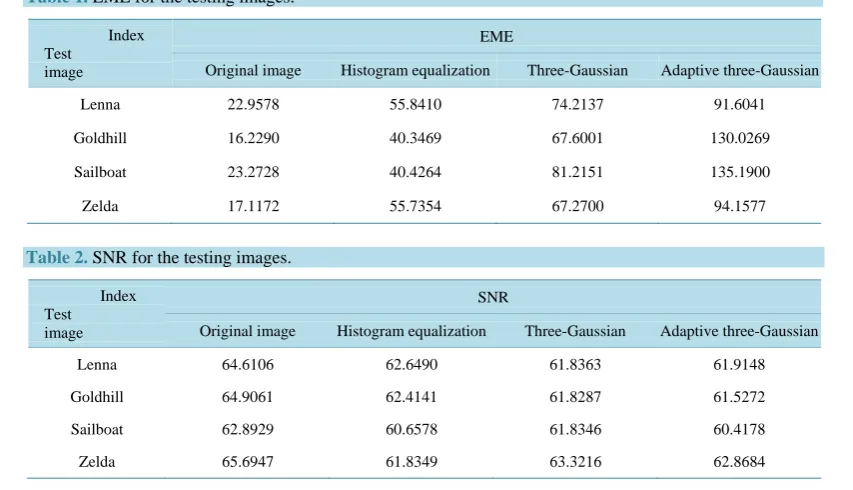
EME and SNR of four considered images shown in Figures 4-7 are listed in Table 1 and Table 2. Note that the EME and SNR were calculated from the whole images. From Table 1, the evaluation of EME shows that our adaptive three-Gaussian function model obtains the best performance on edge enhancement. From Table 2, we can see that our new approach achieves competitive performance compared with the standard three-Gaussian function model and histogram equalization in suppressing image noise. This indicates that our adaptive model can well balance the requirements of enhancing edges and inhibiting image noises.
4. Discussion
It is generally accepted that the computational image processing methods are far behind the human visual sys-tem. They met difficulties to balance well among various requirements of image quality, e.g., contour enhance-ment and denoising which often cannot be well achieved at the same time. By seeking inspiration from the phy-siological findings, this paper proposes a phyphy-siologically based adaptive three-Gaussian model, which dynami-cally adjusts the parameters of the three-Gaussian model. The results on several real-world images show that the performance of our new model is better than the standard three-Gaussian function model, especially in over-coming over-enhancement and raising the contrast of highlight and shading regions. Our approach can keep the SNR of an image in an acceptable level; meanwhile, it can effectively enhance the edge profiles and local details of the image. Specifically, in the regions of low luminance, we increase the excitatory strength (A1) in the
re-gions with high local contrast, which helps enhance the edges with high contrast. Differently, we increase the inhibitory space constant (σ2) in the regions of low brightness, which helps improve the contrast of shading
re-gions.
Our physiologically-based adaptive three-Gaussian function model only simulates the change of inhibitory space constant (σ2) and excitatory strength (A1) based on the local contrast and local brightness, and don’t
in-volve inhibitory strength (A2) and excitatory space constant, (σ1) which should be improved in the future work.
Table 1. EME for the testing images.
Index Test
image
EME
Original image Histogram equalization Three-Gaussian Adaptive three-Gaussian
Lenna 22.9578 55.8410 74.2137 91.6041
Goldhill 16.2290 40.3469 67.6001 130.0269
Sailboat 23.2728 40.4264 81.2151 135.1900
[image:7.595.100.498.101.329.2]Zelda 17.1172 55.7354 67.2700 94.1577
Table 2. SNR for the testing images.
Index Test image
SNR
Original image Histogram equalization Three-Gaussian Adaptive three-Gaussian
Lenna 64.6106 62.6490 61.8363 61.9148
Goldhill 64.9061 62.4141 61.8287 61.5272
Sailboat 62.8929 60.6578 61.8346 60.4178
Zelda 65.6947 61.8349 63.3216 62.8684
Acknowledgements
The authors would like to thank Professor Chaoyi Li for his valuable suggestions. The authors also thank the anonymous reviewers for their helpful comments. This work was supported by the 973 project (#2013CB329401) and the NSFC of China (#61375115 and #91120013).
References
[1] Rodieck, R.W. (1965) Quantitative Analysis of Cat Retinal Ganglion Cell Response to Visual Stimuli. Vision Research,
5, 538-601. http://dx.doi.org/10.1016/0042-6989(65)90033-7
[2] Li, C.I., Chang, Y.J., Chen, P.S., Hsu, H.C. and Wang, H. (1979) Role of Sustained Neurones of Cat Lateral Geniculate Nucleus in Processing Luminance Information. Scientia Sinica, 22, 359-371.
[3] Ramachandran, V.S. (1988) Perceiving Shape from Shading. Scientific American, 259, 76-83.
http://dx.doi.org/10.1038/scientificamerican0888-76
[4] Li, C.-Y., Zhou, Y.-X., Pei, X., Qiu, F.-T., Tang, C.-Q. and Xu, X.-Z. (1992) Extensive Disinhibitory Region beyond the Classical Receptive Field of Cat Retinal Ganglion Cells. Vision Research, 32, 219-228.
http://dx.doi.org/10.1016/0042-6989(92)90131-2
[5] Li, C.-Y., Pei, X., Zhow, Y.-X. and Von Mitzlaff, H.-C. (1991) Role of the Extensive Area outside the X-Cell Recep-tive Field in Brightness Information Transmission. Vision Research, 31, 1529-1540.
http://dx.doi.org/10.1016/0042-6989(91)90130-W
[6] Keil, M.S., Cristobal, G. and Neumann, H. (2001) A Neurodynamical Retinal Network Based on Reaction-Diffusion Systems. Proceedings of 11th International Conference on Image Analysis and Processing, Palermo, 26-28 September 2011, 209-214.
[7] Smirnakis, S.M., Berry, M.J., Warland, D.K., Bialek, W. and Meister, M. (1997) Adaptation of Retinal Processing to Im-age Contrast and Spatial Scale. Nature, 386, 69-73. http://dx.doi.org/10.1038/386069a0
[8] Nolt, M.J., Kumbhani, R.D. and Palmer, L.A. (2004) Contrast-Dependent Spatial Summation in the Lateral Geniculate Nucleus and Retina of the Cat. Journal of Neurophysiology, 92, 1708-1717. http://dx.doi.org/10.1152/jn.00176.2004
[9] Lesica, N.A., Jin, J.H., Weng, C., Yeh, C.-I, Butts, D.A., Stanley, G.B., et al. (2007) Adaptation to Stimulus Contrast and Correlations during Natural Visual Stimulation. Neuron, 55, 479-491.
http://dx.doi.org/10.1016/j.neuron.2007.07.013
[10] Kapadia, M.K., Westheimer, G. and Gilbert, C.D. (1999) Dynamics of Spatial Summation in Primary Visual Cortex of Alert Monkeys. Proceedings of the National Academy of Sciences of the United States of America, 96, 12073-12078.
[11] Song, X.-M. and Li, C.-Y. (2008) Contrast-Dependent and Contrast-Independent Spatial Summation of Primary Visual Cortical Neurons of the Cat. Cerebral Cortex, 18, 331-336. http://dx.doi.org/10.1093/cercor/bhm057
[12] Chen, K., Song, X.-M. and Li, C.-Y. (2013) Contrast-Dependent Variations in the Excitatory Classical Receptive Field and Suppressive Nonclassical Receptive Field of Cat Primary Visual Cortex. Cerebral Cortex, 23, 283-292.
http://dx.doi.org/10.1093/cercor/bhs012
[13] Agaian, S.S., Panetta, K. and Grigoryan, A.M. (2000) A New Measure of Image Enhancement. IASTED International Conference on Signal Processing & Communication, Marbella, September 2000, 19-22.