Volume 72– No.2, May 2013
Performance Evaluation of Texture based Image Retrieval
P.S. Malge
Pasnur M.A.
Associate Professor, Lecturer,
Electronics Engg. Department, Electronics Engg. Department ,
Walchand Institute of Technology, Solapur Walchand Institute of Technology, Solapur
ABSTRACT
This paper presents a novel content based image retrieval (CBIR) system based on Haar Wavelet Transform. Content Based Image Retrieval (CBIR) has been an active research area. The CBIR is to retrieve the images based on a query image, which is specified by content, from the given collection of images. Current system uses texture as a visual content for feature extraction. The present work uses modified Haar wavelet transformation for feature extraction of an image. Here Haar wavelets constructs the feature vector of size ten, characterizing texture feature of the images, only in three iterations of the wavelet transforms. The K Means Clustering Algorithm is then used to cluster the group of images based on feature vector of images by considering the minimum Euclidean distance. The performance evaluation of the present method is done by Precision and Recall for different databases.
Keywords
Content based Image Retrieval, Haar Wavelet Transform, Feature Extraction, Wavelet Transform, K Means Clustering Algorithm.
I.
I
NTRODUCTIONContent based image retrieval is emerging as an important research area with application to digital libraries and multimedia databases. Content based image retrieval is a technique, which uses visual contents to search images from large scale image databases according to user’s interests, that is, when a query is given by user. Query Image is the users target image for the searching process. CBIR systems operate in two phases: indexing and searching. In the indexing phase, each image of the database is represented using a set of image attribute, such as color, shape, texture and layout. Extracted features are stored in a feature database. In the searching phase, when a user makes a query, a feature vector for the query is computed. Using a similarity criterion, this vector is compared to the vectors in the feature database. The images most similar to the query are returned to the user [18].
Texture is an important visual property that characterizes a wide range of natural and artificial images which makes it a useful feature for retrieving images [20]. Texture is a way a surface, material or a substance feels when we touch it. It gives the spatial arrangement of color or intensities in an image. The proposed paper uses texture of the image as the content to retrieve. And also Haar Wavelet Transform is used to calculate the feature vector of images for Texture Based Image Retrieval.
The outline of the paper is as follows. The proposed method of feature extraction using Haar Wavelet Transform and K Means Clustering Algorithm is presented in section II and III respectively. Performance evaluation and experimental resultsare presented in section IV and V respectively. Finally, conclusions are presented in section VI
II.
F
EATUREE
XTRACTION USINGH
AARW
AVELETT
RANSFORMHaar wavelet is the simplest wavelet. Haar transform or Haar wavelet transform has been used as an earliest example for orthonormal wavelet transform with compact support. The Haar wavelet transform is the first known wavelet and was proposed in 1909 by Alfred Haar [3].
The objective of the proposed method is to perform the discrete Haar wavelet transformation on an image for the purpose of Feature Extraction. The Haar wavelet transformation is composed of a sequence of low-pass and high-pass filters, known as a filter bank. The low pass filter performs an averaging/blurring operation, and is expressed as:
1
1,12
H
and the high-pass filter performs a differencing operation and can be expressed as:
1
1, 1
2
G
on any adjacent pixel pair.
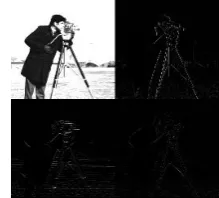
The result of the complete transformation is composed of 4 new sub-images, which corresponds to the blurred image, and the vertical, diagonal, and horizontal differences between the original image and the blurred image. The blurred representation of the image removes the details (high frequency components), which are represented separately in the other three images, in a manner, that produces a sparser representation overall, making it easier to store and transmit. Below is an example of a wavelet transformed image portraying the four sub-images as explained above
Fig. 1 Original image A
After transformation, the result is as shown below
[image:1.595.351.461.649.748.2]Volume 72– No.2, May 2013 Haar Wavelet Transform is mainly used for image compression
and feature extraction. Its forward and reverse transform requires simple manual calculations of addition and subtraction. Haar Wavelet Transform is simple and they are fastest to compute transformation. The present paper proposed the modified Haar wavelet transformation that reduces signatures only to 10 for the image, only in three iterations. Here it applies Haar Wavelet Transform to Texture based Images. This can also be extended to other features of the images [9].
In the feature vector computation process, apply Wavelet Transformations only three times to get 10 sub images of input image in the following way:
Fig.3 After applying Haar Wavelet Transformation for 3 iterations
Flowchart for calculating wavelet signatures:
The Wavelet signature (texture feature representation) [9] is computed from sub image as follows,
Where fr is the computed Wavelet signature (texture feature representation) of the sub image, Cij is the representation of the intensity value of all elements of sub image and i × j is the size of the sub image.
Below are the transformation applied to elephant image and fan image. And also the feature vector for the same are calculated.
1. Elephant Image:
Fig.4 Elephant Image Fig.5 Transformed Image
Table 1 Feature Vector
2. Fan Image:
Fig.6 Fan Image Fig.7 Transformed Image
Table 2 Feature Vector
III.
K
M
EANSC
LUSTERINGA
LGORITHMClustering is to partition data points into clusters such that the data points within the same group are similar to each other, while the data points in different groups are dissimilar [17]. Many clustering methods have been successfully used for image clustering to better organize, represent and browse images, as well as to improve the performances of related applications, such as Content Based Image Retrieval (CBIR), image annotation, and image indexing [14].
Clustering algorithms can be broadly divided into two groups: hierarchical and partitional [15]. Hierarchical clustering methods produce a hierarchy of clusters from small clusters of very similar items to large clusters that include more dissimilar items. Hierarchical methods usually produce a graphical output known as a dendrogram or tree that shows the hierarchical clustering structure. Some hierarchical methods are divisive, that progressively divides one large cluster comprising all of the data into two smaller clusters, and repeats this process until all clusters have been divided. Other hierarchical methods are agglomerative, and work in the opposite direction by first finding the clusters of the most similar items and progressively adding less similar items, until all items have been included into a single large cluster. Partitional clustering algorithms find all the clusters simultaneously as a partition of the data and do not impose a hierarchical structure [15]. A partitioning method constructs k clusters. That is, it classifies the data into k groups, which together satisfy the requirements of a partition:
1. Each group must contain at least one object.
2. Each object must belong to exactly one group.
The most well-known hierarchical algorithms are single-link and complete-link; the most popular and the simplest partitional algorithm is K-means.
A clustering method that doesn’t require computation of all possible distances is k-means clustering [16]. It differs from hierarchical clustering in several ways. The only requirement is
Feature Vector I1 11.8752377134924 I2 5.41664632157638 I3 12.3515069080817 I4 31.9682306898192 I5 13.6217384284276 I6 32.1490345858890 I7 1141.02469663781 I8 78.0871068259121 I9 33.1748473335669 10 76.1246941220507
Feature Vector I1 25.8946743512571 I2 18.2694422664470 I3 25.3258822335099 I4 46.0040824046672 I5 35.8975981899008 I6 44.8131888947419 I7 912.461052440523 I8 80.4881318941731 I9 50.8741859914532 10 97.2851207243712
Image I of size r * r
Divide Image I based on Haar Wavelet Transform into I111, I112, I113 and I114 of size r/2 * r/2
Compute signatures fr for I111, I112 and I113
Divide image I111 into I11, I12, I13, and I14 of size r/4 * r/4
Compute signatures fr for I12, I13, I14
Divide image I11 into I1, I2, I3 and I4 of size r/8 * r/8
Obtain 10 signatures and stop I1 I2 I12
I4 I3 I112
I14 I13
Volume 72– No.2, May 2013 that, the user has to know in advance the number of clusters
required. And also the analysis has to rerun for many times, till the objects are placed in a proper cluster. The algorithm repeatedly reassigns objects to clusters, so the same object can move from cluster to cluster during the analysis [17].
The basic step of k-means clustering is simple. In the beginning, determine number of cluster K and assume the centroid or center of these clusters. Here any random objects can be chosen as the initial centroids or the first K objects can also serve as the initial centroids. Then the K means algorithm will do the three steps below until convergence.
Algorithm for K Means Clustering: 1. Determine the initial K centroids.
2. Determine the distance of each object to the centroid.
3.Find the closest centroid to objects based on minimum Euclidean distance and group the objects.
K-means is a clustering method which is known for its efficiency in producing accurate results in image retrieval. By using K-means user can select the closer group of image so that they get fast result.
Finally, query image is the image the user is interested in and wants to find similar images from the image database. The feature vector for the query image is extracted and is now compared with the image clusters. Based on minimum Euclidean distance, the target image cluster, closest to the query image is retrieved from the database.
IV.
P
ERFORMANCEE
VALUATIONThe retrieval efficiency of the proposed system is evaluated by using the performance measure, Recall and Precision. Recall measures the ability of the system to retrieve all the models that are relevant, while precision measures the ability of the system to retrieve only the models that are relevant.
Precision=
Recall=
V.
E
XPERIMENTALR
ESULTSFor the proposed method, experiments are performed on AMD Quad Core Processor in Windows XP Environment and on Matlab 7.5 Platform. The experiments are performed by varying the database to different sizes. The images are downloaded from “google” and it consists of varieties of images like elephants, neck ties, rock images, fans, rackets, bottles, tables images, etc. Below are the results of precision and recall for different databases.
1. Database of 50 and number of Clusters varying from 2 to 12:
Table 3. Precision and Recall for Database of 50
No. of
Clusters Precision Recall
2 100 100
3 89.46 85.53
4 82.65 71.66
5 81.428 78
6 79.62 81.07
7 73.73 72.97
8 74.32 75.83
9 73.27 72.22
10 74.63 70
11 68.72 65.9
12 72.22 64.16
Fig. 8 Precision Vs Recall for Database of 50
2. Database is varied from 50 to 100 and number of Clusters equal to 7:
Table 4. Precision and Recall for Database of 50 to 100
Database Images Precision Recall
50 73.73 72.97
60 73.17 74.4
70 70.61 70.11
80 59.28 59.16
90 56.19 56.73
100 58.97 58.76
Fig. 9 Precision Vs Recall for Database of 50 to 100
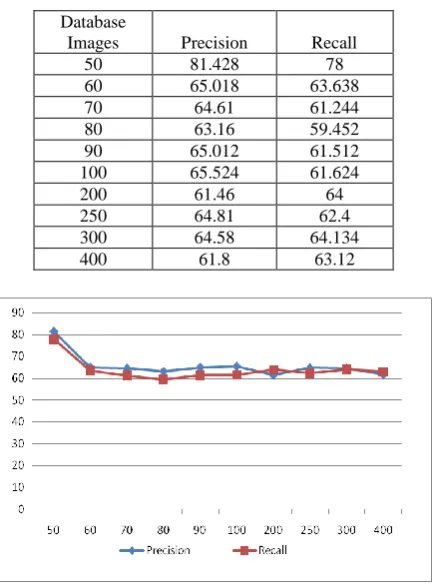
Volume 72– No.2, May 2013 Table 5. Precision and Recall for Database of 50 to 400
Database
Images Precision Recall
50 81.428 78
60 65.018 63.638
70 64.61 61.244
80 63.16 59.452
90 65.012 61.512
100 65.524 61.624
200 61.46 64
250 64.81 62.4
300 64.58 64.134
[image:4.595.55.273.91.384.2]400 61.8 63.12
Fig. 10 Precision Vs Recall for Database of 50 to 400
4. Database of 400 and number of Clusters varied from 4 to 6:
Table 6. Precision and Recall for Database of 400
No. of Clusters Precision Recall
4 64.40 66.16
5 61.8 63.12
6 53.71 52.06
Fig. 11 Precision Vs Recall for Database of 400
VI.
C
ONCLUSIONHere in the proposed method, we have used Modified Haar Wavelet Transform for feature extraction based on texture content of the image. By deriving ten feature vectors from Haar wavelet transformation in three iterations, reduces overall time complexity. The efficiency of the present work is increased by using the K Means clustering algorithm to cluster the images in the database. It effectively minimizes the undesirable results and gives a good matching pattern, which will be having minimum set of non relevant images.
The present method is performed by varying the database to different sizes. The performance evaluation for the present work is done by precision and recall and it is observed that, best retrieval results are achieved when database is less when compared to large databases.
The present system uses texture feature for retrieval. To further improve the performance of the retrieval system, the color feature can also be considered for feature extraction. The present system uses Euclidean Distance as the similarity measure. The other future direction can be the use of City Block Distance for similarity measure.
VII.
R
EFERENCES[1] S. Saha Ray, “A New Wavelet Operational method using Block Pulse and Haar Functions for Numerical Solution of a Fractional Partial Differential Equation”, Journal of Fraction Calculus and Applications, 2011.
[2] Piotr Porwik, Agnieszka Lisowska, “The Haar Wavelet Transform in Digital Image Processing: Its Status and Achievements”.
[3] Phang Chang, Phang Piau, “Simple Procedure for the Designation of Haar Wavelet Matrices for Differential Equations”, Proceeding of the International Multiconference of Engineers and Computer Scientists 2008 Vol II, March 2008.
[4] Patrick J. Van Fleet, “ Discrete Haar Wavelet Transform”, PREP, Wavelet Workshop 2006.
[5] Anuj Bhardwaj and Rashid Ali, “ Image Compression using Modified Fast Haar Wavelet Transform”, World Applied Sciences Journal 7 (5): 647-653, 2009.
[6] P. Raviraj and M.Y. Sanavullah, “The Modified 2D-Haar Wavelet Transformations in Image Compression”, Middle-East Journal of Scientific Research 2 (2): 73-78, 2007. [7] Kamrul Hasan Talukder and Koichi Harada, “Haar Wavelet
Based approach for Image Compression and Quality Assessment of Compressed Image”, IAENG International Journal of Applied Mathematics.
[8] Rohit Arora, Madan Lal Sharma, Nidhika Birla, Anjali Bala, “An Algorithm for image compression using 2D Wavelet Transform”, International Journal of Engineering Science and Technology (IJEST).
[9] N. Gnaneshwara Rao, Dr. V. Vijaya Kumara, V Venkata Krishna, “Texture Based Image Indexing and Retrieval”, IJCSNS International Journal of Computer Science and Network Security, Vol. 9 No.5, May 2009.
[10] Iman Makaremi, “Two Dimensional Wavelet and its Applications”.
[11] Emily Brown, Samuel Picton Drake, Anthony Finn, “Wavelet Decomposition for Discrete Probability Maps” ,Department of Defence, Australian Government
[image:4.595.68.299.468.674.2]Volume 72– No.2, May 2013 [13] Dengsheng Zhang, Aylwin Wong, Maria Indrawan,
Guojun Lu, “Content - based Image Retrieval Using Gabor Texture Features”.
[14]Yi Yang, Dong Xu, Feiping Nie, Shuicheng Yan, Yue Ting Zhuang, “Image Clustering using Local Discriminant Models and Global Integration”. [15] Anil K. Jain, “Data Clustering: 50 Years Beyond K-Means”. [16] Vanita G.Tonge, “ Content Based Image Retrieval by K- Means “Clustering Algorithm” , International Journal of Engineering Science and Technology (IJEST).
[17] Cluster Analysis.
[18] Ashish Kumar Raikwar, Satbir Jain, “ Content based Image Retrieval using Clustering”, International Journal of Computer Applications, Vol.41 No.21, March 2012. [19] Leonard Kaufman, Peter J. Rousseeuw, “Finding Groups In Data: An Introduction to Cluster Analysis”, Wiley Interscience, A John Wiley & Sons, Inc., Publication. [20] P. W. Huang, S. K. Dai, “Image retrieval by texture similarity”, The Journal of Pattern Recognition Society, March 2002.