A Novel Technique for Automatic Road Distress
Detection and Analysis
Akhila Daniel
Computer Science and Engineering department SCT College of Engineering, Trivandrum, Kerala
Affiliated to Kerala University
Preeja. V
Computer Science and Engineering department SCT College of Engineering, Trivandrum, Kerala
Affiliated to Kerala University
ABSTRACT
Pavement distresses (damages) are important information for evaluating the road condition and conducting the necessary road maintenance activities. Conventional human visual pavement distress detection method is time consuming, very expensive, labour-intensive and dangerous due to exposure to traffic. Numbers of methods have been introduced for road damage detection in the context of fine structure extraction. Due to the unceasing traffic increase, the automation of pavement surface distress monitoring is more and more required. Several techniques are developed for this purpose. But all those approaches access the road condition based on cracks on roads. Due to the various climatic factors, Indian roads suffer from some other types of distresses like potholes also. The goal of this paper is to introduce a novel technique to determine the road condition based on the cracks and potholes on road surfaces. Thus a fully integrated system is proposed for the automatic detection and characterization of distresses in road and flexible pavement surfaces and to detect its severity. The main tasks involved are Collection of images, Distress Detection and Classification using Supervised training approach, Assignment of crack’s severity levels to analyze the road performance.
General Terms
Supervised Training, Feature Extraction, Crack and Pothole detection, Severity Calculation, Blob extraction
1.
INTRODUCTION
Road networks play a vital part in our daily life nowadays because it makes an important contribution to society. People cannot do their business and activities easily without good road networks. Unfortunately, pavement systems deteriorate over time due to various reasons. This deterioration to pavement increases with the fourth power of the axle load of the vehicles travelling on it. Technically, early pavement deterioration contains four different types of cracks: transverse crack, longitudinal crack, block crack and alligator crack. Potholes are formed making the road more dangerous if these early deteriorations are left untreated. Rehabilitation treatments, such as fixing potholes will cost about 10 to 20 times more than the cost of resealing cracks. Therefore, pavement detection and rating are so important to keep the cost of fixing the road deterioration low and keep the road networks in good condition.
In conventional manual road distress analysis inspectors travel along the road stops and measure the distress objects when they are found. But the procedure is time consuming, labour-intensive, dangerous, expensive, vulnerable and unable to provide meaningful quantitative information.
Several approaches for automatic road crack detection and characterization systems are available. But all those works deals with the damages of roads in countries like Australia, Sweden, New South Wales etc. and the damages on such roads are mainly cracks. But the conditions of Indian roads are somewhat different which suffers from the problem of cracks as well as potholes. Indian roads suffer from severe damages due to environmental and climatic conditions prevailed here. Most people rely on roads every day to meet various needs. Therefore, pavement detection and ratings are so important to keep the cost of fixing the road deterioration low and keep the road networks in good condition. Apart from foreign roads which have cracks as the main damage, here roads suffer from the severe problem of pothole formation. Thus a proper detection and classification system for cracks and potholes is necessary.
Here a new approach is introduced to detect the damages and to analyze the performance of Indian roads. Thus a large set of images are collected from different road networks and are enhanced. The enhancement algorithm corrects non uniform background illumination by calculating multiplication factors that eliminate the background lighting variations. The new pavement distress classification algorithm builds a data structure storing the geometry of the skeleton obtained from the threshold image. This data structure is pruned, simplified, and aligned, yielding features for distress (damage) classification. Hence the distress can be classified to different classes (potholes and cracks). The severity level of each damage can also be determined for analyzing the road performance.
2.
RELATED WORKS
There are different methods to detect the cracks in road networks. Various classification techniques are also available to classify these cracks into different groups. Different methods use different image processing tools for detection and classification.
intensity. In skeleton analysis phase several topological and geometrical features such as intersections, perimeters, directions, lengths, number of objects, etc are extracted from the image. For this a pixel by pixel scanning on the image was done. This scanning was done several times to check the presence of any of the geometrical features on the image. The final phase is the classification phase. Some rules were formulated depending on the behaviour of the feature and each distress is classified accordingly. For example, if there is few independent distresses with no loops then that may be a simple crack. Thus when each image is fed into a classifier which knows all the rules, the classifier will categorize the distress to the class to which the rule has been satisfied. Counting the number of distress pixels and image pixels and taking the ratio of these two parameters will give the severity of the distress.
Another method used for crack detection was introduced by Peggy Subirats, Jean Dumoulin et al.[2] uses a continuous wavelet transform. The algorithm works in three steps. In the first step a separable 2D continuous wavelet transform(cwt) of different scales of the images are determined. In this step the 2D cwt is performed for 0 and 90 degree directions at different scales. The mother wavelet is chosen using the Mexican hat function. The second step is the creation of complex coefficient maps. The main advantage of this complex map creation was that it makes the process of crack extraction easier since the crack portion will be darker than the surroundings. The third and final step is the segmentation of the mother wavelet coefficient maps. In this a coefficient maximum value search on the map generated on the previous step is done and asset of maxima maps are obtained. In order to remove noise some post processing procedures were needed. For this skeletonization is performed on the image. Then thresholding is applied on the image and final output image is obtained.
One method proposed by Sylvie Chambon et al. [3] introduced a 2D matched filter in order to define an adapted mother wavelet and then to use the result of this multi-scale detection into a Markov Random Field (MRF) process to segment fine structures of the image. Fine structure extraction has many advantages in different domains of image processing. Cracks may be considered as pixels that are darker than the background. The procedure includes mainly three steps. First the fine structures can be extracted from the image using a 2D matched filter which defines an adaptive mother wavelet. There are many methods for fine structure extraction such as thresholding, morphological tools, neuron networks, filtering etc. Among these methods filtering and wavelet decomposition are considered as most efficient ones. After this some refinement operations can be done on the extracted image. So the second step is segmentation of the connected components. Here the segmentation is done with Markov Random Fileds(MRF). Some post processing can be done to correct the errors that are still present in the image. The final phase is classification in which the images can be classified to different classes. The simplest classification is images with crack pixels and images without crack pixels. There may be a hierarchical classification to detect different types of cracks (transverse,longitudinal).
The method introduced later in 2009 by Henrique Oliveira and Paulo Lobato Correia [4] proposed that the crack pixels in an image are identified using dynamic thresholding technique. A classification system is also implemented to classify the cracks to different classes such as horizontal, vertical,
miscellaneous or no cracks. This is a simple unsupervised system for the detection of cracks in road surveys and their classification into predefined set of crack classes. During the preprocessing phase the image histograms are analysed and thresholding is applied for the separation of images to images which have crack and non crack pixels. For this, images are divided to non-overlapping blocks of dimension 75X75 pixels. These blocks are normalized based on the average pixel intensities with out losing crack pixel information. After that intensity variance is reduced. In the crack detection phase the entropy is calculated for each pixel block in an image. Thresholding is again applied to classify image blocks as those containing crack pixels or not. The final phase is the classification phase which follows Portugeese Distress Catalogue [5]. Classification is done using the some distances of the connected crack pixels in the 2D feature space.
Another technique, detection and classification using anisotropy measure proposed by Tien Sy Nguyen et al. [6] introduced a method which detects not only small cracks but also joints and bridged ones. After some pre-processing steps anisotropy measure is calculated to detect defects. The final classification is done using back propogation neural networks. Crack detection in road surfaces is not an easy method because of the noise unevenness in the surfaces. Most of the detection method uses the characteristic of the crack(crack pixels darker than the surroundings). Here crack detection is done using an anisotropy measure. The first phase is to detect the position of lane marking. The second phase is the calculation of continous texture anisotropy(CTA) in which the main idea is to find out a measure which takes small value in one orientations and takes big value in other orientations. Mean and Standard deviations are the two features used for the calculation of CTA. After CTA computation crack pixels can be easily detected by thresholding since CTA of crack pixels are much greater than defect free pixels. Then features are extracted from the crack pixels which can be used for the next classification phase. For that a multilayer perceptron neural network was used.
A fractional differential and wavelet transform is presented in [7], being qualitatively compared with other edge detection operators like Sobel, Prewitt, and Logarithm of Gaussian (LoG), to show its superior performance. A Sobel edge detector after image smoothing with a bidimensional empirical mode decomposition is proposed in [8] to detect cracks. The reported results use 15 images but no details about image spatial resolution are provided. The results make evident some of the challenges faced by these types of systems, with false crack region edges appearing due to the presence of white lane markings, and irregularities (more difficult to handle). These irregularities are present in this type of pavement surface due to the appearance of coarse surface aggregates caused by the loss of fine aggregates (raveling). Another author [9] evidences the difficulty of detecting cracks of less than 3 mm width when using edge detectors. A nonsubsampled contourlet transform is adopted in [10] to detect cracks where a limited set of experimental results is presented.
3.
SYSTEM ARCHITECTURE
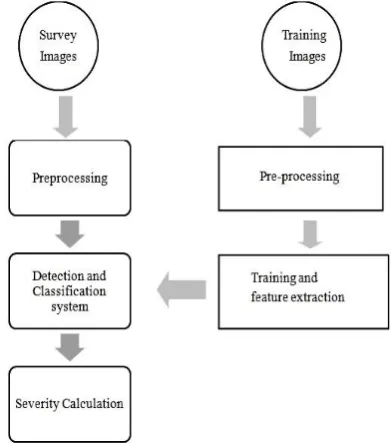
In this paper a simple supervised system for automatic distress detection and their classification is proposed. The system architecture is shown in Fig. 1.
can itself be divided into four stages (i) Collection of Images (ii) Preprocessing (iii) Pattern/Region of Interest(ROI) recognition and extraction (iv) Segmentation and feature extraction and (v) System training and classification. The first task is to collect several road surface images. A training set and test set of images should be selected from the image database. Preprocessing is used to improve the quality of the input image in order to facilitate the analysis and interpretation easier at subsequent stages. Important tasks in preprocessing include filtering for noise removal, deblurring the image and highlighting of specific features, e.g., cracks on the pavement. Pattern recognition and extraction is the process of dividing an image into meaningful regions, such as objects of interest and background. The fourth and the main step is the extraction of features from the ROI which are the samples of road damages for training. Next step is to train the damage detection system with the extracted features of the training images so that when a test image is given to the system it will be properly classified. Here a Support Vector Machine(SVM) is used for training and classification. In this work, advanced image processing techniques are used to deal with pavement pictures.
Fig 1: The proposed system architecture
3.1
Acquisition of Images
The first step is the collection of road distress images. Images used in this work are gray scale images with different pixel intensities ranging from 0 (black) to 255 (white).
While acquiring the road images different factors are to be considered such as clarity, accuracy, processing speed and implementation costs etc. One of the image acquiring systems that was presented by INO is LRIS [4] that can acquire road surface images at speed greater than 100 km/hr. The LRIS system consists of high power lasers and two high speed high resolution linescan cameras. The cameras and projectors are properly aligned so that even small cracks are visible as in Fig 2.
Another solution for this image capturing problem is CSIRO’s road crack detection vehicle, the PAVUE system by OPQ system, Roadware’s Wisecrax crack detection system and Piccrack. The CSIRO’s road fault detection system uses a special modified van with a series of scan line cameras under a skirt in the middle of the vehicle to acquire road surface
footage. Video is recorded as a continuous series of high contrast images and is non-overlapping.
Fig 2: Image acquisition system [4]
Here images of all distresses such as cracks and potholes should be carefully taken with an efficient image capturing equipment. Here the images used in this work are taken using a high resolution video camera. Fig.3 and Fig.4 shows collected pothole and crack images respectively.
[image:3.595.322.541.273.548.2](a) (b)
Fig 3: Pothole Images taken
(a) (b)
Fig 4: Crack Images acquired
3.2
Preprocessing of Images
Some preprocessing steps are adopted for envisaging better crack detection and characterization results.
Intensity Normalization and Pixel Saturation: Preprocessing starts with pixel intensity normalization, independently applied to each image, to deal with the non uniform background illumination, which is mainly due to the type of sensor used for image capture. The goal is to obtain the same average pixel intensity for blocks preliminary labeled with “0” (considered as background) in each image, whereas the remaining (distress) blocks keep a lower average intensity due to the presence of relevant (darker) distress pixels.
Road pavement surface images often include bright pixels due to specular reflections on some surface materials. This increases the standard deviation(std) of pixel intensities in blocks without damages (cracks/potholes), eventually leading to similar std values in both damage and non-damage blocks, which is undesirable since this paper intends to explore standard deviation as a feature for crack detection.
[image:3.595.82.278.311.533.2]of all pixel intensities in each image) are replaced by the threshold value. This result in slightly darker images without losing information regarding the presence of damages, as notably, the “std” feature becomes more discriminative.
3.3
ROI Recognition and Extraction
Fig. 5 shows various steps in the ROI recognition and extraction task involved in automatic road distress detection.
Fig.5 The steps involved in ROI recognition and extraction
After preprocessing a binary image is obtained and the edges of the binary image are detected using Canny edge detection algorithm. Canny edge detection takes a gray scale or a binary image as its input, and returns a binary image of the same size as the output, with 1's where the function finds edges in the input and 0's elsewhere. It is inconvenient to take obtained matrix as such because as long as the size of the matrix used for training and recognition increases the complexity of the process also increases. It will be easy to identify road damage if we could get the skeleton of the damage. The skeleton is selected from the longest connected components of the figure. Thus the next step is to get the connected components from the filtered image and then find the longest among those connected components. The connected components algorithm returns a matrix of the same size as the input matrix, containing labels for the connected objects in the input. The minimum neighborhood connections can have a value of either 4 or 8, where 4 specifies 4-connected objects and 8 specifies 8-connected objects. The next step is to extract the longest connected components. All the connected components are sorted in descending order. Since we could not get the distress skeleton of the image by taking only the longest connected component, the longest five connected components are taken.
3.4
Segmentation and Feature Extraction
The segmentation of the image is done based on the first five connected components extracted. The components are segmented from the original image and the image is redrawn. In the next step the extra portions of the image excluding the connected components are removed to make the matrix size even smaller. This matrix representing the five connected components is taken as the samples for training. Both the row values and column values of the elements having the values of 1, taken in a sequential order, is choose for training. Similarly the samples for all the training images (total three classes withsome images correspond to each class) are taken. Thus when an input image is given to the system all the above mentioned processes are done on the test image also. That is rgb to gray conversion, filtering, edge detection etc are done for this image also and the samples representing this image are taken. Then the size of all the training matrices are made equal to the size of test image matrix to make the comparison process feasible.
3.5
System Training and Classification
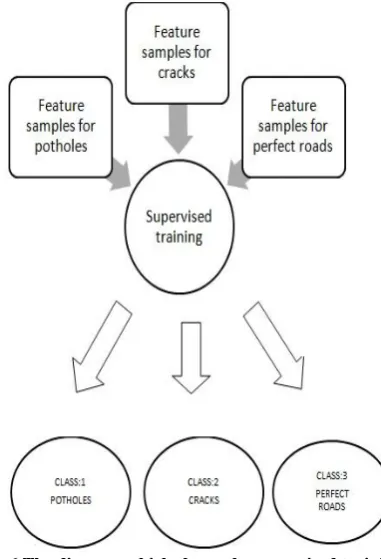
Classification and training is based on Supervised learning approach. Supervised methods are methods that attempt to discover the relationship between input attributes (sometimes called independent variables) and a target attribute (sometimes referred to as a dependent variable). The relationship discovered is represented in a structure referred to as a model. Usually models describe and explain phenomena, which are hidden in the dataset and can be used for predicting the value of the target attribute knowing the values of the input attributes. The supervised methods can be implemented in a variety of domains such as marketing, finance and manufacturing. [image:4.595.123.229.159.362.2]In this work the there are three classes, cracks, potholes and perfect roads. Hence training samples should be provided for these three classes. Supervised training is performed on the set of samples provided for each class as shown in Fig. 6. The training and classification processes are done by Support Vector Machine(SVM) classifier. It classifies each row of the data in Sample using the information in a support vector machine classifier structure, created using the SVM training function. Sample must have the same number of columns as the data used to train the classifier in training step. Group indicates the group to which each row of Sample has been assigned. Binary tree classification is used for the identification of the correct class represented by the input image among the three classes which is trained already. The progress of a binary tree can be shown as the Fig. 7.
Fig. 6 The diagram which shows the supervised training approach used
Binary Image
Edge detected Image
Connected Components Labelling
Sorting of connected components
[image:4.595.339.530.468.748.2]Fig. 7 Binary tree classificaion using SVM
3.6
Severity Calculation
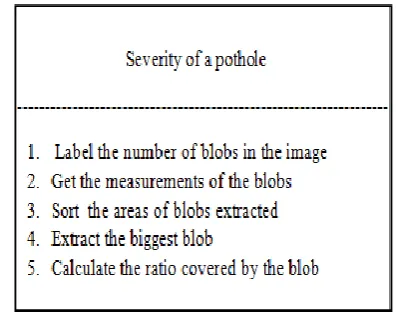
Now the distresses are detected and classified in to two classes and the image without any distress to perfect road class. The final step is to detect the severity of the classified potholes and cracks. Severity is calculated in different ways for potholes and cracks. In the case of a pothole the step followed are shown in Fig. 8. First the blobs in the enhanced image are identified. Then the blob measurements are determined. After that the blobs are sorted according to the areas. Some larger blob areas are extracted from the image and the remaining portions are eliminated. Finally the area covered by the extracted blobs is identified. But in the case of a crack, extraction of blobs will not give accurate result. So some image enhancement functions are applied and the crack is extracted. Then from the pixel count the area covered by the crack is determined.
Fig. 8 Steps involved in severity calculation of a pothole
4.
EXPERIMENTAL RESULTS
The proposed system for automatic crack detection and classification is evaluated using the images acquired. The images are initially classified to two sets Training set and Test set. The system is trained using the training set of images. Here there are three classes of images potholes, cracks and images without any distresses. So training sets should be chosen for each of these three classes. Here 10 images are selected from each class for training and those images are images which are evidently belong to the class and a human can be easily identified by a human(eg.Training set for potholes should be images which contain potholes). Training Images also should be passed through all the preprocessing and further feature extraction steps. Fig. 9 shows the preprocesssing and segmentation results obtained for an
image shown in Fig. 3(b). Fig.10 shows the result obtained for a crack image shown in Fig. 4(a)
(a) (b)
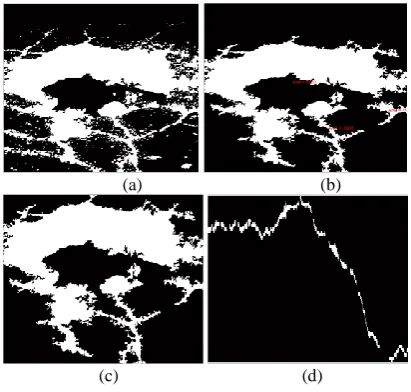
(c) (d)
Fig. 9 Segmentation results obtained while processing a pothole. Fig. 9(a) shows the preprocessed binary image. Fig.9(b) shows the edge detected image. Fig. 9(c) is the image after the extraction of largest connected components. Fig. 9(d) is the final cropped image.
(a) (b)
Fig. 10 Segmentation results obtained while processing a crack. Fig.10(a) shows the preprocessed binary image. Fig.10(b) is the final cropped image after connected component extraction.
The performance of the system can be evaluated from the efficiency of the system. The efficiency of the classifier can be calculated as
[image:5.595.322.540.101.304.2] [image:5.595.323.534.365.479.2] [image:5.595.68.268.408.565.2]
Table 1. Pothole and Crack Detection and Classification Results
Tst1 Tst2 Tst3
Efficiency pothole
90% 92% 93%
Efficiency crack
80% 81% 79%
Total Efficiency
85% 86.5% 86%
Error rate 15% 13.5% 14%
After the classification severity of each distress is calculated. Fig. 11 shows the various steps of processing a pothole while severity calculation. Severity was calculated as
The pothole image shown in Fig. 3(a) has got the severity percentage as 35.73 and the pothole image shown in Fig. 3(b) has got severity percentage as 19.28. Similarly the crack image in Fig. 4(a) has got severity percentage as 2.47.
(a) (b)
[image:6.595.65.271.342.538.2](c) (d)
Fig. 11 Different images obtained while severity calculation. Fig. 11(a), Fig. 11(b), Fig. 11(c) shows the processing of a pothole images and Fig. 11(d) shows the
final crack image for severity calculation.
5.
CONCLUSION
In this paper a simple supervised road distress detection and classification system is proposed that can be applied to Indian roads which suffer from the problem of cracks as well as potholes. It was demonstrated that the system works well for the classification of potholes as well as cracks. For that the classification has been performed with different sets of images and the performance of the system is evaluated. Moreover the
proposed system showed a faster processing speed which took maximum 5sec/image for classification and 2sec/image for severity calculation.
Future development will consider the usage of some more filtering techniques so that the system works well for low quality images also.
6.
REFERENCES
[1] H. Cheng and M. Miyojim(July. 1998),“Automatic pavement distress detection system,” Inf. Sci., vol. 108, no. 1–4, pp. 219–240.
[2] Peggy Subirats (1), Jean Dumoulin(1), Vincent Legeay(1) and Dominique Barba(2)(2006),”Automation of Pavement Crack Detection using the Continous Wavelet Transform ” in IEEE International Conference on Image Processing, 2006
[3] S. Chambon, P. Subirats, and J. Dumoulin,(2009),“Introduction of a wavelet transform based on 2D matched filter in a Markov randomfield for fine structure extraction: Application on road crack detection,”in Proc. IST/SPIE Electron. Imag. Sci. Technol., San Jose, CA. 72510A-1–72510A-12.
[4] Henrique Oliveira, Paulo Lobato Correia(2009) “Automatic road crack segmentation using entropy and image dynamic thresholding ” in 17th European Signal Processing Conference.
[5] H. Oliveira and P. L. Correia, “Identifying and retrieving Distress images from road pavement surveys”, Proc. 1st ICIP Workshop on Multimedia Information Retrieval: new trends and challenges, ICIP 2008, Las Vegas, USA, 2008.
[6] Tien Sy NGUYEN(1)(2), Manuel AVILA(1), BEGOT Stephane(1),”Automatic Detection and Classification of Defect on Road Pavement using Anisotropy Measure”, in 17th European Signal Processing Conference (EUSIPCO 2009).
[7] C. Ma, W. Wang, C. Zhao, F. Di, and Z. Zhu, “Pavement cracks detection based on FDWT,” in Proc. IEEE Int. Conf. CiSE, Wuhan, China, 2009, pp. 1–4.
[8] A. Ayenu-Prah and N. Attoh-Okine, “Evaluating pavement cracks with bidimensional empirical mode decomposition,” EURASIP J. Adv. Signal Process., vol. 2008, no. 1, pp. 861701-1–861701-7, 2008.
[9] P. Ekdahl, Routine Measurements of Pavement Surface
Cracks, Ramböll RST, Malmo,
Sweden.http://carbon.videolectures.net/2008/contrib/surf 08_portoroz/ekdahl_rmopsc/surf08_ekdahl_rmopsc_ 01.pdf