MFS-PSO: A Modified PSO Method for Optimizing
Gene Selection
ABSTARCT
Feature selection is an important technique for identifying informative genes in microarray datasets. In order to select small subset of informative genes from the large datasets various evolutionary methods have been used. However, because of the small number of samples compared to the huge number of genes many of the computational methods face difficulties to select the small subset. This paper proposes a modified PSO algorithm, Minimized Feature Space (MFS) Particle Swarm Optimization to optimize feature selection. In the modified PSO approach we propose a new method which controls a particle’s movement towards the best solution. The proposed approach is applied on leukemia, colon and lung cancer benchmark datasets and experimental analysis show good performance.
Keywords
Feature Selection, Particle Swarm Optimization, F-score, T-score, mfspso
1. INTRODUCTION
Feature selection is the technique of selecting a subset of relevant features for building robust learning models [1]. It attempts to identify and highlight the most informative genes in the microarray data sets which have dominant effects on the biological states of human cells. The main focus is to select the most informative genes to optimize the dimensionality problem. Removal of less informative genes helps to alleviate the effects of noise and redundancy. Moreover, it simplifies the task of disease classification and prediction of medical conditions such as cancer.
The relentless development of Microarray datasets have meant that the dimensionality of data that can be represented by the Microarray chips have increased many folds over the years [2]. Usually features that are analyzed may be thousands in number, whereas the number of samples is very less hovering around lower hundreds. As the datasets become large, the number of noisy, redundant and uninformative feature also increases resulting in space-time complexity. However, if we apply feature selection a decrease in space complexity, a cost reduction of feature measurement and an increase of classifier accuracy and efficiency can be achieved. Feature selection techniques can be classified into Filter Technique and Wrapper Model Technique.
features with the higher scores are presented to the classifier algorithm for classification. Similarly in information gain which is another scoring method is used to score the genes from which subsequent removal of low scoring genes is done. Besides these F score, t score and correlation of genes are used for scoring.
In wrapper model a search in the entire feature space is performed to generate a subset of features which are evaluated against a classification model in which the classifier is integrated to evaluate the effectiveness of the subset of features generated. In Genetic Algorithm SVM classifier was used for evaluating the accuracy of the results [4]. Similarly evolutionary approach is used for selecting the features and MLHD (Most Likelihood Classification Method) classifier is used for evaluating the choices made.
The remainder of this paper is organized as follows: In Section 2, we deal with a brief discussion about PSO method with basic flowchart. In Section 3 we will be enlightened about our proposed algorithm with some elaborate discussion. In Section 4 the experimental analysis and result comparisons will be discussed. Conclusion is presented in Section 5.
2. LITERATURE REVIEW
2.1 Particle Swarm Optimization
Particle Swarm Optimization (PSO) is an evolutionary method which simulates the social behavior of living organisms like: bird flocking and fish schooling. Here candidate solution moves around a D-dimensional search space [10].In our field it represents a feature subset. Each solution is termed as a chromosome and collection of such chromosomes is called a population. PSO continuously updates it’s generation at every iteration. From the population a fitness function defines the goodness or “fitness” of solutions. Each particle uses its individual memory and swarm knowledge to find the best solution. At every iteration particle value is renewed based on its fitness value. PSO has memory of its own, so knowledge of good solutions is retained by all the particles and an optimal solution can be found by the swarms following the best particle because the particles continuously update generations [11]. Unlike other approaches, in PSO only the global best value gives out the information to others. It means every particle has the ability to
Nabil Bin Hannan
Islamic University of Technology, Dhaka,
Bangladesh
Md. Abdul Mottalib
Islamic University of Technology, Dhaka,
Bangladesh
Shaikh Jeeshan Kabeer
Islamic University of Technology, Dhaka,
Bangladesh
Arif Muhammad Sultan
Islamic University of Technology, Dhaka,
Each particle makes use of its individual memory and knowledge gained by the swarm as a whole to find the best solution by continuously updating generations. PSO simulates the social behaviour of organisms, such as bird flocking and fish schooling. In PSO, each single candidate solution is "an individual bird of the flock", that is, a particle moving around a D-dimensional search space. In our field it represents a subset of features.All of the particles have fitness values, which are evaluated by fitness function to be optimized, and have velocities which direct the movement of the particles.
During movement each particle adjusts its position according to its own experience, as well as according to the experience of a neighboring particle, and makes use of the best position encountered by itself and its neighbor. The particles move through the problem space by following a current of optimum particles.The initial swarm is generally created in such a way that the population of the particles is distributed over the search space in a random fashion. At every iteration each particle is updated by the following two "best" values, called
pbest and gbest. Each particle keeps track of its coordinates in the problem space, which are associated with the best solution (fitness) the particle has achieved so far.
In spite of being an easy to compute and an easy to implement algorithm the basic PSO approach exhibits some drawbacks [7, 8] namely:
Sometimes it is easy to be trapped in local optima. The velocity of particles rapidly approach zero as it gets closer to a nearly optimal solution and the convergence rate decreases considerably in the later period of evolution. Moreover, the search process of the PSO is non-linear and very complicated.
In our proposed approach we will be dealing with these shortcomings which will be discussed in the next section. The basic steps of our proposal are outlined as follows:
Micro Array outcome is in the form of a matrix which represents gene expression data. We propose to apply MFS-PSO to get the final best gene subset. This approach
[image:2.595.320.527.74.311.2]overcomes local optima problem using dynamic adaptation approach by dynamically changing inertia weight (w) value.
Figure 1: Basic flowchart of PSO
3. PROPOSED METHOD
As mentioned by Xeuming Yang in [9] local optima occur as the velocity of a particle rapidly approaches zero as it draws closer to a near optimal solution. Thus the convergence rate decreases at later stages of evolution leading to a standstill to the algorithm optimization. According to [11], inertia weight for each particle and iteration will be different. Large inertia weight enhances global search while small inertia weight results in faster convergence. In the proposed approach the inertia weight is decided by evolution speed of each particle and aggregation degree of the swarm.
3.1 Pseudo Code of MFS-PSO:
Initial Population
While (number of generations, or stopping criterion is not met)
for p=1 to number of particles
If > fitness of
Then Update =
For k ∈ Neighborhood of
If the fitness of > gbest then
Update gbest = Next k
For each dimension d
= w + ( - ) +
× ( ─ )
If ≠ ( , ) then = max (min ( , ), ) = +
Next d Next p
3.2 Pseudo code for Particle Update
Here our proposed mfspso variable is applied-
= w + ( ─ )+
× ( ─ ) (1)
S ( ) =
(2)
if ( <S ( )) then = 1; else = 0 (3)
The inertia weight w controls the impact of the previous velocity of a particle on its current one. Proper adjustment of
w and , is very important. Too small parameter adjustment would cause too small particle movement and results in useful data, but is time consuming. In each iteration the best particle is being chosen according to their fitness values and the number of genes selected is also updated if it has a reduced value. The velocity of the particle in each dimension increases rapidly and tends to select higher number of genes for obtaining high classification accuracy.
Thus we have used a new variable in the above equation (2) for particle update which works as an acceleration handler and named it mfspso. A lower value of mfspso increases the probability of selecting a single gene while a higher value suppresses the acceleration gained by a certain particle depending on the relational logic used to select or deselect a dimension. If the possibility of finding the object increases, the individual decelerates (i.e., decrease the inertia weight) to fly towards the optimal value, which lead to increasing the search intensity in the current small search area.
4. EXPERIMENTAL ANALYSIS
4.1 Dataset Details
In this paper we have applied our proposed algorithm to three microarray datasets: ALL-AML Leukemia, Lung Cancer and Colon Cancer. Table I summarizes some basic information of these datasets. All the genes are standardized to zero mean and zero standard deviation.
Table 1. Samples and genes in the available datasets
Dataset No of Samples No of Genes
ALL 72 7130
LUNG 181 12533
COLON 62 2000
In the ALL dataset there are 72 tissue samples (47 B-cell and 25 T-cell). In the lung dataset there are 181 tissue samples (47 MPM and 134 ADCA). The training set contains 32 of them, 16 MPM and 16 ADCA. The rest 149 samples are used for testing. Colon dataset contains 62 samples collected from colon-cancer patients. Among them, 40 tumor biopsies are from tumors (labeled as "negative") and 22 normal (labeled as "positive") biopsies are from healthy parts of the colons of the
same patients. From Table 1 we can see that dataset for Colon cancer contains the lowest number of genes comparing to other two datasets, exposing higher possibilities of misclassifications and over fitting. It is because the more the number of samples, the more we can train classifiers to classify test samples.
4.2 Experimental Settings
From Table 2 and are acceleration factors that control how far a particle will move in a single generation. Usually = = 2.
While for excessive adjustment particle movement will be excessive, causing the algorithm to weaken early, so that a useful feature set cannot be obtained. Too Small inertia weight results in faster convergence and thus the algorithm gets stuck in local optima.
In our approach, the best results were obtained with and = 0.2, w = 0.5, mfspso = 10 for Lung Cancer and Colon datasets and for Leukaemia dataset we tuned the acceleration factors , to 2 , inertia weight w to 1.1 and mfspso was retained to 10 to obtain higher accuracies and lowest number of informative genes.
Table 2. Initialization of main factors for datasets
Dataset Colon Leukemia Lung
Initial Population 2000 7130 12533 Inertia Weight(w) 0.5 0.8,1.1 0.5 Acceleration
Factor( , )
0.2 0.2, 2 0.2
mfspso (Acceleration Handler)
10,14 10,14 10,14
4.3.
Comparison Analysis
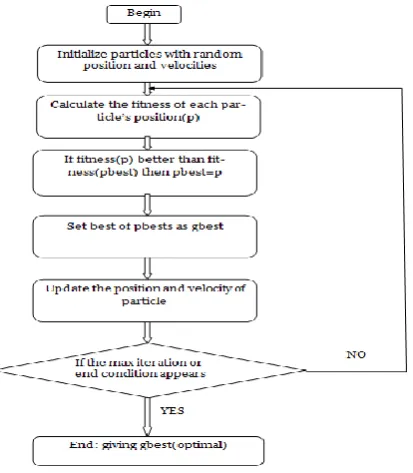
From Table 3 we can see some of the notable evolutionary algorithms accuracies which give a less optimal solution than our MFSPSO approach for both SVM and KNN classifier. In Table 4 it should be noted that in the best case, the number of genes selected is the least for the proposed approach than other existing approaches. We have taken number of independent runs as X-axis and Y-axis with Ratio for all the independent runs. Here,
Ratio
=
(4)
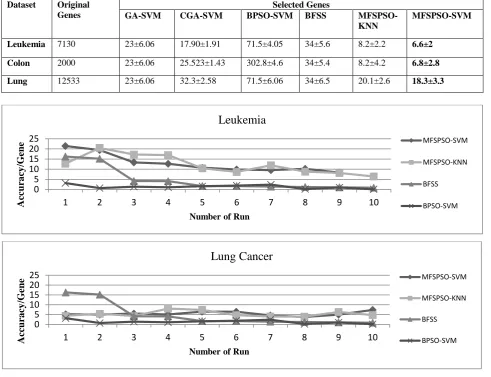
In Figure 2 and 3 we can see that the X-axis denotes the number of gene selected for each algorithm and the Y-axis represents the ratio used in equation (4). Figure 2 is for Leukemia Cancer Dataset and Lung Cancer Dataset and Figure 3 show the graphical representation for Colon Cancer Dataset. Thus we can see that in all the cases for our MFSPSO algorithm for SVM and KNN classifier the ratio is high which refers that the number of gene selected is much lower than
Table 3. Comparison among accuracies of some notable algorithms using SVM and KNN classifier with MFSPSO method
[image:4.595.47.539.283.660.2]Table 4. Comparison among number of genes selected of some notable algorithms with MFSPSO method using SVM and KNN classifier
Dataset Original Genes
Selected Genes
GA-SVM CGA-SVM BPSO-SVM BFSS
MFSPSO-KNN
MFSPSO-SVM
Leukemia 7130 23±6.06 17.90±1.91 71.5±4.05 34±5.6 8.2±2.2 6.6±2
Colon 2000 23±6.06 25.523±1.43 302.8±4.6 34±5.4 8.2±4.2 6.8±2.8
Lung 12533 23±6.06 32.3±2.58 71.5±6.06 34±6.5 20.1±2.6 18.3±3.3
Dataset ACO PSO GA-SVM CGA-SVM BPSO-SVM BFSS
MFSPSO-KNN
MFSPSO-SVM
Leukemia 83.89% ………
84.22% ………
83.80±2.14
88.24%
91.53±2.48
96.12%
91.72±2.29
94.29%
91.85±3
94.94%
87.92±5.98
95.83%
100±0
100%
Colon 76.87% ………
76.89% ………
83.48±1.77
86.27%
86.36±1.46
89.74%
86.13±3.8
90.32%
82.42±1.73
83.71%
78.97±4.01
87.10%
86.27±2.8
91.61%
Lung 79.76%
………
80.09% ………
84.85±1.54
87.92%
86.89±1.54
89.32%
91.72±2.3
94.29%
82.7±1.73
83.71%
95.98±1.5
97.24%
96.07±1.63
98.89%
Figure 2: Comparison among Minimized Feature Space Particle Swarm Optimization (MFSPSO), Boost Feature Subset Selection (BFSS) and Binary Particle Swarm Optimization (BPSO) of Accuracy per gene in 10 independent
runs for Leukemia and Lung Cancer benchmark datasets.
0 5 10 15 20 25
1 2 3 4 5 6 7 8 9 10
Acc
ura
cy
/G
ene
Number of Run
Leukemia
MFSPSO-SVM
MFSPSO-KNN
BFSS
BPSO-SVM
0 5 10 15 20 25
1 2 3 4 5 6 7 8 9 10
Acc
ura
cy
/G
ene
Number of Run
Lung Cancer
MFSPSO-SVM
MFSPSO-KNN
BFSS
5. CONCLUSION
In this study we have seen that our proposed approach works well on the three benchmark datasets than other existing approaches. In case of Binary PSO which takes a large number of genes as input, results in the local optima problem. We have applied only SVM and KNN classifiers in our proposed approach. Other classifiers can also be applied for a comparative analysis. Moreover, this can be used in broader perspective in different fields. Our proposed method obtains higher classification accuracy as well as selects less number of informative features to identify a disease which has a better performance than other existing evolutionary approaches.
7. REFERENCES
[1] Li-ye-chuang,Cheng-Huei Yang, Jung-Chike Li and Cheng-Hong Yang, 2012. A Hybrid BPSO-CGA Approach for Gene Selection and classification of Microarray data.
[2] Bing Xue, Mengjie Zhang and Will N. Browne, 2012. Single Feature Ranking and Binary Particle Swarm Optimization based Feature Subset Ranking for Feature Selection in Thirty fifth Australian conference.
[5] Ruichu Cai, Zhifeng Hao, Xiaowei Yang and Han Huang, 2011. A new hybrid method for gene selection [6] Wei Zhao, Gang Wang, Hong-bin-Wang, Hui-ling Chen,
Hao Dong and Zheng-dong Zhao, 2011. A Novel Framework for Gene Selection.
[7] Sheng Ding, 2009. Feature Selection Based F-score ACO Algorithm Support Vector Machine.
[8] Xueming Yang, Jinsha Yuan, Jiangye Yuan and Hu- ina Mao, 2007. A modified particle swarm optimizer with dynamic adaptation. Applied Mathematics and Computation.
[9] L.-Y. Chuang, C.-S.Yang, K.-C.Wu and C.-H.Yang, 2010. Correlation-based Gene Selection and Classification Using Taguchi-BPSO.
[10] James Kennedy and Russell Eberhart, 1995. Particle Swarm Optimization.
[11] Rahmat Allah Hooshmand and Soltani S., 2012. Fuzzy Optical Phase Balancing of Radial and Meshed Distribution Networks using BF-PSO Algorithm. In IEEE Transacti- on on Power System, VOL 27, NO.1.
[3] Shutao Li, Xixian Wu and Mingkui Tan, 2008. Gene selection using hybrid particle swarm optimization and GA.
[image:5.595.42.538.75.226.2][4] José García-Nieto and Enrique Alba, 2011. Parallel multi-swarm optimizer for gene selection in DNA microarrays. Springer science + Business media, LLC.
Figure 3: Comparison among MFSPSO, BFSS and BPSO on Accuracy per gene in 10 independent runs for Colon Cancer benchmark dataset
0 5 10 15 20 25 30
1 2 3 4 5 6 7 8 9 10
Acc
ura
cy
/G
ene
Number of Run
Colon Cancer
MFSPSO-SVM
MFSPSO-KNN
BFSS