Analysis of Electrocardiograph using Perceptron Feed
Forward Neural Network
Bhandare Prashant Shivaji
Sinhgad College of Engineering, korti, Pandharpur, Solapur University, India
Bokefode Jayant Dipak
Sinhgad College of Engineering, korti, Pandharpur, Solapur University, India
Bhise Avdhut Suryakant
JSPM’s ICOER,Wagholi, Pune Pune University, India
More Prajakta Bhanudas
SVERI’s College of Engineering(Polytechnic), Pandharpur, India
ABSTRACT
This paper provides a way for analyzing the ECG reports. Currently available systems are just limited to producing the ECG report, analysis made on that reports are totally manual. Manual analysis of reports is time consuming process and generates humanoid errors. We developed the system that works on artificial neural network to analyze the ECG reports. Our results show that cardiac condition of the heart by analyzing ECG reports.
Keywords
ECG, Artificial Neural network, perceptron, image processing module (IP module)
1.
INTRODUCTION
Today’s development era has given birth to the comfort diseases like heart diseases, diabetes etc. So to tackle that problem we need a better diagnostic system capable of diagnostic the disease. So we undertook the project to design a system capable of analyzing the ECG report. The primary motive behind undertaking this project is the unavailability of the systems that are capable of analyzing the ECG reports. Current systems that are present are just limited to producing the ECG reports. [13]-[16] Further analysis is a manual work. Generally the results of manual analysis are not in written form and are not passed over to the related patient. Manual analysis of reports is a time consuming practice and embeds humanoid errors.
The system developed is a system capable of analyzing the ECG reports through the use of Artificial Neural Network. This project is a perceptron network which is used to classify the condition of heart (normal or abnormal). ANN is one of the burgeoning technologies of today’s era. The system uses the image of ECG to do so. We developed the system to work on the image as there are no systems capable of doing so. It is also important to know that the patient is not needed to be connected to ECG machine for analysis.[17][18] You can do it through the image itself. Our results show that cardiac condition of the heart by analyzing ECG reports.
2.
INFORMATION GATHERING
2.1
Electrocardiograph
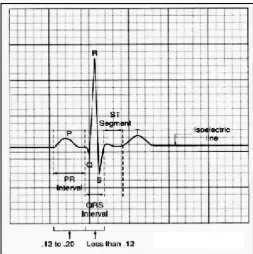
[image:1.595.315.569.324.579.2]activation is to plot the sequence of instantaneous depolarization wave fronts. It is possible to examine the actual generation of the ECG by taking into account a realistic progression of activation double layers. The example of ECG is given in a figure.1.
Fig 1: A Sample ECG
2.2
Neural Networks
Neural networks having ability to derive meaning from complicated or imprecise data which can be used to extract patterns and detect trends that are too complex to be noticed by either humans or other computer techniques. Other advantages of neural networks include:
1. Adaptive learning
2.3
Perceptron
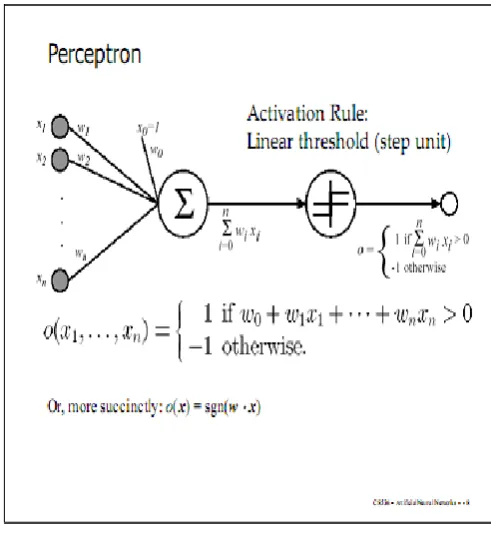
The perceptron shown in Figure 2 change as the MCP model (McCulloch and Pitt’s model). The MCP neurons having the inputs that are ‘weighted’; these weighted inputs have the effect that is used for decision making and it is dependent on the weight of the particular input. In figure 2 the units are labeled as A1, A2, Aj, Ap. These units are called association units and it is used to retrieve localized features from the input images. Perceptrons mimic is based on the mammalian visual system it is used in pattern recognition.
Fig 2:A basic perceptron model
[image:2.595.314.560.70.337.2]In perceptron model the simplest network is single-layer network and this network have weights and biases could be trained for producing a correct target vector when presented with the corresponding input vector. Where the training technique used is called the perceptron learning rule. The perceptron generated have great interest because it is having ability to generalize from its training vectors and learn from initially randomly distributed connections. Perceptrons are especially used for simple problems in pattern classification & pattern recognition. They are the fast and reliable networks for the problems that they can solve. For perceptron learning rule see [22].
Fig 3: A Perceptron
The figure 3 shows a perceptron with its internal details, its working and the activation function used in it.
3.
PROBLEM STATEMENT
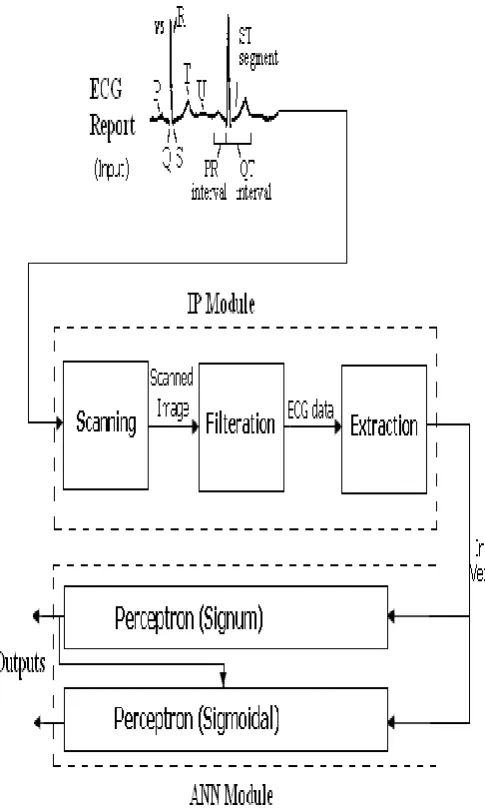
[image:2.595.57.297.201.422.2]The aim is to design a system that is capable of analyzing the ECG report and produce the output in the form of condition of heart (normal or abnormal). The system should take feature vectors taken from ECG as input to process them through ANN network and produce the output.
Fig 4: Working of Perceptron network
4.
METHODOLOGY
[image:2.595.316.558.468.569.2]Fig 5: An Overview of a presented module
In ANN module we use feed forward network. [19]-[21] Feed-forward ANNs allow signals to travel one way only; from input to output. There is no feedback (loops) means the output of layer does not affect same layer. Feed-forward Artificial Neural Networks is straight forward neural networks where inputs are associated outputs. [9]-[12]
The supervised learning rule method is used here. Where supervised learning method incorporates an external teacher, where each output unit is told what should be the desired response for input signals. Here global information may be needed during the learning process. Supervised learning includes 1) error-correction learning, 2) reinforcement learning and 3) stochastic learning.
In design, we divided the presented model into two types. First one is Image processing module and ANN module. In Image processing includes image scanning, image extracting and image filtration. In ANN module includes training and simulation. The presented model works as follows.
4.1
Image Processing Module
[image:3.595.318.561.70.475.2]Here first the entered report is scanned to store it in a matrix form. [22] Then the image data is filtered to remove the noise and unwanted data and only to get the required ECG waveform from that image. Then through that data that system will extract out the feature vectors to be fed to ANN module. Then ANN module gets that feature vectors where in feature vectors are fed to perceptron network-1 to generate the output as whether the ECG is normal or abnormal. If it is found abnormal then the feature vectors are again fed to the second network to decide the grade of abnormality.
Fig 6: ECG Analysis model
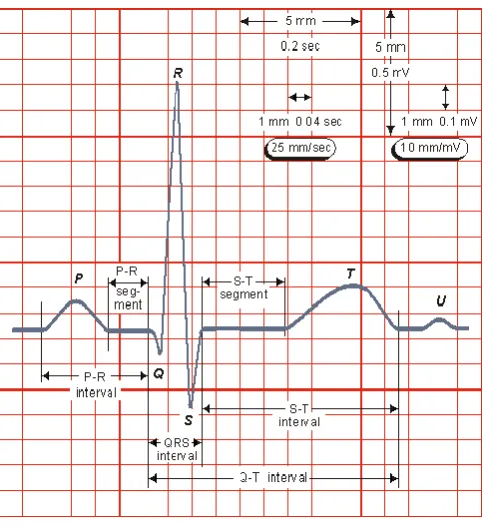
The Feature Vector
The feature vectors are provided to the perceptron network as the input and it shown in figure 5. These feature vectors are generated from the ECG report. These feature vectors are such that they describe the whole ECG wave. [6][7]
These feature vectors are:
1. P-R interval. 5. S-T interval
2. P-R segment. 6. Q-T interval
3. QRS interval. 7. P peak.
4. S-T segment. 8. T-peak.
Fig 7:ECG wave form withfeature vectors
4.2
ANN Module
In this we have designed the network with eight nodes. [11] Where in the feature vectors will be given as input to the perceptron network and then the network will decide whether the ECG report is normal or abnormal.
The perceptron network consists of two layers- First layer with 8 nodes & Second layer with 4 nodes. [22] Where in the all feature vectors will be given as input to the network for the first layer and then the network will decide whether the cardiac condition is normal or abnormal & grade of abnormality. This output will be produced by the second layer through the 4 nodes. The output produced is binary output. The output is given by the 4 nodes is presented in the Table 1.
Table 1. The output of each node
Nodes Output Result
1st node [1,0,0,0] Normal Cardiac Condition.
2nd node [0,1,0,0] Low abnormality.
3rd node [0,0,1,0] Medium abnormality.
4th node [0,0,0,1] High abnormality.
2nd, 3rd & 4th node will produce output accordingly if cardiac condition is abnormal.
[image:4.595.55.297.68.332.2]5.
EXPERIMENTAL WORK
Fig 8: working of ECG Analysis model
Here first the user is asked for its choice, whether he want to train the network or simulate it so as to get the output for the ECG with him. Thereafter, the appropriate window is opened and user presents the network with appropriate input(s). Perceptron network works on it to produce the output accordingly. If it’s training mode we need to provide two inputs- feature vectors and target output values. And for the simulation mode we need to input feature vectors only to get the output. With reference to the weight the difference between these two is weights are updated in the training mode where as weights are used to produce the output in simulation mode. Then when the weights are update in the training mode they are transferred to the database to store them for future use. These updated weights are used during the simulation mode to produce the output. While doing so the weight matrix retrieved from the database is used. That’s why we need to store the updated weights into the database.
5.1
Training
[image:4.595.320.567.70.457.2]and then updates them. The updated weights are then stored in the weights database to be used for the simulation purpose.
5.2
Simulation
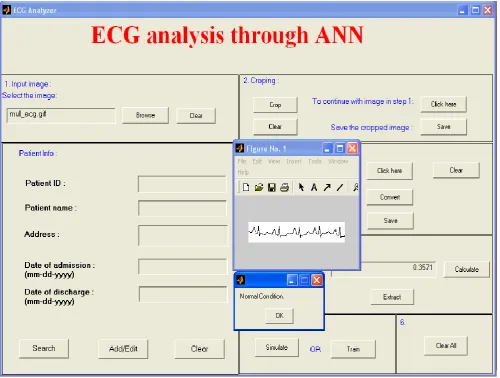
Simulation is to make the network perform the task and produce the output. Here through the simulation we have
produced the output which will indicate the state of heart. To do so the network is needed to be provided with the input feature vectors. Then during the computation the network will take the weights from the database to compute the output accordingly. Figure 7 shows the result of our simulation.
Fig 9:
ECG Analysis model
5.3
Database
5.3.1 Weights Table
The database is required to store the weights of the network. These weights are generated by training the network and are used during the simulation. The database has in all 64 entries which are the weights of the network. The weight matrix of the network is an 8X8 matrix. This weights database is maintained for the use of weights vectors in it by the network.
5.3.2 Feature Vector Table
Feature vectors are extracted from image, computed and then stored into the table so as to extract them from the table and use as the input to the ANN to work on them for decision making.
5.3.3 Patient Database
The patient database contains the information about patient.
Where ID is patient’s Id, PName is name of patient, DoA Date of Admission, DoD is Date of Discharge. We provide the facility for searching, insertion and updating the patient information.
While inserting a new record you just need to specify all the details except ID coz it is generated when you insert the record. Patient Id, being the primary key is used to retrieve the record. Others search keys are not provided as not necessary that much. You can retrieve the record through searching and then you can update whatever you want and then that changes can be made permanent into database.
6.
FUTURE WORK
[image:5.595.55.556.133.511.2]increase the capability of system which is a benefit of the ANN.
Improvement in the system can be made to the IP segment which also can be done thro’ the ANN providing a more flexibility to the system. To do so we need to use the feature extraction thro’ ANN and can be then called a pure ANN system used to diagnose the ECG.
7.
CONCLUSION
The presented model or system is capable of analyzing the ECG report through given feature vectors. The designed model take ECG report as input and it give the condition of heart that is abnormal or normal. The system can also be trained for performance improvement. System is provided with simple graphical user interface and using this interface any user can use this system. Output of this model is similar to the doctor report which is analyzed manually. In designed model we use ANN that makes system algorithm independent.
8.
ACKNOWLEDGMENTS
I would like to express my deepest appreciation to all those who provided me the possibility to complete this report.
9.
REFERENCES
[1] Saravanan, C. Color Image to Grayscale Image Conversion
[2] Raja Bala, Reiner Eschbach, Spatial Color-to-Grayscale Transform Preserving Chrominance Edge Information, Color Imaging Conference, 2004, pp.82-86.
[3] K. Rasche, R. Geist, J. Westall, Re-coloring Images for Gamuts of Lower Dimension Detail Preserving Color Transformation, EUROGRAPHICS, 24(3), 2005.
[4] Mark Grundland, Neil A. Dodgson, Decolorize: Fast, Contrast Enhancing, Color to Grayscale Conversion, 40(11), 2007, pp. 2891-2896.
[5] Amiruddin, A.I.Ali, M.S.A.M. ; Saaid, M.F. ; Jahidin, A.H. ; Noor, M.Z.H.”Feature reduction and arrhythmia classification via hybrid multilayered perceptron network”
[6] Wei ZhangXiangyangXue ; Ziehen Sun ; Yue-FeiGuo ; Mingmin Chi ; Hong LuEfficient Feature Extraction for Image Classification
[7] X. Li and I. Guskov, "Multi-scale features for approximate alignment of point-based surfaces," in Symp. Geom. Processing, 2005.
[8] D.G. Lowe, "Distinctive image features form scale-invariant keypoints," International Journal of Computer Vision, vol. 60, no. 2, pp. 91-110, 2004.
[9] Carlin, B. I., and Andriole, G. L., The natural history, skeletalcomplications, and management of bone metastases in patients with prostate carcinoma. Cancer. 88(12 Suppl):2989–2994, 2000.
[10]Rigaud, J., Tiguert, R., Le Normand, L., Karam, G., Glemain, P.,Buzelin, J. M. et al., Prognostic value of bone scan in patients with metastatic prostate cancer
treated initially with androgen deprivation therapy. J. Urol. 168(4 Pt 1):1423–1426, 2002.
[11]Rodvold, D. M., McLeod, D. G., Brandt, J. M., Snow, P. B., andMurphy, G. P., Introduction to artificial neural networks for physicians: taking the lid off the black box. Prostate. 46(1):39–44, 2001.
[12]Forsstrom, J. J., and Dalton, K. J., Artificial neural networks fordecision support in clinical medicine. Ann. Med. 27(5):509–517, 1995.
[13]Aubert, A.E., et al. "Automatic detection of ventricular tachycardia and fibrillation using ECG processing and intramyocardial pressure measurement." COMPUTERS AND BIOMEDICAL RESEARCH (Oct. 1994) vol.27, no.5, p. 367-82. (Journal article - English) ISSN 0010-4809
[14]Laguna, P., et al. "Automatic detection of wave boundaries in multilead ECG signals: validation with the CSE database." COMPUTERS AND BIOMEDICAL RESEARCH (Feb. 1994) vol.27, no.1, p. 45-60. (Journal article - English) ISSN 0010-4809
[15]Pandit, S., et al. "A novel setup for automatic measurement of ECG signal parameters." International Conference on CONTROL. Held: Coventry, UK, 21-24 March 1994. (UK: IEE, 1994. p. 18-23 vol.1) (Conference paper - English) ISBN 0-85296-610-5
[16]Suppappola, S., et al. "Nonlinear transforms of ECG signals for digital QRS detection: a quantitative analysis." IEEE TRANSACTIONS ON BIOMEDICAL ENGINEERING (April 1994) vol.41, no.4, p. 397-400. (Journal article - English) ISSN 0018-9294.
[17]P. Leijdekkers, and V. Gay, "Personal Heart Monitoring System Using Smart Phones To Detect Life Threatening.
[18]Kailanto, H. Hyvarinen, E. ; Hyttinen, J., “Mobile ECG measurement and analysis system using mobile phone as the base station”.
[19]D. E. Rumelhart, G. E. Hinton, R. J. Williams, Learning internal representation by error propagation. In: Rumelhart, D. E., McClelland, J.L., and the PDP research group (Eds), parallel distributed processing, MIT press, Cambridge, MA 318–362, 1996.
[20]D. Gao, Y. Kinouchi, K. Ito, X. Zhao, Neural Networks for Event Extraction from Time Series: A Back Propagation Algorithm Approach. Future Generation Computer Systems (FGCS). (In press)
[21]D. Gao, Y. Kinouchi, K. Ito, X. Zhao. Time Series Identifying and Modeling with Neural Networks. In: Proc. IEEE Int. Joint Conference on Neural Networks, Portland, USA. 2003; 2454–59.
![European Union Reports for 1978 by the Ministers of Foreign Affairs [and] by the Commission COM (78) 653 final, 20 November 1978 Bulletin of the European Communities, Supplement 1/79](data:image/gif;base64,R0lGODlhAQABAIAAAP///wAAACH5BAEAAAAALAAAAAABAAEAAAICRAEAOw==)