Understanding Effects and Determinants
of Mobile Support Tools: A
Usability-Centered Field Study on IT
Service Technicians
Pousttchi, Key and Thurnher, Bettina
University of Augsburg
2006
Online at
https://mpra.ub.uni-muenchen.de/2924/
Abstract— The integration of mobile workplaces is a major challenge for companies. First-wave mobile solutions mostly support existing business processes through adding value in terms of increased efficiency. Second-wave mobile solutions comprise a re-engineering of the mobile business processes, add value through increased effectiveness and may even enable new forms of mobility.
In order to achieve a systematic approach to mobile integrated business processes it is important to analyze existing processes, focusing on the effects and determinants of mobile solutions that might be used to support those processes.
For this purpose we examined a typical example, the field technician support process of an IT service providing company. Our research approach combines usability and process performance issues. The results show which tasks are suitable for mobile application support, which personnel is most likely to benefit from mobile technology and what improvements on business metrics such as labor time, back office capacity, and invoice cycle are to be expected.
I. INTRODUCTION
The integration of mobile workplaces is a major challenge for companies. Mobile business processes can be supported by applications on handheld devices – e.g. tablet PC, Personal Digital Assistant (PDA) or common mobile phones – which are offline or online synchronized with the corresponding IT systems. Typical mobile tool application approaches can be classified in two categories:
• First-wave mobile solutions extend the usefulness of
existing processes and systems by the application of mobile technology, e.g. to access information from back-office systems, and typically enhance efficiency of the existing processes, i.e., performing the same task in a shorter period of time.
• Second-wave mobile solutions comprise a re-engineering of the mobile business processes, leading to new, mobile-integrated business processes (MIBP) which result in adding value through increased effectiveness and may even enable new forms of mobility. MIBP can be intra- or inter-organisational. The vast majority of current mobile solutions are first-wave approaches. In order to realise mobile-integrated business processes (MIBP) it is important to analyze and understand the
existing (not yet IT-supported) mobile business processes regarding the impact of possible mobile solutions.
In this paper we will present a typical example of a mobile business process in small and medium enterprises (SME). The business process which is going to be supported by mobile technology is the field technician support process. The service providing company employs 37 field technicians and 11 employees in the back office.
The case study focuses on the effects of a mobile solution and its determinants, especially from a usability perspective. The outcome of the paper is to determine which tasks are suitable for support with a mobile application, which personnel is most likely to benefit from support and what improvements on business metrics are to be expected. The intended mobile solution is a PDA-based support tool allowing mobile data access (first-wave mobile solution).
The remainder of this paper is structured as follows: section 2 describes the mobile business process; section 3 presents the related work; section 4 shows our evaluation approach and methods. Section 5 presents the results and section 6 provides a discussion of our findings. Finally, section 7 concludes and outlines future work.
II. CHALLENGE
The examined company is an IT service provider with 48 employees, 37 of these are service technicians. The company provides IT support to 15 corporate customers. Support limitations and cost are determined by a service level agreement (SLA) with each individual customer (e.g., a response time of at most 6 hours for 90% of occurring requests).
Technicians start their working day with a list of current service calls which they receive via mail or ad-hoc telephone calls from the back office. These jobs are prioritized according to the SLAs. Urgent service calls are manually prioritized. If an urgent call comes in during the day, the back office staff has to call out to the field technicians and hope one of them can come back to pick up the paper-based service order. Otherwise, the service order cannot be addressed properly until the next business day. In very urgent cases the technicians would visit a customer without the service order documents and make some informal notes concerning work and driving
Understanding Effects and Determinants of Mobile Support Tools:
A Usability-Centered Field Study on IT Service Technicians
Key Pousttchi, Bettina Thurnher
Mobile Commerce Working Group
Chair of Business Informatics and Systems Engineering (WI-SE)
University of Augsburg
time as well as used spare parts on a sheet of paper. This is problematic as neither the error description nor the effort and cost for the repair are precisely noted. An additional problem could occur if the notes get lost. Even if not, data quality is often poor through redundant data entry and post-job retrieval of order data.
Mobile technology application enables immediate information transmission from the dispatcher’s desk to the field technician’s mobile device (e.g., PDA). There will be no difference between regular calls (planned service calls) and urgent calls. A typical process, supported by mobile applications, consists of three major steps: (a) transmission of service orders, (b) execution of the tasks at the customer, and (c) transmission of performance data (driving, - and work time, used spare parts) to the back office after job completion. This process eliminates multiple data entries and paper handling. Furthermore, overall request duration, including invoicing and work load in the back office decreases. Moreover, the mobile solution could decrease errors caused by redundant data entry, media breaks and calls in the back office.
Following this small example, mobile technology can help to integrate field force into value-creating business processes but therefore tool acceptance among field force is essential which can be fostered through tool usability. According to the authors knowledge this study combines usability considerations and mobile business process improvements for the first time.
The tested object in the study was a PocketPC based application for field technician support. Field technicians execute repair and maintenance jobs directly at the customer’s side. Therefore the field technician needs actual customer data (e.g., location and SLA details), availability of required spare parts and prioritization of jobs.
The tested tool provides field technicians with necessary information about a customer problem or a service and maintenance job. This includes information like the description of the problem, client details, location details, etc. In order to consider the consistency of data on the mobile devices and the desktops located at the back office, the data was synchronized between these two end points.
The goal of the study was to investigate the following research questions:
a) Which types of tasks are suitable to be executed with the mobile application (i.e. while walking or standing)? b) How much influence does domain knowledge has on task
performance?
c) How do age and personal background influence task performance with the mobile application?
d) How can empirical evidence for “business process improvement through the usage of mobile tools” be depicted?
III. RELATED WORK
Evaluating the usability of mobile tools poses a number of challenges due to their nature. User mobility investigations
need appropriate approaches: There are studies which discuss the question whether the evaluation should be carried out in a laboratory surrounding or field context [[8][11][12][20]]. The common message of these papers is that they apply a multi-method approach to usability testing and discuss optimal solutions for efficient data analysis.
The analysis of collected empirical data of usability studies is a time-consuming activity. However, while there is a strong body of human-computer interaction research on choices of data collection methods and techniques, data analysis and the validation of data is only vaguely described by many authors, e.g. [[17][20][23]]. Many methods and techniques exist for analyzing the empirical data from usability evaluations like, for example, grounded analysis, video data analysis [[15][24]], cued-recall [18], and expert analysis [16]. The optimal method triangulation of many authors seems to be a thorough grounded analysis or video analysis with detailed log-files and transcriptions of usability evaluation sessions [24]. While this method triangulation delivers in depth usage data the analysis process is time consuming and often not applicable in industry due to time and resource constraints [2]. For the evaluation of mobile tools the balance between the costs and the value added by the subsequent results has been questioned [17] and is still in doubt as there are no decent guidelines on how to conduct those studies within tight budget boundaries.
Consequently after literature review [[12][14][20][25]] we identified four methods which were suitable for our usability study of a mobile application in a setting which was as close to real life as possible. For a detailed method overview we have to refer to the literature [[12][14][20][25]] as this would go beyond the scope of this paper.
The application of a single method involves the risk that if this method gives a measurement bias, then the experiment will be misleading [27]. By involving different methods they can be cross-checked against each other. Therefore, we decided to apply logging of scenario-based tasks, questionnaires, video capturing, and unstructured interviews.
In Table 1 we compare the four chosen methods according to their upfront investment cost and the effort needed for data analysis per subject after test execution. The effort is estimated with reference to [12].
TABLE 1: INVESTMENT AND ANALYSIS EFFORT PER METHOD
Method Investment Analysis
Log files High investment for the first time; implementation of logging mechanism in code (~ 40 hours)
structured log files; effort for data analysis per subject (~ less than 1 hour)
Video capturing Average investment for equipment
High effort per subject (~ 2-3 hours) Questionnaire Medium investment
(~10-15 hours)
Medium effort per subject (~ less than 1 hour) Interviews Medium investment
for payment of evaluator (~ 1-2 hours)
High effort for transcription and analysis of interview data (~ 5-10 hours)
between successful interactions and errors and the time needed to solve a task. Performance referring to usability considerations in our context is the number of executed tasks in a certain period of time including error counts and the number of clicks needed to solve a task (quantitative measures); note we also refer to field technician performance measures. These measures refer to the work performance of a field technician and include measures like working- and driving time as well as the number of used spare parts.
The number of required clicks has been compared among the participants and with expert users. This evaluation method was applied to interpret the log files. We used a reference process [[9][19]] which showed the most efficient/effective way to fulfill the tasks.
An alternative approach to gain quantitative data during the execution of usability tests provides the model of goals, objects, methods and selection rules (GOMS) [22]. However the GOMS model is not suitable for mobile devices as it does not provide metrics for mobile devices (e.g. virtual keyboard interaction) and was therefore not applied in the study.
Table 2 shows the investigated factors and their expected impact on study data. Therefore we chose the observed variables described in detail in the method section.
The age of the subject was chosen because we expected that age and personal background (e.g. computer literacy, mobile tool affinity) would have an impact on performance. We are perfectly aware that this causes a certain research bias which was favored in this experiment. Due to the focus on task performance we wanted to compare the performance variance of mobile technology literate people with non literate people. Due to the fact that younger people are often more mobile technology affine [17] we expected that the performance of elderly people (number of errors, time to solve a task) would decrease.
Task performance was measured in order to compare performance data (error rate, time to solve a task, number of clicks taken) among the test subjects. This data allows us to conclude how easy the application is to use and learn. As already mentioned we increased the number of subjects compared to typical usability studies (typical number is 5-10 subjects, [17]) in order to lower single performance outliers. In order to observe the varying mobility of the subjects we conducted the study in a laboratory as well as in a field setting.
TABLE 2: FACTORS AND IMPACT
Factor Impact
Participant background Performance, error rate, time to solve a task, number of clicks taken
Age Performance, error rate, time to solve a task, perceived easy of use and usefulness Task performance Error rate, time to solve a task, number of clicks
taken
Number of subjects Lowering of performance variation Mobility of users Performance, error rate, time to solve a task,
number of clicks taken
Laboratory vs. field Controllability of variables, bias caused by subject distraction
During the execution of the experiment we wanted to gather qualitative as well as quantitative data. Quantitative data would not have been sufficient for this analysis approach. For the qualitative study we analyzed the number and the severity of the found usability problems. Within this experiment we classified the severity of usability problems as follows [7]:
• [1: Prevents Task] Prevents completion of task • [2: Significant Delay] Causes significant delay or
frustration
• [3: Minor Effect] Presents a minor effect on usability
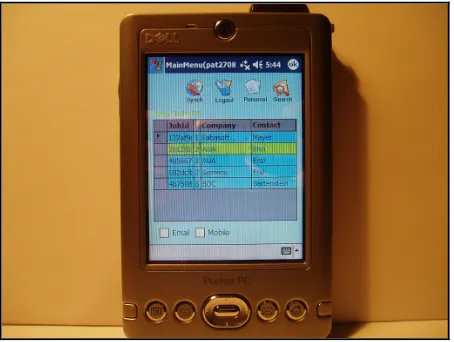
• [4: Suggestion] Suggests a potential enhancement. Basic usability of the software was assured through the consideration of mobile interface heuristics [26] and usability inspection [17] during the development cycle. But these methods can not replace testing with real users [17] consequently we expected to still find usability problems. Figure 1 shows a photo of the mobile support tool. On the screen new jobs are listed in order to illustrate the general navigation within the application.
Figure 1: Screen shot of the Applications
The difference in our research approach was based on non-intrusive methods of observation like log files. In order to link semantic data to the log files we applied a pre and post study questionnaire, non structured interviews and video capturing for the recording of the Pocket PC interaction.
IV. METHOD
A. Research Approach and Study Design
In the study we had 30 subjects to avoid anecdotal evidence and had a wider range of subjects (subjects differed in age, background and computer literacy) to smoothen subjective performance variance. The study lasted about one hour to one hour and a half. Tool usability and workflow optimization of the mobile support tool was assured by iterative development cycles.
[image:4.612.312.539.303.474.2]non-intrusive methods of observation and on purpose did not use a camera to lower this risk. Instead we used an automated video capturing tool1 which recorded the interactions of the subjects in the mobile application.
As we conducted a field study the context comprises possible factors that can affect the subjects during a case study. These might be external and/or environmental impacts as well as personal influences. External or environmental impacts are for example situations where the user is disturbed by the noise level or the interaction with the surrounding. Personal factors are for example stress, pressure and motivation [10].
In the study we eliminated context influence factors like: pedestrians walking by, visual distraction (e.g. lighting), interaction with persons, and hindrances regarding movement in order to focus on the main task and process performance.
Course of Events and Study Tasks: During the study the subjects executed the following tasks: work on a job, update the KnowledgeBase, change certain details (e.g. personal details) and search for an already occurred problem in the KnowledgeBase.
At the same time all executed actions of the subjects were logged and the video capturing tool recorded the screen of the PocketPC. After solving the tasks the subjects were asked about the „perceived usefulness” and the „perceived ease of use” of the mobile application. In order to get quantifiable variables and to get an idea how users come to accept and use a technology, the Technology Acceptance Model (TAM) was used [5]. Finally a short informal interview served to get instant user comments and feedback on the overall interaction with the mobile device.
B. Experiment Variables
In this section we will explain which independent and dependent variables have been observed and why we have chosen them as indicators to answer the research questions.
Independent variables are variables which are not influenced by the study setting, the test facilitator or external factors like noise or lighting [27].
Dependent variables are variables which are influenced e.g. by context factors of the study (laboratory vs. field), noise level, ringing cell phones or other persons walking by [27].
Independent variables:
Context comprises possible factors that may affect the subject during usability tests with the mobile device. These might be external and/or environmental impacts as well as personal influences. Environmental impacts are for example situations where the user is disturbed by the noise level or the light intensity. However personal factors like stress or disease concern the personal condition [10].
Mobility refers to the behavior of the subject, whether for example he/she is walking or standing. The mobility can be subdivided in the following types [13]. (a) Visiting is working in different places for a significant period of time (b) traveling
1
Pocket Controller-Professional. SOTI Inc. (http://www.soti.net).
is working while traveling in a vehicle, such as an airplane or a train (c) wandering is working while being locally mobile.
Experience describes knowledge regarding PocketPCs, mobile devices and PCs in general.
Age this variable concerns the age of the subjects. As described above we expected an impact of this variable on the performance variables, time, errors and clicks.
Dependent variables:
Time for solving a task represents the first of our performance variables and shows the time a subject needs to solve a task. The time is dependent on the subject’s experience.
Number of errors within a task (error rate) is the second variable of performance measurement. This variable should exhibit the number of errors a subject makes during the execution of a certain task. The error rate is dependent on the experience of a subject.
Number of clicks required for a task, the third performance variable depicts how many clicks a user did inside the application, back- and forward button have not been counted. The amount of clicks is dependent on the subject’s experience.
Perceived Usefulness and Perceived Ease of Use represent the usability factors. The perceived usefulness represents the usefulness of the mobile application for daily work. The perceived ease of use exhibits the subjective felt satisfaction when using the mobile tool. We used the Technology Acceptance Model (TAM) [5] because this model represents one of the most influential extensions of the Ajzen and Fishbein’s theory [1] which focuses on the understanding and prediction of social behavior. Furthermore the robustness and validity of the two measures were tested by several studies. The two variables give insights about the usefulness of the application in the working life of the subject and the ease of use of the corresponding application.
C. Subjects
The study was conducted with 30 subjects, out of which 11 executed the usability test within a laboratory and 19 in a field setting. We had fewer subjects in the laboratory as those persons only served as a control group for the field study.
The age of the subjects ranged from 21 to 60 years. The mean value of age was 39.9 years and the median value was 47 years. Participants with an age under the median were classified as young and respondents with an age greater or equal to 47 years were classified as old. To be exact, four young and nine old female as well as eleven young male and six old male took part in the study.
D. Study Materials
Prior to the empirical study we executed a pre-test phase. There we presented the questionnaire to three test subjects. Furthermore the video capturing tool and the logging mechanism were tested in a pre study.
and mobile devices. Thus each subject had to state the experience with PCs, mobile devices and how frequently they use them. Especially the use of the Internet, PC and mobile devices was questioned. We assumed that computer literacy and experience in the use of mobile devices would influence the test results positively. This part of the questionnaire had to be filled in before the subject performed the test tasks and also contained demographic data. The whole questionnaire was realized as a little stand-alone application directly on the PocketPC. The subjects were identified at a login screen by their user-ID. During the execution of the tasks log-files were created through the instrumented mobile application to get quantitative data about the time for solving the tasks, the error rate, the number of clicks, respectively the way used to solve a task. For efficient data preparation the questionnaire application realized a replication mechanism, which transferred the data stored on the PocketPC to a database. This process reduced the time and effort for the evaluation considerably. We applied scenario-based testing, which means that the subjects had to execute specific tasks in a predefined period of time. After solving the tasks the participants were asked about the „perceived usefulness“ and the „perceived ease of use“ of the mobile application [5]. In order to get qualitative variables and to get an idea how users come to accept and use the mobile tool.
We conducted the study in a laboratory as well as in a field environment. First the mobile application was tested in the laboratory setting. During the tests in the field the tasks were conducted in an environment which was as close to real life conditions as possible e.g. the participants had to be walking. To get qualitative data the video capturing tool was used either by WLAN in the field or USB cable in the laboratory.
For all usability tests a between-subject design was used whereas the tasks remained the same [27]. To avoid position effects the order for the lab and field environment was randomly chosen. For example the first subject started with the laboratory setting the second one in the field situation, the third in the laboratory again and so on.
After the test we conducted a brief informal interview to learn where the subject had particular problems.
E. Data Analysis Approach
As we wanted to gather empirical evidence for process improvements through the usage of appropriate mobile tools we applied the first four out of the six steps of the goal-oriented measurement process of [4]:
Step 1: Characterization of the project environment. This characterization is mainly qualitative in nature. In our case this was the description of the laboratory as well as the field conditions. Typical questions are: What kind of product is being tested? What procedure is being used? What are the main problems encountered during this projects?
Step 2: Identify measurement goals and develop a measurement plan. Define the measurement goals based on the information gathered during Step 1. For each measurement goal we derived the important attributes to be measured by
involving important project stakeholders like project personnel and/or management. We documented the definition of the measures and their underlying motivations in the measurement plan.
Step 3: Define data collection procedures. For all measures identified during Step 2, data collection procedures have been defined, i.e., how and when the data has to be collected and who is responsible for the collection.
Step 4: Collect, analyze and interpret data. We collected the study data, analyzed and interpreted the analysis results with the help of test facilitators and management (industry project partners).
The process gave valuable guidelines for data analysis; the results are displayed in the following section.
In order to analyze our data with a multivariate analyses of variance (MANOVA) an univariate analyses of variance has been conducted. Section 4 gives a detailed overview of our study results.
V. RESULTS
In this section we will give an overview of our results concerning our research question and explain briefly quantitative and qualitative analysis.
a) Which types of tasks are suitable to be executed with a mobile application while walking or standing (e.g. writing, selecting, information gathering)?
The analysis of the questionnaire and the informal interview led to the following distinction among tasks which are appropriate to be executed with a mobile application while walking or standing. Tasks were determined as appropriate if the subjects gave good ratings (very good or good) at the corresponding questions on the perceived easy of use and usefulness.
Appropriate tasks:
• Selecting information about customers previous problems • Search a location
• Search a problem solution suggestion
• Reading certain documents Inappropriate tasks:
• Writing extensive messages of e.g. problem reports – the input of long text messages are very cumbersome due to the necessary usage of the virtual keyboard.
• Applications which require a lot of interaction and/or concentration of the user are inappropriate for mobile devices due to disturbing and influencing context factors. In this case we suggest that mobile applications should be primarily used as information systems and not as interaction systems. This is the purpose of the field technician support tool, as the interaction degree is rather low and limited to selection and search whenever possible.
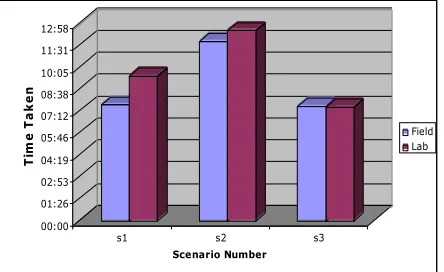
The analysis of the needed time and errors were based on the log-files evaluation in comparison with a reference path (the reference is the shortest way to solve a problem, using the least numbers of clicks to solve a task). First we analysed the time needed to solve the specific scenarios during the test. The following table presents the corresponding mean values of the time needed for each scenario in the lab as well as in the field. The time is indicated in minutes.
Figure 3: Time comparison between lab and field in minutes
The diagram shows that up to the third scenario the users in the field were always faster than the users in the lab with mean values of 07:40 in scenario 1 and 11:50 in scenario 2 to 09:33 and 12:32 in the field. Only in the third scenario the test users were 2 seconds slower (07:31 in the lab and 07:33 in the field)
Baillie and Schatz [2] categorized the results of their study concerning the time needed to solve the tasks according to reference values. These values were measured in a pre-testing phase by 2 expert users. Furthermore Dumas [6] defined a scale for certain tasks like reading an email but for desktops. According to our scenarios and tasks the reference values could be classified as follows:
TABLE 3: SCALE FOR THE TIME NEEDED TO SOLVE THE SCENARIOS
Scenario Excellent
(min)
Acceptable (min)
Unacceptable (min) s1 < 7 7-10 > 10
s2 < 10 10-15 > 15
s3 < 6 6-10 > 10
We also used the values from two expert users to gather the above depicted reference values.
In the first scenario the test users had to check if new job descriptions are available. The new job had then to be processed. Especially some job details and details of the corresponding client had to be changed and inserted. The second scenario took longer because there it was necessary to interact a lot with the virtual keyboard.
b) How much influence does domain knowledge has on task performance?
The analysis of the questionnaire and the informal interviews showed that domain knowledge and computer
literacy have significant influence on process performance. Subjects who where highly computer literate could give detailed information about problems they had with the application and made improvement suggestions.
[image:7.612.66.288.166.302.2]The univariate analyses of variance of the three performance variables concerning the experience confirmed the results of the multivariate analysis of variance.
TABLE 4: IMPACT OF EXPERIENCE ON TIME, NUMBER OF ERRORS AND CLICKS
Tests of the intermediate subject effects
Independent variable
Dependent variable
p-Value Significance
Experience Time p = 0.001 most significant Experience Errors p = 0.025 significant Experience Clicks p = 0.026 significant
c) How do age and background (e.g. experience) influence task performance?
The age did not have any significant effect on performance. The experience had a highly significant effect on the time to solve the tasks. Furthermore the experience had a significant effect on the number of errors and required clicks.
We performed both a multivariate analysis of variance and several univariate analyses of variance. The MANOVA exhibits that the age has no significant effect on the performance. However the experience had a highly significant effect on the performance, as we expected, which is represented by the time, the number of errors and the number of required clicks. Furthermore the combination between the variables age and experience had no significant effect on the performance.
TABLE 5: MANOVA – IMPACT OF AGE AND/OR EXPERIENCE ON PERFORMANCE
Multivariate tests
Independent variable
Dependent variable
p-Value Significance
Age Performance p = 0.190 - Experience Performance p = 0.007 highly
significant Age *
Experience
Performance p = 0.103 -
The univariate analyses of variance of the three performance variables concerning the experience confirmed the results of the multivariate analysis of variance.
d) How can empirical evidence for business process improvement through the usage of mobile tools be depicted?
and elaborated a business case together with the CFO (Chief Financial Officer) of our partner company. Initial investigations of business metrics like: (a) labor time, (b) used spare parts and (c) driving time after the mobile tool integration showed positive business process improvements along the project business case and beyond. For example paper handling time could be reduced by 30 min. per day and technician. Moreover back office calls could be reduced by 50% and the invoicing cycle could be shortened from 17 days down to 7 days. A shorter invoice cycle also reduces the time the customers receives an interest free credit. Latency in invoicing caused costs up to 20,000 per year before the mobile tool integration.
The performance improvements estimated in percent are based on the worst-case scenarios and are expected to be more than 12% of the corresponding unproductive costs (e.g. redundant calls to the back office, double data entry).
The most conservative estimations result in an approximate saving of 60,000 per year.
Performance improvement is based on, less redundancy, less media breaks and shorter handling time per order. Collocations are based on the process level and do not include acquisition costs of the mobile devices.
VI. DISCUSSION
Domains with a high degree of mobility, like field technicians need business process optimization to fulfill tight service contracts. Integration of mobile workflows in the business process chain promises to improve process performance.
Main results of the above described study are: (a) non-intrusive observation methods like logging helped collecting valid performance data efficiently and (b) use context has a significant impact on performance measures (e.g. time, errors and required clicks per task).
Regarding the results of the evaluation methods it was very interesting that the test users in the field could solve almost all scenarios faster and with fewer errors than the users in the lab. Baillie and Schatz [2] said that this phenomenon could be caused by the mobile application itself. The application was implemented and tailored for the mobile context and thus could be easier to use in one of this main contexts. Furthermore they state that the test users in the field seemed more relaxed. They can behave in a natural way and can undertake any tasks they would normally do. Another reason could be directly the opposite. It could probably be caused by a higher stress factor in the field than in the lab. The user has to be aware of the changing environment – the traffic, other people, etc. The test users are more concentrated and try to solve the scenarios quicker to finish the tests as soon as possible.
The results are useful for decision makers CFOs and CTOs (Chief Technology Officer) who want to improve process performance through the integration of mobile workflows in
the process chain. This can be reached through the application of mobile devices and the creation of MIBPs.
Mobile software applications can support such processes under two requisites: (a) an optimized underlying workflow and (b) a usable mobile interface.
With the study we provided empirical evidence for process improvement through workflow optimization with a usable mobile tool. Optimized underlying process structures are a requisite for process support with a mobile solution. Previous empirical studies provide valuable suggestions for method triangulation for the usability investigation of mobile applications but do not consider business process improvement considerations.
We could determine effects of the mobility on the perceived ease of use. The experience of the subjects has significant effects on the performance and age and experience have significant effects on the perceived ease of use. We could show empirical evidence that with the underlying optimized process and the mobile solution process performance improvement can be achieved. These results where essential for investment decisions of our study partner in the practical application of the mobile solution.
Referring to the evaluation methods we are able to conclude with the knowledge that our questionnaire and log files were a firm basis for statistical evaluation of the collected data. The questionnaire implemented as a small mobile application reduced the preparation of the statistical data considerably. Furthermore we could extract all information regarding the time, the errors, the number of clicks and the solution path from the log files.
VII. CONCLUSION
Our research combines usability and process performance issues. The results show which tasks are suitable for mobile application support, which personnel is most likely to benefit from mobile tool support and what improvements on business metrics such as labor time, back office capacity, and invoice cycle are to be expected.
The described study lays the baseline for further studies and offers important insights in measurement calibration in field studies. For example the application of user diaries in case if log file analysis does not work during the whole time or for refinement of semantic data.
Part of our future work will be to examine empirical studies with field technicians in two service companies. This will provide valuable insights for process performance improvements through the usage of mobile tools in different company settings.
ACKNOWLEDGMENT
Dietmar Winkler for extensive discussions and feedback in various stages of this work.
REFERENCES
[1] I. Ajzen and M. Fishbein, Understanding Attitudes and Predicting Social Behavior. Englewood Cliffs, NJ, USA: Prentice-Hall, 1980. [2] L. Baillie and R. Schatz, “Exploring multimodality in the laboratory
and the field,” in ICMI ’05: Proceedings of the 7th international conference on Multimodal interfaces. New York, NY, USA: ACM Press, 2005, pp. 100–107.
[3] P. E. Green and D. S. Tull, Research for Marketing Decisions. Englewood Cliffs, NJ, USA: Prentice-Hall, 1988.
[4] L. C. Briand, C. M. Differding, and H. D. Rombach, “Practical guidelines for measurement-based process improvement,” Special issue of International Journal of Software Engineering & Knowledge Engineering, 1997.
[5] F. D. Davis, “Perceived usefulness, perceived ease of use, and user acceptance of information technology,” MIS Quarterly, vol. 13, no. 3, pp. 318–339, 1989.
[6] J. S. Dumas and J. C. Redish, A Practical Guide to Usability Testing, Exeter, UK, 1999.
[7] M. R. Ebling and B. E. John, “On the contributions of different empirical data in usability testing,” in DIS ’00: Proceedings of the conference on Designing interactive systems. New York, NY, USA: ACM Press, 2000, pp. 289–296.
[8] J. Goodman, S. Brewster, and P. Gray, “Using field experiments to evaluate mobile guides,” in Proceedings of 3rd Annual Workshop on HCI in Mobile Guides, 2004.
[9] D. M. Hilbert and D. F. Redmiles, “Extracting usability information from user interface events,” ACM Comput. Surv., vol. 32, no. 4, pp. 384–421, 2000.
[10] K. Hoyoung, K. Jinwoo, L. Yeonsoo, C. Minhee, and C. Youngwan, “An empirical study of the use contexts and usability problems in mobile internet,” in Proceedings of the 35th Hawaii International Conference on System Sciences, 2002, pp. 134–144.
[11] J. Kjeldskov and J. Stage, “New techniques for usability evaluation of mobile systems.” International Journal on Human and Computer Studies, vol. 60, no. 5-6, pp. 599–620, 2004.
[12] J. Kjeldskov, C. Graham, S. Pedell, F. Vetere, S. Howard, S. Balbo, and J. Davies, “Evaluating the usability of a mobile guide: The influence of location, participants and resources,” Behavior and Information Technology, vol. 24, no. 1, pp. 51–65, 2005.
[13] S. Kristoffersen, J. Herstad, F. Ljungberg, J. Sandbakken, and K. Thoresen, “Developing mobile cscw scenarios,” in Proceedings of IRIS 21, Aalborg University, Denmark, 1998, pp. 509–518. [14] T. Lindroth, S. Nilsson, and P. Rasmussen, “Usability takes a hike!”
2000.
[15] N. P. Nayak, D. Mrazek, and D. R. Smith, “Analyzing and communicating usability data,” ACM SIGCHI Bulletin, vol. 27, no. 1, pp. 22–30, 1995.
[16] J. Nielsen and R. Molich, “Heuristic evaluation of user interfaces,” in Proceedings of the SIGCHI conference on Human factors in computing systems: Empowering people, April 1990, pp. 249–256. [17] J. Nielsen, Usability Engineering. San Francisco, CA, USA: Morgan
Kaufmann Publishers Inc., 1993.
[18] M. Omodei, A. J. Wearing, and J. P. McLennan, “Head-mounted video and cued recall: A minimally reactive methodology for understanding, detecting and preventing error in the control of complex systems,” in Proceedings of 21st European Annual Conference of Human Decision Making and Control, 2002. [19] P. Partanen, “Collecting actual use events from browser-based user
interface-model and implementation,” 2003.
[20] S. Po, S. Howard, F. Vetere, and M. B. Skov, “Heuristic evaluation and mobile usability: Bridging the realism gap,” in Mobile HCI, 2004, pp. 49–60.
[21] J. Preece, Y. Rogers, H. Sharp, D. Benyon, S. Holland, and T. Carey, Human-Computer Interaction. Wokingham, UK: Addison-Wesley, 1994.
[22] J. Raskin, The Human Interface, New Directions for Designing Interactive Systems. Addison Wesley Longman, 2000.
[23] J. Rubin, Handbook of usability testing: How to plan, design, and conduct effective tests. New York, USA: John Wiley and Sons, 1994.
[24] P. Sanderson and C. Fisher, “Usability testing of mobile applications: A comparison between laboratory and field testing,” Human-Computer Interaction, vol. 9, pp. 251–317, 1994.
[25] B. Shneiderman, Designing the User Interface: Strategies for Effective Human-Computer Interaction. ADDISON-WESLEY, 1998. [26] F. Vetere, S. Howard, S. Pedell, and S. Balbo, “Walking through mobile use: Novel heuristics and their application.” in Proceedings of the OzCHI 2003, Brisbane, Australia, 2003.