A Distribution based Approach of
Outlier Removal for Software Effort Data
ABSTRACT
There are unavoidably a few outliers in the software measurement data. When software effort estimation models are made using the data samples with outliers, these models reduce the effort estimation precision for future planning. Therefore, this work investigated the influence of outlier upon the accuracy of prediction and proposed a distribution based outlier elimination method for effort estimation. The proposed work shows that the applied outlier elimination method improves the estimation accuracy of the software effort estimation process. In contrast, the effects of outlier elimination on the accuracy of effort estimation may differ depending on the characteristics of the data set, the effort estimation method.
Keywords
COCOMO, EAF, MRE, MMRE, PRED.
1.
INTRODUCTION
To estimate an accurate software cost, many organizations use a software effort estimation model built upon their project history data. However, these project history data contain outliers that can degrade project data quality. The outlier is defined as a set of data to be an observation that appears to be inconsistent with the remainder of the set of data [1]. It is caused by:
The instable project environment such as frequent turnover of developers.
The rare event such as performance of large- scaled project in the software organization that mainly performed small-scaled projects.
The measurement mistake such as human collector‟s confusion between LOC and KLOC.
Outliers can distort the linear regression model, affecting the accuracy and stability of the model. Unfortunately, software data sets often contain outliers. This problem is caused by inconsistency and ambiguity in the definition of software terms (i.e., size and effort), imprecision in the data collection process, and the lack of standardized software processes [2, 3, 4]. To handle possible outliers in software data sets, several techniques has been used often, including building robust regression models, transforming the data, and identifying and eliminating outliers from the rest of the data set [2, 5, 6].
The remainder of this paper is organized as follows. Section II briefly reviews existing work for uncertainty in software estimation datasets. In Section III, the proposed work is discussed, IV gives experimental results and V draws the conclusions.
2.
LITERATURE SURVEY
Musilek et al. [7] have demonstrated that small errors in the COCOMO II model can lead to large changes in the
estimate. Clearly, to get an accurate effort estimate, relevant project metrics must be measured carefully and consistently.
Size and effort multipliers are very important and adequate time and resources should be devoted to their accurate evaluation. The scale factors are much less important and could be neglected (set to their nominal values) if necessary.
The sensitivity issue shown by Musilek highlights a symptom of the larger problem of uncertainty. Indeed, software effort estimation is widely recognized as an inherently uncertain task. Assessing the uncertainty of the estimate is one of Jorgensen‟s twelve best practice guidelines for effort estimation. This uncertainty may be a contributing factor to the deviance problem.
Beyond carefully collecting metrics, Musilek et al. proposed using fuzzy sets for the input variables, and finished that the administrator should, “no longer missing with a solitary number estimate that could be very confusing.” This means that the imprecision of the input variables is gathered. This is an important task too often ignored by the effort estimation research community. Jorgensen [8, 9, 10] has investigated the psychology of gathering metric ranges from developers, and found that merely changing the phrasing of the question changing the metric ranges.
Instead of asking the estimators to provide the minimum and maximum effort values based on given assurance levels, e.g., “almost sure” or “90 % sure”, it looks to be better to inquire them to assess the probability of the actual effort being higher or lower than a definite value. e.g., outcomes recommend that it is better to ask the estimator, “How expected is it that the development will need further 1.700 work-hours?” more readily than, “What is the highest cost of the development? Be 90 % sure.” In addition, Jorgensen found that the developers might have other motives than realism when providing ranges of uncertainty. The developer had somewhat less real values inside the minimum-maximum interval, and then given those insignificant, wide effort intervals. This is an unfortunate reality, especially considering that; “low estimation accuracy is not necessarily an indicator of low estimation skills when the software development project work is highly uncertain.”
Kitchenham and Linkman [5] have described four sources of estimation uncertainty.
• Measurement error is an error from accuracy limitations in the input variables of the model.
• Model error is an error due to the model‟s abstractions from reality.
• Assumption error is error from making incorrect assumptions about a model‟s input parameters.
• Scope error is an error from estimating outside the
Amit Sinhal
Dept. of Computer Sc. & Engg. Technocrats Institute of Technology,
Bhopal, India
Bhupendra Verma
Dept. of Computer Sc. & Engg.
model‟s domain.
Another source of error mentioned by Dosban and Pataricza [11] is a, “statistically insufficient number or representativeness of the basic data set serving for extrapolation.” This is a important feature that is simply ignored. Tuned models should be given a sufficient amount of data for calibration.
Boehm recommends a minimum of 5 records for local calibration of his COCOMO model. Ideally there should be many more records.
Many models have adapted to incorporate measurement error. This is done by representing both the input variables and the output estimate as a range instead of point values. For example, Tian and Noore [12] warn that the discretization of effort multipliers used in COCOMO into six category results in an inherent uncertainty in the historical data, and thus methods such as fuzzy logic should be used to account for this inherent ambiguity. This has been accomplished for effort estimation using fuzzy logic, Bayes algorithm, and through Monte-Carlo simulation. Fuzzy logic and Bayes algorithm require developing an estimation model to work directly with their distributions, but the Monte-Carlo simulation does not. This is because it simply samples discrete instances from a distribution and calls an existing model used for discrete input. Thus, Monte-Carlo simulation is better suited for use with pre-existing models, while the other two methods should be considered if developing a new model.
A more severe source of measurement error is an estimation with incomplete data. Although techniques exist for estimating effort with incomplete data, it is still advised to use complete data sets. In an impressive display of ability despite incomplete data, Menzies et al. [13, 14] considered uncertainty from a more positive angle and realized that if you can describe all of your model‟s input parameters using ranges found from the industry, then it is possible to make estimates without calibration data at all. Further evidence of uncertainty in software effort estimation is the attribute instability problem identified by Menzies et al. [15] regarding Boehm‟s delta estimation method. The delta estimation method proposed by Boehm works by basing the estimate off of similar previous projects and adjusting for the delta between the new and the old using the COCOMO cost drivers. Each of Kitchenham‟s [16] uncertainty operators can potentially explain this instability. The most unsettling potential cause is that of scope error in the case in which the true correlation between the attributes and the target variable has indeed changed due to the different domain.
Jorgensen found experts tend to be overconfident about the uncertainty of their estimates. A study by Gruschke and Jorgensen [17] investigated the ability of experts to improve at uncertainty estimation using a feedback mechanism. They found some experts could improve, however, they also found, and “that we cannot expect uncertainty assessments to improve when they are dominantly intuition-based.” This result suggests that additional controlled methods for uncertainty assessment should be used. Model-based effort estimation methodologies have the potential to excel at representing this uncertainty [18, 19]. One of the goals of this work is to represent estimation uncertainty by accounting for Kitchenham‟s sources of estimation error. In addition, a goal of this work is to reduce estimation uncertainty. A brief review given by Khatibi et. al. [20] and Sinhal et. al. [21] on effort estimation methods. Data Mining [23] and Soft Computing techniques [24] improves the estimation
accuracy and reduce uncertainty in data.
3.
PROPOSED METHOD
The COCOMO 81 model is a regression based model derived by collecting data from a large number of software projects [4]. It is considered to be one of the most cited, well-known and most plausible effort and cost prediction model. This dataset consists of 63 software projects and 17 features. The features include Size, Actual Effort and 15 Effort Multipliers (EM).
The estimated effort in person-months (PM) for the intermediate COCOMO is given as:
EAF
[Size]
A
=
Effort
B
(1)
Effort Adjustment Factor (EAF) is:
151 i
i
EM
EAF
(2)
Since
Effort
Size
andEffort
EAF
Hence Effort is dependent on Size and EAF.Now we can calculate Ratio of Effort and Size * EAF as ER (Effort Ratio):
EAF)
*
(Size
Effort
=
ER
(3)
Relative Error (RE), Magnitude of Relative Error (MRE) is computed as follows:
AE
AE
-EE
=
RE
(4)
Where EE is Estimated Effort & AE is Actual Effort.
AE
|
AE
-EE
|
=
MRE
(5)
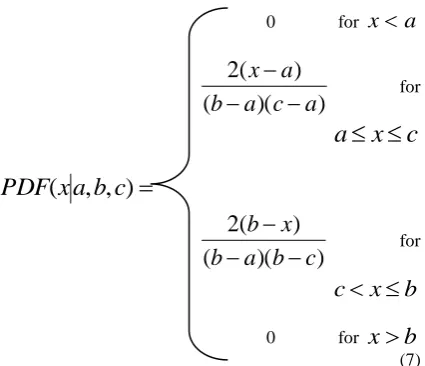
One way to represent the uncertainty in a variable is to use a distribution. The distributions used here are triangular for their simplicity and ability to skew the median. Triangular distributions are often used in business simulations or project management simulations when there is only limited sample data (e.g. the relationship between variables is known but data is scarce).
Formally, a triangular distribution is a continuous probability distribution with lower limit a, mode c and upper limit b with the ranges
b
c
a
a
b
a
(
,
),
,
(6)
0 for
x
a
)
)(
(
)
(
2
a
c
a
b
a
x
for
c
x
a
)
,
,
(
x
a
b
c
(
)(
)
)
(
2
c
b
a
b
x
b
for
b
x
c
0 for
x
b
(7) The proposed method will have following steps:
Calculate the Effort Ratio (ER) and Magnitude of Relative Error (MRE) of all the projects in the dataset.
Sort the projects in ascending order with respect to ER.
Considering the triangular distribution, to calculate the lower limit „a‟ of ER, the MRE is compared with a threshold value from top of the list, when MRE is found lower than threshold, the value of ER is assigned to „a‟.
Similarly, to calculate the upper limit „b‟ of ER, the MRE compares with a threshold value from the bottom of the list, when MRE is found lower than threshold; the value of the ER is assigned to „b‟.
Now calculate the „c‟ and PDF of each project in the dataset.
4.
EXPERIMENTAL RESULTS
[image:3.595.87.300.77.260.2]After applying the formula given in equation 3 for calculation Effort Ratio on the COCOMO81 dataset, we get the results as shown in the Table 1.
Table 1: Effort Ratio of 63 projects in COCOMO81 dataset
ID Effort Ratio ID Effort Ratio ID Effort Ratio
17 1.283721 13 3.70705 6 5.763963 37 2.104367 45 3.710275 12 5.802257 38 2.229629 63 3.884739 54 5.847295 53 2.288457 11 3.937519 10 6.39769 46 2.335829 61 3.998476 2 6.483402 44 2.48606 60 4.002591 22 6.487082 28 2.682064 4 4.00745 33 6.496252 16 2.761052 14 4.044475 20 6.648227 40 2.763678 47 4.11179 9 7.001785 7 2.884644 57 4.216529 34 7.091108 30 2.996595 41 4.449032 24 7.502831 43 3.027671 58 4.772357 19 7.862968 35 3.031597 18 5.035442 1 7.889943 29 3.118586 15 5.139106 23 7.919763 5 3.143243 51 5.293863 26 8.220614 32 3.16293 3 5.31678 55 8.31251 59 3.164988 27 5.439545 8 8.868325 39 3.32777 31 5.591581 21 11.21152 62 3.607633 49 5.682517 25 11.41372 48 3.616214 50 5.727512 56 13.33456 52 3.633674 36 5.745162 42 41.4608
As per the steps given in proposed methodology, we calculated the value of a = 2.761052 and b = 7.919763. Hence the projects having Effort Ratio less than the value of „a‟ and greater than the value of „b‟ will be treated as outlier. In this experiment 7 projects are below a and 7 projects are above b. So total 14 projects are outlier out of 63 in this dataset and rest 49 are considered for the effort estimation.
Performance of estimation methods is evaluated using several metrics including Mean Magnitude of Relative Error (MMRE) and Percentage of the Prediction (PRED), which are computed as following:
N1 i
i
MRE
MMRE
(8)
N
A
=
(X)
Pred
Where, A is the number of projects with MRE less than or equal to X and N is the number of considered projects. The acceptable level of X in software cost estimation methods is 0.25 and the various methods are compared based on this level.
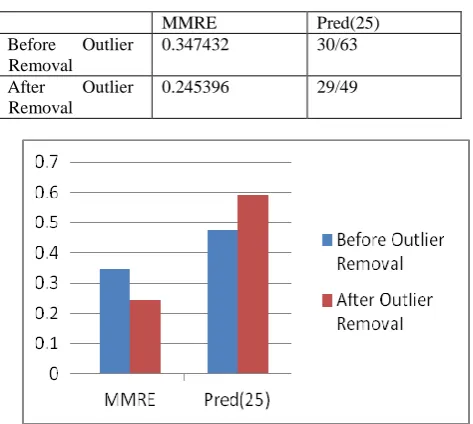
The values of MMRE and Pred (25) of this experiment are shown in the Table 2 for both the cases: Before Outlier removal and After Outlier Removal. Also Figure 1 shows a comparison graph of MMRE and Pred (25) for both the cases.
[image:4.595.76.313.238.450.2]The results show the significant improvement in accuracy as the value of MMRE decreases a Pred (25) increases after Outlier Removal.
Table 2: Comparison between MMRE and Pred (25) using Outlier Removal
MMRE Pred(25)
Before Outlier Removal
0.347432 30/63
After Outlier Removal
0.245396 29/49
Fig. 1: Graph of MMRE and Pred (25) for Outlier Removal
5.
CONCLUSION
Outlier is unusual data value. The effects of outliers are biased or distortion of estimates and faulty conclusions. The software effort estimation methods, which are built using the data samples with outliers, degrade the accuracy of effort estimation for software projects. Therefore, in this paper, a new outlier elimination method is proposed. We also examined the accuracy of effort estimation when applying outlier elimination method on a data set. The results show that after applying the proposed outlier elimination method, the estimation accuracy of the software effort estimation model improves by almost 30%. Since Soft computing exploits the tolerance for imprecision, uncertainty, approximate reasoning, and partial truth in order to achieve tractability and robustness. So after this outlier removal, soft computing techniques can be further applied for effort prediction to get promising outcomes.
6.
REFERENCES
[1] Yeong-Seok Seo, Kyung-A Yoon, Doo-Hwan Bae, “An Empirical Analysis of Software Effort Estimation with Outlier Elimination”, Proceedings of the 4th International workshop on
Predictor models in Software Engineering © ACM, 2008.
[2] Y. Miyazaki, M. Terakado, K. Ozaki, and H. Nozaki, “Robust Regression for Developing Software Estimation Models,” Journal of Systems and Software, Vol. 27, No. 1, pp. 3–16, 1994.
[3] Basili V. R., Freburger K., "Programming Measurement and Estimation in the Software Engineering Laboratory", Journal of Systems and Software, Vol. 2, No.2, pp. 47-57, 1981.
[4] Boehm B. W., Abts C., Chulani S., “Software Development Cost Estimation Approaches – A Survey”, Annals of Software Engineering, Vol. 10, pp. 177–205, 2000.
[5] Kitchenham and Linkman “Systematic Literature Reviews in Software Engineering”, Information and Software Technology, Volume 51 Issue 1, pp. 7-15, January, 2009.
[6] V. Chang and W. Wong., “Outlier Elimination in Construction of Software Metric Models”, Proceedings of the 22nd ACM Symposium on Applied Computing, pp. 1484–1488, 2007.
[7] Musilek P., Pedrycz W., “On the Sensitivity of COCOMO II Software Cost Estimation Model”, Proceedings of Eighth IEEE Symposium on Software Metrics, 2002.
[8] Jorgensen M., Boehm B., "Software Development Effort Estimation: Formal Models or Expert Judgment?” IEEE Software, Vol. 26, No. 2, pp. 14-19, 2009.
[9] Jorgensen M., "A Review of Studies on Expert Estimation of Software Development Effort", Journal of Systems and Software, Vol. 70, No. 1-2, pp. 37-60, 2004.
[10]Jorgensen M., “Practical Guidelines for Expert-Judgment-Based Software Effort Estimation”, IEEE Software, Vol. 22, No.3, pp. 57-63, 2005.
[11]Orsolya Durban and Andras Pataricza. “Cost Estimation Driven Software Development Process”, Proceedings of the 27 th EUROMICRO Conference, 2001.
[12]Liang Tian and Afzel Noore. “Multistage software estimation”, Proceedings of the 35th Southeastern Symposium on System Theory, pp 232–236, 2003.
[13]Menzies T., Port D., Chen Z., “Validation Methods for Calibrating Software Effort Models”, Proceedings of the 27th International Conference on Software engineering, ICSE ‟05: (New York, USA), ACM Press, pp. 587–595, 2005.
[14]Menzies T., Hihn J., "Evidence-Based Cost Estimation for Better-Quality Software", IEEE Software, Vol. 23, No. 4, pp. 64-66, 2006.
[16]Kitchenham B.A., Mendes E., "A Comparison of Cross-company and Within-company Effort Estimation Models for Web Applications", 8th International Conference on Empirical Assessment in Software Engineering, pp. 47-56, 2004.
[17]Tanja Gruschke and Magne Jorgensen. “Assessing Uncertainty of Software Development Effort Estimates: The Learning from Outcome Feedback”. In METRICS ‟05: Proceedings of the 11th IEEE International Software Metrics Symposium (METRICS‟05), page 4, Washington, DC, USA, 2005. IEEE Computer Society.
[18]I. de Barcelos Tronto, J. DA Silva, and N. Sant‟Anna, “Comparison of Artificial Neural Network and Regression Models in Software Effort Estimation”, International Joint Conference on Neural Networks, pp 771–776, 2007.
[19]Q. Song and M. Shepperd, “A New Imputation Method for Small Software Project Data Sets”,
Journal of Systems and Software, 80 (1): 51–62, 2007.
[20]Vahid Khatibi. B, Jawawi Dayang N.A, "Software Cost Estimation Methods: A Review", Journal of Emerging Trends in Computing and Information Sciences, Vol. 2, pp. 21-29, 2011.
[21]Amit Sinhal, Bhupendra Verma, “Software Development Effort Estimation: A Review”, International Journal of Advanced Research in Computer Science and Software Engineering, 3 (6), pp. 1-15, June 2013.
[22]Karel Dejaeger, Wouter Verbeke, "Data Mining Techniques for Software Effort Estimation: A Comparative Study", IEEE Transactions on Software Engineering, Vol. 38, No. 2, pp. 375-397, 2012.
[23]Amit Sinhal, Bhupendra Verma, “A Proposal of Novel Soft Computing Based Effort Estimation Model for Software Development”, CiiT International Journal of Software Engineering and Technology, Vol. 6, No. 6, 2013.
Prof. Amit Sinhal completed his B.E. in Computer Engineering from NIT Surat in 1996, M.Tech in Computer Science & Engineering from SATI Vidisha in 2005 and is pursuing Ph.D. from Rajiv Gandhi Technical University, Bhopal. He worked in various reputed software development companies as Project Lead and University Institute of Technology, Barkatullah University Bhopal as Assistant Professor. Currently he is working at Technocrats Institute of Technology, Bhopal as Professor in the Computer Science & Engineering department. He has published/presented more than 20 research papers in International Journals/Conferences.