http://dx.doi.org/10.4236/jcc.2015.311025
Image Classification Based on Histogram
Intersection Kernel
Hanbin Xi, Tiantian Chang
School of Science, Xi’an University of Posts and Telecommunications, Xi’an, China
Received October 2015
Abstract
Histogram Intersection Kernel Support Vector Machines (SVM) was used for the image classifica-tion problem. Specifically, each image was split into blocks, and each block was represented by the Scale Invariant Feature Transform (SIFT) descriptors; secondly, k-means cluster method was ap-plied to separate the SIFT descriptors into groups, each group represented a visual keywords; thirdly, count the number of the SIFT descriptors in each image, and histogram of each image should be constructed; finally, Histogram Intersection Kernel should be built based on these his-tograms. In our experimental study, we use Corel-low images to test our method. Compared with typical RBF kernel SVM, the Histogram Intersection kernel SVM performs better than RBF kernel SVM.
Keywords
Classification, Bag of Word, Support Vector Machine, Kernel Function, Visual Keywords
1. Introduction
With the rapid increase of digital images, it is impossible to label them manually. How to classify these images quickly and accurately becomes an important research topic currently.
Support vector machine (SVM) is a kernel based supervised learning classifier, based on Statistical Learning Theory (SLT), which is a widely used method in classification problems, e.g., natural language processing [1], information retrieval [2] [3] and data mining [4] [5]. However, how to choose a right kernel is a challenge work in the SVM. Wu proposed an interpolation kernel, which has less subjectivity and more predominance of gene-ralization than most of traditional kernel functions while needing vast calculation [6]. Neumann use wavelet kernel SVM as a classifier which solves difficult signal classification problems in cases where solely using a large margin classifier may fail [7]. Radial Basis kernel Function was proved its effective learning performance, while its extrapolation capability decreases with the parameters’ increasing. Polynomial kernel function has a good performance in global, while its performance is poor in local. Different kernels result in different results; therefore, it’s essential to choose a right kernel for specific classification task.
(BOW) model, we use k-means clustering algorithm to cluster those descriptors into k groups, each of them was regarded as a visual keywords which making up the dictionary, and we can get the histogram of each images, that gives the frequency of each visual keywords contained in the dictionary. Finally, Histogram Intersection Kernel should be constructed with these histograms.
2. Image Preprocessing and Feature Extraction
2.1. Image PreprocessingWe use the Corel-low image to test our method, and the original images were split into blocks which have equal size of B × B with the regular grid. Figure 1 shows the schematic diagram of how to split the original images.
2.2. Extracting Feature
Scale Invariant Feature Transform (SIFT) was first proposed by David G.L. in 1999 [8], and was improved in 2004 [9]. SIFT descriptor is an invariant image local feature description operator of invariant image that is based on scale space, image rotation and even affine transformation. The core issue of object recognition is that to match a target to its images no matter if they are at different times, different light, and different poses. However, since the state of target and the impact of the environment, the image in the same type differs from each other greatly in different scenes, and therefore people can identify the same object by the local common character. The so-called local feature descriptor is used to describe the local feature of the image. The ideal local feature should be robust to translation, scaling, rotation, the lighting changes, affine and projector impact. SIFT descriptor is a typical local feature.
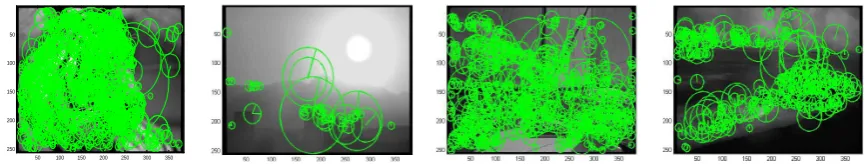
Then we extract SIFT descriptor from each block after preprocessing of the original images, Figure 2 shows the diagram of the extraction of SIFT descriptor, and the green marks are the SIFT descriptor. A SIFT descriptor is denoted by a circle, representing its support region, and one of its radii, representing its orientation.
2.3. Bag-of-Words Model
Bag-of-Words (BOW) model was used to express a document (or sentence) as a histogram of frequency of words, ignoring the order of these words in natural language processing firstly [10]. It was used to perform the classification of computer images by Li [11].This model can learn characteristic labels of scenes without human intervention in the training database. But its performance for the images of indoor scenes is lackluster [11].
[image:2.595.199.428.516.595.2]Since SIFT descriptors were extracted, the local feature of each image was obtained. Then these descriptors were clustered into k groups via k-means clustering algorithm. The k groups are regarded as visual keywords making up the dictionary. In order to let the images represented by the visual keywords of the dictionary, every descriptor of each image is replaced by a nearest visual keyword in Euclidean distance. All the descriptors of the
Figure 1. Each image was partitioned into blocks with regular grid.
Figure 2. Example of extracting SIFT descriptor.
50 100 150 200 250 300 350 50
[image:2.595.96.530.622.704.2]images can be represented as the visual keywords. After that, the images were expressed with a histogram of the frequencies of the visual keywords. Assume that each image is expressed by a histogram hi∈R+d
(
i=1, 2,...,l)
, where l is the number of all the images.3. Support Vector Machine
Support Vector Machines (SVM) was proposed by Vapnik [12] [13], which is commonly used in classification, regression, and other learning tasks [14]. SVM is built on the theory of max-margin classification hyper-plane.
Given
(
x yi, i)
(
i=1, 2,...,l)
, where xi is training data and yi is the corresponding label. Maximizing the margin is to solve the optimization problem:(
)
2
1
1 min
2
. . 1 , ( 1, , )
0
l i w
i
i i i
i
w C
s t y w x b i N
ξ
ξ ξ
= +
⋅ + ≥ − =
≥
∑
(1)
where C is the penalty factor, ξ is the slack factor [15]. The dual problem of the Equation (1) is defined as follow.
1 1 1
1
1
min ( , )
2
. 0
0 ( 1, , )
l l l
i j i j i j i
i j i
l
i i i
i
y y K x x
s t y
C i l
α α α α
α
α
= = =
=
−
=
≤ ≤ =
∑∑
∑
∑
(2)
where α* is the Lagrange multiplier. By solving the Equation (2), α* should be obtained, and we have:
1
l i i i i
w α y x
=
=
∑
(3)Then we get the decision function:
1
( , ) l
j i i i j
i
y α y K x x b
=
=
∑
+ (4)where b is a bias value.
However, in the practical applications, the problems are nonlinear separable. The solution to this problem is to induce a kernel function into the optimization problem, which maps the data into a higher dimensional space. To avoid complicated calculation in the higher dimension, the kernel function that satisfies Mercer’s theorem has calculated the data in the original dimension beforehand. Given x xi, j∈R+d
(
i j, =1, 2,...,l)
, the kernel function is defined as: K x x(
i, j)
= φ( )
xi ⋅φ( )
xj , and φ( )
xi is a mapping [16].Here are some typical kernel functions [17]:
Linear kernel:
(
,)
Ti j i j
K x x =x x
Polynomial kernel: K x x
(
i, j)
=(
γx xiT j+r)
d,γ >0 Radial Basis Function (RBF) kernel: K x x
(
i, j)
=exp(
−γ xi−xj 2)
,γ >0 Here γ,r and d are kernel parameters.4. Histogram Intersection Kernel Construction
the images. The histogram intersection kernel is defined as:
( )
(
)
1
, = min ,
d
HIS m m
m
K x z x z
=
∑
(5)This function is a positive definite kernel, so it can be used to quantify the similarity of two images, which also satisfies the Mercer’s theorem.
Histogram intersection kernel function, which contains the spatial location of objects, is robust to many transformations. Such as, distractions in the background of the object, view point changing, occlusion [18].
5. Experiment and Analysis
Our PC configuration is: windows 8.1 system, Intel Core i7 2.3 GHz, with 6 GB memory and the programming software is Matlab 2012a. We use the Corel-low images as our experimental data, which contains 59 classes and each class has 100 pictures. The number of classes has an influence on the result of classification. In order to make sure that whither the classification result of Histogram Intersection kernel SVM is robust to different numbers of classes Thus, two groups of experiment were designed. The first group contains 12 classes selected from the 59 classes randomly, and 70 pictures of each class are used for training and the rest for testing ran-domly too, we name it the group one. The second is to use all the 59 classes and take 80 pictures of each class for training and the rest for testing, we name it the group two.
The size of the regular grids is given 16 × 16, split the original images into blocks. Then SIFT descriptors were extracted from every block. The size of dictionary has a great influence on the classification accuracy. At the same time the larger size cost more in the calculation. So we get the dictionary size by seeking a tradeoff between the classification accuracy and the calculation cost. Finally the size of the dictionary is 1000 for the group one and 3000 for the group two. Note that RBF kernel is a typical kernel for SVM [14], so RBF kernel function is taken as ground-truth to compare with histogram intersection kernel SVM. RBF kernel function has one kernel parameter γ. In C-Support Vector Machine (C-SVM), there is a penalty parameter C which is the cost of C-SVM. We find the parameter by grid searching method.
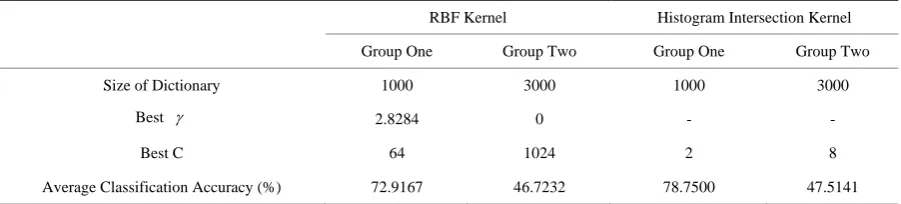
Table 1 shows the size of dictionary, best parameters of SVM and average classification accuracy of the two kernels for both groups of experiments. The average classification accuracy of RBF kernel is about 5.8% lower than Histogram Intersection kernel in group one and 0.8% lower than Histogram Intersection kernel in group two. The RBF kernel costs more in the calculation and needs lots of time to find the best parameters since it re-quests two parameters.
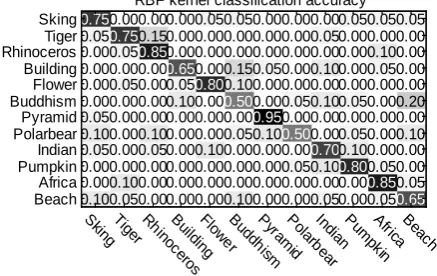
And Figure 3 is the confusion matrix of these two kernels for Group One. From the confusion matrix, we can see that except class Flower and Africa, the accuracy of Histogram Intersection kernel is higher than the RBF kernel.
Figure 4 is the confusion matrix of these two kernels for Group Two. There are 37 classes whose prediction accuracy of Histogram Intersection kernel is higher than or equal to the RBF kernel in the 59 classes.
[image:4.595.91.310.564.702.2]Comparing histogram intersection kernel with RBF kernel, we made a conclusion that histogram intersection kernel has higher accuracy and requests less computation time than RBF kernel for image classification.
Figure 3. Confusion matrix of group one. 0.75 0.05 0.00 0.00 0.00 0.00 0.05 0.10 0.05 0.00 0.00 0.10 0.00 0.75 0.05 0.00 0.05 0.00 0.00 0.00 0.00 0.00 0.10 0.05 0.00 0.15 0.85 0.00 0.00 0.00 0.00 0.10 0.05 0.00 0.00 0.00 0.00 0.00 0.00 0.65 0.05 0.10 0.00 0.00 0.00 0.00 0.00 0.00 0.05 0.00 0.00 0.00 0.80 0.00 0.00 0.00 0.10 0.00 0.00 0.00 0.05 0.00 0.00 0.15 0.10 0.50 0.00 0.05 0.00 0.00 0.00 0.10 0.00 0.00 0.00 0.05 0.00 0.00 0.95 0.10 0.00 0.00 0.00 0.00 0.00 0.00 0.00 0.00 0.00 0.05 0.00 0.50 0.00 0.05 0.00 0.00 0.00 0.05 0.00 0.10 0.00 0.10 0.00 0.00 0.70 0.10 0.00 0.05 0.05 0.00 0.00 0.00 0.00 0.05 0.00 0.05 0.10 0.80 0.00 0.00 0.05 0.00 0.10 0.05 0.00 0.00 0.00 0.00 0.00 0.05 0.85 0.05 0.05 0.00 0.00 0.00 0.00 0.20 0.00 0.10 0.00 0.00 0.05 0.65 S
kingTiger Rhinoc er
os Bui
ldingFlowe r Buddh ism P yram id Pol ar bear Indi an Pum pk in A
fricaBeac h Sking Tiger Rhinoceros Building Flower Buddhism Pyramid Polarbear Indian Pumpkin Africa Beach
RBF kernel classification accuracy
0.80 0.00 0.00 0.05 0.00 0.00 0.00 0.10 0.00 0.00 0.00 0.00 0.00 0.80 0.05 0.00 0.05 0.00 0.00 0.00 0.00 0.00 0.10 0.00 0.00 0.15 0.90 0.00 0.00 0.00 0.00 0.05 0.00 0.00 0.05 0.00 0.00 0.00 0.00 0.70 0.05 0.05 0.00 0.00 0.00 0.00 0.00 0.05 0.05 0.00 0.00 0.00 0.75 0.00 0.00 0.00 0.00 0.00 0.00 0.00 0.05 0.00 0.00 0.15 0.10 0.65 0.00 0.00 0.00 0.00 0.00 0.10 0.00 0.00 0.00 0.10 0.00 0.00 0.95 0.10 0.00 0.00 0.00 0.00 0.00 0.00 0.00 0.00 0.00 0.05 0.00 0.65 0.05 0.05 0.00 0.00 0.00 0.05 0.00 0.00 0.05 0.05 0.00 0.05 0.95 0.05 0.15 0.05 0.00 0.00 0.00 0.00 0.00 0.00 0.00 0.00 0.00 0.85 0.00 0.00 0.05 0.00 0.05 0.00 0.00 0.00 0.00 0.00 0.00 0.05 0.65 0.00 0.05 0.00 0.00 0.00 0.00 0.20 0.05 0.05 0.00 0.00 0.05 0.80 S
kingTiger Rhinoc er os Bui ldi ng Flowe r Buddh ism P yram id Pol ar bear Indi an Pum pk in A
fricaBeac h Sking Tiger Rhinoceros Building Flower Buddhism Pyramid Polarbear Indian Pumpkin Africa Beach
Figure 4. Confusion matrix of group two.
Table 1. The parameters and average classification of the two groups.
RBF Kernel Histogram Intersection Kernel
Group One Group Two Group One Group Two
Size of Dictionary 1000 3000 1000 3000
Best γ 2.8284 0 - -
Best C 64 1024 2 8
Average Classification Accuracy (%) 72.9167 46.7232 78.7500 47.5141
6. Conclusions
Image classification is an important research field in pattern recognition; SVM is a good classifier for non-linear classification problem. And the kernel function selection is the core for the classification. To find a right kernel is important to the classification problem. The experimental results show that, the performance of the Histogram Intersection Kernel is better than RBF kernel SVM. In our future work, there are several problems we should consider. 1) The size of dictionary influences on both the classification accuracy and the computation time greatly, therefore a new method that is used to represent an image, needs to be proposed. 2) A kernel whose ef-fect is robust to the increase of the number of classes has to be proposed in the future.
Acknowledgements
This work was jointly supported by the Natural Science Fund Project of Education Department of Shaanxi Pro-vincial Government (Grant No. 14JK1658), the Natural Science Foundation of China (Grant No. 61302050), and the College students innovation and entrepreneurship training program of Xi’an University of Posts and Telecommunications.
References
[1] Kudo, T.K. and Matsumoto, Y.J. (2001) Chunking with Support Vector Machines. Proceedings of the Second Meeting of the North American Chapter of the Association for Computational Linguistics on Language Technologies, 816.
http://dx.doi.org/10.3115/1073336.1073361
[2] Zhang, D. and Lee, W.S. (2003) Question Classification Using Support Vector Machines. SIGIR, 3, 26-32.
http://dx.doi.org/10.1145/860435.860443
[3] Yang, C.H., Lin, K.H.Y. and Chen, H.H. (2007) Emotion Classification Using Web Blog Corpora. IEEE/WIC/ACM International Conference on Web Intelligence, 275-278. http://dx.doi.org/10.1109/WI.2007.51
[4] Yoshikawa, Y.Y., Iwata, T.H. and Sawada, H.S. (2014) Latent Support Measure Machines for Bag-of-Words Data Classification. Advances in Neural Information Processing Systems, 27.
[5] Kolari, P., Finin, F. and Joshi, A. (2006) SVMs for the Blogosphere: Blog Identification and Splog Detection. AAAI Spring Symposium on Computational Approaches to Analysing Weblogs, University of Maryland, Baltimore County. 1 5 9 13 17 21 25 29 33 37 41 45 49 53 57
1 5 9 13 17 21 25 29 33 37 41 45 49 53 57
0.2 0.4 0.6 0.8 RBF kernel classification accuracy
1 5 9 13 17 21 25 29 33 37 41 45 49 53 57
1 5 9 13 17 21 25 29 33 37 41 45 49 53 57
[image:5.595.89.540.262.364.2][6] Wu, T., He, H.G. and He, M.K. (2003) Interpolation Based Kernel Function’s Construction. Chinese Journal of Com-puters, 26, 990-996.
[7] Neumann, J., Schnörr, C. and Steidl, G. (2005) Efficient Wavelet Adaptation for Hybrid Wavelet-Large Marge Clas-sifiers. Pattern Recognition, 38, 1815-1830. http://dx.doi.org/10.1016/j.patcog.2005.01.024
[8] Lowe, D.G. (1999) Object Recognition from Local Scale-Invariant Features. IEEE International Conference on Com-puter Vision. http://dx.doi.org/10.1109/iccv.1999.790410
[9] Lowe, D.G. (2004) Distinctive Image Features from Scale Invariant Keypoints. International Journal of Computer Vi-sion, 60, 91-110. http://dx.doi.org/10.1023/B:VISI.0000029664.99615.94
[10] Jiu, M.Y., Wolf, C., Garcia, C. and Baskurt, A. (2012) Supervised Learning and Codebook Optimization for Bag-of- Words Models. Cognitive Computation, 4, 409-419. http://dx.doi.org/10.1007/s12559-012-9137-4
[11] Li, F.F. and Pietro, P. (2005) A Bayesian Hierarchical Model for Learning Natural Scene Categories. Computer Vision and Pattern Recognition, 2, 524-531.
[12] Cortes, C. and Vapnik, V. (1995) Support-Vector Networks. Machine Learning, 20, 273-397.
http://dx.doi.org/10.1007/BF00994018
[13] Vapnik, V. (2000) The Nature of Statistical Learning Theory. 2nd Edition, Springer-Verlag, New York.
http://dx.doi.org/10.1007/978-1-4757-3264-1
[14] Chang, C.C. and Lin, C.J. (2011) LIBSVM: A Library for Support Vector Machines. ACM Transactions on Intelligent Systems and Technology, 2, 27. http://dx.doi.org/10.1145/1961189.1961199
[15] Chang, T.T., Horace, H.S.Ip. and Feng, J. (2010) Large Scale Image Clustering with Support Vector Machine Based on Visual Keywords. MDMKDD 2010. http://dx.doi.org/10.1145/1814245.1814250
[16] Keerthi, S.S. and Lin, C.J. (2003) Asymptotic Behaviors of Support Vector Machines with Gaussian Kernel. Neural Computation, 15, 1667-1689. http://dx.doi.org/10.1162/089976603321891855
[17] Aneja, K., Saroj and Jyoti (2013) A Genetic Algorithm Approach to Kernel Functions Parameters Selection for SVM. International Journal of Current Engineering and Technology, 2, 713-716.