R E S E A R C H
Open Access
Protein recoding by ADAR1-mediated RNA
editing is not essential for normal
development and homeostasis
Jacki E. Heraud-Farlow
1,2, Alistair M. Chalk
1,2, Sandra E. Linder
3, Qin Li
3, Scott Taylor
1, Joshua M. White
1,2,
Lokman Pang
1, Brian J. Liddicoat
1,2, Ankita Gupte
1, Jin Billy Li
3and Carl R. Walkley
1,2*Abstract
Background:Adenosine-to-inosine (A-to-I) editing of dsRNA by ADAR proteins is a pervasive epitranscriptome feature. Tens of thousands of A-to-I editing events are defined in the mouse, yet the functional impact of most is unknown. Editing causing protein recoding is the essential function of ADAR2, but an essential role for recoding by ADAR1 has not been demonstrated. ADAR1 has been proposed to have editing-dependent and editing-independent functions. The relative contribution of these in vivo has not been clearly defined. A critical function of ADAR1 is editing of endogenous RNA to prevent activation of the dsRNA sensor MDA5 (Ifih1). Outside of this, how ADAR1 editing contributes to normal development and homeostasis is uncertain.
Results:We describe the consequences of ADAR1 editing deficiency on murine homeostasis.Adar1E861A/E861AIfih1 -/-mice are strikingly normal, including their lifespan. There is a mild, non-pathogenic innate immune activation
signature in theAdar1E861A/E861AIfih1-/-mice. Assessing A-to-I editing across adult tissues demonstrates that outside
of the brain, ADAR1 performs the majority of editing and that ADAR2 cannot compensate in its absence. Direct
comparison of theAdar1-/-andAdar1E861A/E861Aalleles demonstrates a high degree of concordance on bothIfih1+/+
andIfih1-/-backgrounds, suggesting no substantial contribution from ADAR1 editing-independent functions.
Conclusions:These analyses demonstrate that the lifetime absence of ADAR1-editing is well tolerated in the absence of MDA5. We conclude that protein recoding arising from ADAR1-mediated editing is not essential for organismal homeostasis. Additionally, the phenotypes associated with loss of ADAR1 are the result of RNA editing and MDA5-dependent functions.
Keywords:ADAR1, RNA editing, MDA5, Development, dsRNA, Innate immunity, Epitranscriptome
Background
It is now established that direct RNA modifications, collectively referred to as the epitranscriptome, are wide-spread, evolutionarily conserved, and contribute signifi-cantly to the complexity of gene regulation [1, 2]. A highly prevalent modification is the deamination of adenosine to inosine (A-to-I editing) in double-stranded RNA (dsRNA). A-to-I editing is catalyzed by adenosine deaminase acting on RNA (ADAR) proteins. It is
estimated that there are over 100 million potential A-to-I editing sites in humans and tens of thousands in mice [3, 4], with the majority residing within repetitive se-quences, such as short interspersed nuclear elements (SINEs), Alus (primates only), and long tandem repeats (LTRs) [5]. Depending on the sequence context—coding sequence, intronic region, untranslated regions, non-coding RNAs—editing can have varying consequences for gene expression [6]. Outside of a small number of examples, the cellular and organismal consequences of A-to-I editing are relatively poorly understood.
Mammals have three ADARs: ADAR (ADAR1),
ADARB1 (ADAR2), and ADARB2 (ADAR3); although
only ADAR1 and ADAR2 have editing activity in vitro. * Correspondence:[email protected]
1
St. Vincent’s Institute of Medical Research, 9 Princes St, Fitzroy 3065, VIC, Australia
2Department of Medicine, St. Vincent’s Hospital, University of Melbourne,
Fitzroy, VIC 3065, Australia
Full list of author information is available at the end of the article
Physiologically, ADAR2 is essential for the specific edit-ing of a sedit-ingle adenosine in the codedit-ing sequence of the glutamate receptor 2 subunit (Gria2) transcript, termed the Q/R site, encoding a neurotransmitter receptor in the brain [7–9]. Inosine is interpreted as guanine by the ribosome so editing of theGria2mRNA recodes a geno-mically encoded glutamine (Q) to arginine (R), varying the permeability of the pore. Adarb1-/- (Adar2-/-) mice cannot edit the Q/R site adenosine, leading to seizures and early lethality. Despite thousands of other editing events identified in both coding and non-coding regions, genomic substitution of the single A to G at the Q/R site rescued theAdar2-/-phenotype [7, 10]. This result defined the paradigm that RNA editing is a means to post-transcriptionally modify coding sequences and
“re-code” DNA sequences. Unlike ADAR2, the role of
ADAR1 has proven more complex.
ADAR1 is expressed throughout the body, unlike ADAR2 which is highest in the brain [11]. There are two isoforms of ADAR1: a constitutively expressed ADAR1 p110, which is primarily nuclear-restricted, and a longer interferon (IFN) inducible ADAR1 p150, which localizes to both nucleus and cytoplasm [12]. Adar-/- (Adar1-/-)
mice died at embryonic day 11.5–12.0 (E11.5–12.0) with a profound upregulation of type I IFN and IFN-stimulated genes (ISGs) [13–15]. Likewise, adult somatic deletion of Adar1 resulted in innate immune activation and cell death [14, 16–19]. Mice homozygous for a sin-gle amino acid substitution resulting in an editing-deficient ADAR1 protein (Adar1E861A/E861A) die at E13.5, with remarkably similar phenotypes to the null allele [19]. Activation of the innate immune sensing system, termed an interferonopathy, is observed in the subset of Aicardi-Goutières syndrome (AGS) patients who harbor mutations in ADAR, demonstrating that the transcriptional response to loss of ADAR1 activity is conserved across mammals [17, 20–22].
In mice and humans, most editing occurs in repetitive sequences capable of base-pairing to form intramolecular dsRNA structures [23–25]. Using murine genetics, we and others demonstrated that editing of endogenous RNA is a critical function of ADAR1, acting to prevent sensing of endogenous (self ) dsRNA as foreign [17, 19, 26, 27]. A central function of the innate immune system is the recognition of foreign (non-self ) dsRNA by pattern recognition receptors (PRRs) in the cytoplasm. Upon de-tecting long dsRNA, the PRR melanoma differentiation-associated gene 5 (MDA5, gene nameIfih1) oligomerizes to form a filament leading to activation of mitochondrial antiviral signaling (MAVS), resulting in the production of type I IFN and the propagation of downstream de-fence signals [28, 29]. Concurrent deletion of MDA5 or MAVS with ADAR1 extended the survival of Adar1
-/-animals until shortly after birth [17, 26]. Viability of the
ADAR1 editing-deficient mice was also rescued by dele-tion of MDA5. These findings suggested that RNA editing is the key function of ADAR1 during early development to prevent activation of MDA5 by endogenous dsRNA.
Editing-dependent and editing-independent functions of ADAR1 have been proposed, including involvement in multiple aspects of microRNA (miRNA) biogenesis [30–35], messenger RNA (mRNA) stability [36, 37], alter-nate 3’-UTR usage [33], splicing [38, 39] and translation [40]. Analysis of the Adar1-/-Mavs-/- and Adar1p150 -/-Mavs-/- rescued mice identified phenotypes associated with the loss of ADAR1 that were considered independent of MAVS/MDA5, including developmental defects in the kidney, small intestine, lymph node, and a failure of B lymphopoiesis [17]. It is unclear if these phenotypes reflect editing-dependent or editing-independent func-tions of ADAR1.
Due to embryonic lethality of the Adar1-/- and
Adar1E861A/E861A mice, establishing the in vivo
rele-vance of ADAR1’s functions to adult homeostasis had not been possible. In contrast to the Adar1-/-Ifih1-/- or
Adar1-/-Mavs-/- that die within days of birth, the
Adar1E861A/E861AIfih1-/- survived until at least four weeks of age [19]. We have assessed the requirement for ADAR1 activity during adult murine homeostasis using these rescued ADAR1 editing-deficient animals. We directly compared the Adar1-/- and Adar1E861A al-leles, on both a Ifih1+/+andIfih1-/-background, on the day of birth and in an acute adult somatic mutation model to evaluate editing-independent functions of ADAR1. We conclude that the core function of ADAR1-mediated editing is to prevent the formation of MDA5 substrates and that other effects of ADAR1-mediated editing, such as protein recoding and on miRNA biology, are not essential for murine homeostasis in vivo.
Results
Adar1E861A/E861AIfih1-/-animals have a normal lifespan and low weaning weight
TheAdar1E861A/E861AIfih1-/-are viable [19]. The most ap-parent phenotype of the Adar1E861A/E861AIfih1-/- animals was reduced weaning weight, withAdar1E861A/E861AIfih1
-/-animals ~ 30% lighter than the controls (day 20–21 post birth; Fig. 1a). By 12 weeks, theAdar1E861A/E861AIfih1
-/-females had a normal body weight compared to both wild-type (WT) C57BL/6 and Adar1+/+Ifih1-/- animals (Fig. 1b, Additional files 1 and 2: Video S1, S2). Males remained lighter at 12 weeks, although the difference was less than at weaning, being ~ 9% and ~ 17% lighter than C57BL/6 or Adar1+/+Ifih1-/-, respectively (Fig. 1c, Additional files 1 and 2: Video S1, S2). Adar1E861A/+
Ifih1-/- animals had normal body weight. There was
no significant difference in the long-term survival of
Adar1E861A/+Ifih1-/- animals, surviving to > 80 weeks of age (Fig. 1c). The oldestAdar1E861A/E861AIfih1-/-animals have survived to > 115 weeks of age (>805 days). The median life expectancy of C57BL/6 mice is in the range of 676–878 days [41, 42]. Both male and female
Adar1E861A/E861AIfih1-/-animals are fertile, which for the males, at least, this is consistent with the primary role reported for ADAR2 in editing in the testis [43].
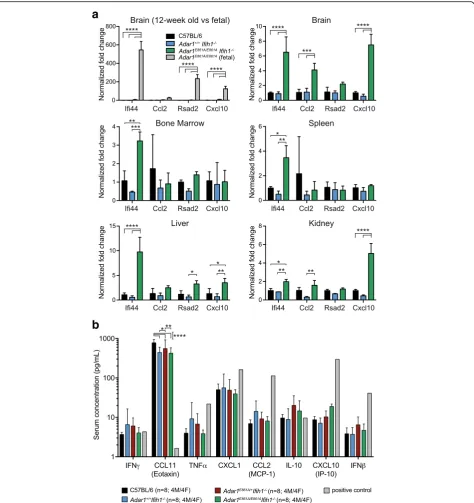
Mild innate immune activation in the absence of MDA5 To determine if there was activation of innate immune sensing in the Adar1E861A/E861AIfih1-/- animals, as seen in the Adar1-/- [14] and the Adar1E861A/E861A [19], the expression of four ISGs was assessed across a range of tissues (Fig. 2a). The expression of these ISGs increased dramatically upon deletion/mutation of ADAR1 in both human and mouse [17, 21]. There was either no change or a subtle increase in ISGs in the tissues assessed (up to tenfold over C57BL/6 s). In whole brain, three of four ISGs were significantly increased. By comparison, in E12.5
Adar1E861A/E861Avs.Adar1+/+fetal brain, these same ISGs were upregulated between ~ 125 and ~ 550-fold (Fig. 2a). Therefore, MDA5 is the primary conduit of innate im-mune signal activation in ADAR1 editing-deficient mice. However, a well-tolerated and, apparently non-pathogenic, low-level, innate immune activation occurs in the absence of MDA5 via currently unknown mechanisms.
The protein levels of eight cytokines/chemokines in peripheral blood (PB) serum that increased upon som-atic deletion of Adar1were assessed [17]. There was no increase in any of the proteins assessed including IFNβ, IFNγ, CCL2, and CXCL10 (Fig. 2b). The only difference was an Ifih1-/-genotype-dependent reduction in the ex-pression of CCL11 (Fig. 2b). As a positive control, the expression of these proteins was assessed in supernatant from cultures of immortalized hematopoietic cells [44], generated fromR26-CreERT2Adar1E861A/flbone marrow
(BM) cells, treated with tamoxifen in vitro (Fig. 2b). Despite the increased ISG mRNAs there is no resultant increase in circulating protein levels.
Normal hematopoiesis in the absence of ADAR1-mediated A-to-I editing
Hematopoietic cells have a profound dependence on
ADAR1 [13, 14, 16, 18, 19, 45]. We assessed
hematopoiesis in 12-week-old Adar1E861A/E861AIfih1
-/-animals and three control populations: age-/sex-matched C57BL/6 animals bred and housed in the same facility;
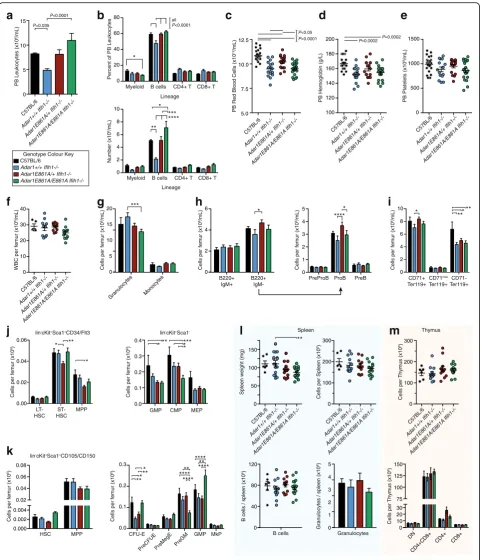
Adar1+/+Ifih1-/- animals; andAdar1E861A/+Ifih1-/- animals. PB indices in Adar1E861A/E861AIfih1-/-animals were com-parable to C57BL/6 mice (Fig. 3a). For reasons presently unknown, the total PB leukocyte counts were lower in the
Adar1+/+Ifih1-/- cohort compared to the other genotypes (Fig. 3a, b). There were several statistically significant differences between theAdar1E861A/E861AIfih1-/-animals and C57BL/6 animals including a reduction in the per-centage, but not numbers, of granulocytes and an in-crease in the number, but not percentage, of B cells in the PB (Fig. 3b). All Ifih1-/- animals, irrespective of
Adar1 status, presented with a mild anemia compared
to the C57BL/6 cohorts (Fig. 3c, d). Platelet numbers were normal in all genotypes (Fig. 3e).
Within the BM, relatively mild and subtle changes were apparent that reflected the PB. Total BM cellularity and myeloid development was essentially normal be-tween genotypes (Fig. 3f, g). Analysis of B-cell differenti-ation demonstrated that the lower B-cell numbers in the
Adar1+/+Ifih1-/- stemmed from a reduction of cells at the ProB cell stage (Fig. 3h). Consistent with theIfih1-/- -dependent anemia, there were reduced numbers of ma-ture CD71-Ter119+ erythroid cells in the BM of animals with this genotype (Fig. 3i). In the stem and primitive progenitor populations, there were relatively subtle dif-ferences among the groups, but in all cases the numbers
c
0 10 20 30 40 50 60 70 80
0 50 100
Weeks of Age
Survival (Proportion)
Adar1E861A/+Ifih1-/- (n=103)
Adar1E861A/E861AIfih1-/- (n=97) P=0.7977
90
103 79 52 25 19 12 6 2
97 70 44 23 15 9 5 5 2
No. at risk (weeks of age ≥)
W
eight (grams; 12 wks old)
W
eight (grams; 12 wks old)
0 5 10 15 20 25 30 35
0 5 10 15 20 25 30 35
Adar1 Ifih1
+/+
+/+ +/+
-/-PM/+
-/-PM/ PM
-/-n 12 9 9 10 +/+
+/+ +/+
-/-PM/+
-/-PM/ PM
-/-12 6 8 9
Male Female
Genotype
** **** ** **
b
0 4 8 12 16
W
eaning weight (grams; Day 20-21)
Adar1 Ifih1
+/+
+/+ +/+
+/-PM/+
+/+ PM/+
+/-+/+
-/-PM/+
-/-PM/PM
-/-n 6 1 14 21 32 173 95 *** ****
** ****
****
a
Genotype
[image:3.595.57.540.89.239.2]of each population were largely normal (Fig. 3j, k). Hematopoiesis in the spleen (Fig. 3l) and thymus (Fig. 3m) was normal compared to controls. ADAR1-mediated editing in not required for homeostatic hematopoiesis once MDA5 is inactivated.
Normal tissue development in the absence of ADAR1-mediated A-to-I editing
Tissues from 12-week-old Adar1E861A/E861AIfih1-/- and age-/sex-matched Adar1E861A/+Ifih1-/- littermates were subjected to a genotype blinded histological assessment by
a
b
Fig. 2Modest activation of ISG expression inAdar1E861A/E861AIfih1-/-tissues.aQuantitative reverse transcription polymerase chain reaction (qRT-PCR) of four ISGs from tissues of 12-week-old mice, with the exception of the first panel comparing 12-week-old brain with E12.5 fetal
brain fromAdar1E861A/E861AIfih1+/+embryos. Data represent mean ± SEM (n = 3/genotype); all samples normalized to C57BL/6.bPB serum cytokine
levels from indicated genotypes. Positive control = supernatant from tamoxifen treatedR26-CreERT2Adar1E861A/flhematopoietic cell line. Results
[image:4.595.63.538.87.591.2]0.00 0.02 0.04 0.06 0.0 0.1 0.2 0.3 0.4 0.000 0.002 0.004 0.02 0.04 0.06 0.08 0.0 0.1 0.2 0.3 0 5 10 15
PB Leukocytes (x10
6/mL) C57BL/6 Adar1+/+ Adar1E861A/+ Ifih1-/-Adar1E861A/E861A Ifih1-/-C57BL/6 Adar1+/+ Adar1E861A/+ Adar1E861A/E861A
Ifih1-/-Genotype Colour Key
0 20 40 60 80
Percent of PB Leukocytes
Myeloid B cells CD4+ T CD8+ T
Lineage 0 2 4 6 8 10 Number (x10 6/mL)
Myeloid B cells CD4+ T CD8+ T
Lineage
5.0 7.5 10.0 12.5
PB Red Blood Cells (x10
12 /mL) 0 500 1000 1500
PB Platelets (x10
9/mL) 100 120 140 160 180 200
PB Hemoglobin (g/L)
C57BL/6
Adar1+/+
Adar1E861A/+
Ifih1-/-Adar1E861A/E861
A Ifih1-/- C57BL/6
Adar1+/+ Adar1E861A/+ Ifih1-/-Adar1E861A/E861A Ifih1-/-C57BL/6 Adar1+/+ Adar1E861A/+ Ifih1-/-Adar1E861A/E861 A
Ifih1-/-WBC per femur (x10
6/mL) 0 10 20 30 40 C57BL/6 Adar1+/+ Adar1E861A/+ Ifih1-/-Adar1E861A/E861A Ifih1-/-0 2 4 6 B220+ IgM+ B220+
IgM-Cells per femur (x10
6/mL) 0 1 2 3 4 5
PreProB ProB PreB
Cells per femur (x10
6/mL) 0 2 4 6 8 10
Cells per femur (x10
6/mL) CD71+ Ter119+ CD71mid Ter119+ CD71-Ter119+ 0 5 10 15 20
Cells per femur (x10
6/mL)
Granulo cytes
Monocyte s
Cells per femur (x10
6) LT-HSC ST-HSC MPP
lin-cKit+Sca1+CD34/Flt3
Cells per femur (x10
6)
GMP CMP MEP
lin-cKit+Sca1
-Cells per femur (x10
6)
PreGM
GMP MkP
PreMegE
CFU-E
Cells per femur (x10
6)
HSC MPP
lin-cKit+Sca1+CD105/CD150
0 50 100 150
Spleen weight (mg)
0 100 200 300
Cells per Spleen (x10
6)
0 40 80 120
B cells / spleen (x10
6) 0 1 2 3 4 5
Granulocytes / spleen (x10
6) 0 100 200 300 Cells per Thymus (x10 6) 0 10 20 30 75 100 125 150 DN CD4 +CD 8+ CD4+ CD8 + Cells per Thymus (x10 6) C57BL/6 Adar1+/+ Adar1E861A/+ Ifih1-/-Adar1E861A/E861
A Ifih1-/- C57BL/6
Adar1+/+ Adar1E861A/+ Ifih1-/-Adar1E861A/E861A Ifih1-/- C57BL/6 Adar1+/+ Adar1E861A/+ Ifih1-/-Adar1E861A/E861 A
Ifih1-/-B cells Granulocytes
Spleen Thymus
P<0.0001
*
a
b
c
d
f
g
h
i
j
k
l
m
** * *** P<0.0001 P<0.05P=0.0002 P=0.0002
* * **** ***** ** *** *** * ** ******** **** ****** **
e
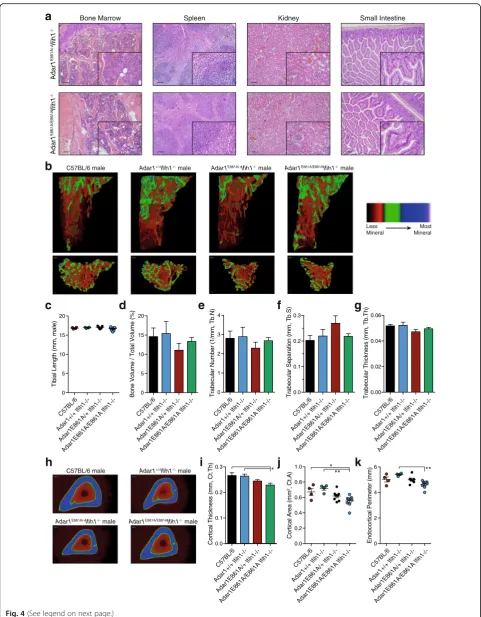
PreCFUE P=0.035 all P<0.0001 **** *** * * * * *** * ** [image:5.595.58.541.86.647.2]an independent core service facility. No significant path-ology or differences were observed across the > 20 tissues and structures assessed between Adar1E861A/E861AIfih1
-/-toAdar1E861A/+Ifih1-/-littermates. The kidney, spleen, and small intestine were normal (Fig. 4a). All other organs assessed, including brain, were histologically normal (see Additional file 3: Dataset S1).
Due to the reduced weaning weight and requirement for ADAR1 in bone/osteoblast homeostasis [46], we
quantitated the bone parameters in 12-week-old
Adar1E861A/E861AIfih1-/-animals compared to controls by microCT [47]. Both male and female mice were assessed; however, due to variability in bone indices with estrus in females, we focused our analysis on the males (female data in Additional file 3: Figure S1). The total tibial length and trabecular bone parameters were normal in theAdar1E861A/E861AIfih1-/-animals (Fig. 4b–g). The only
significant differences were modest changes in the cortical thickness (Fig. 4h, i) and cortical area (Fig. 4j) between
the Adar1E861A/E861AIfih1-/- animals and the C57BL/6
andAdar1+/+Ifih1-/-animals. There was a reduced endo-cortical perimeter when the Adar1E861A/E861AIfih1
-/-were compared to theAdar1+/+Ifih1-/-animals (Fig. 4k), but not to the C57BL/6 s. Therefore, ADAR1-mediated A-to-I editing is dispensable for normal organ and skel-etal development once MDA5 is inactivated.
Transcriptome analysis of whole brain from adult rescued mice
ADAR1loss-of-function mutations in humans are one of
the causes of AGS [17, 20, 21]. AGS is characterized by severe changes in the brain and neurological function, so we sought to understand how a loss of editing by ADAR1 impacted the brain transcriptome. Whole brains of 12-week-old Adar1E861A/E861AIfih1-/- and Adar1+/+Ifih1
-/-male mice were assessed (Fig. 5a, Additional file 4: Dataset S2). Compared to that previously observed in theAdar1-/-andAdar1E861A/E861Afetal tissues where the expression of many hundreds of transcripts is altered [14, 19], there were surprisingly limited changes in the transcriptome of the Adar1E861A/E861AIfih1-/- brain. Twenty-nine genes were significantly different between
the genotypes (log2FC≥1,≥2 counts per million [CPM]
in all three replicates/genotype). Most changes (n = 24) were transcripts upregulated in the absence of editing (Fig. 5b). Pathway analysis confirmed the modest innate immune activation signature, as observed with quantita-tive polymerase chain reaction (qPCR), with GO path-ways relating to IFN response and viral defence the only pathways enriched in the differentially expressed genes (Fig. 5c; Additional file 4: Dataset S2). Quantitative set analysis for gene expression (QuSAGE) was performed to examine the transcriptional signature of ADAR1-editing deficiency, defined in our previous analysis of the
Adar1E861A/E861A fetal liver [19], in the adult brains
(Fig. 5d). To do this, differentially expressed genes in the E12.5 Adar1E861A/E861A fetal liver were used to create a gene set and the expression of the genes in this set were assessed in both the adult brain ofAdar1E861A/E861AIfih1
-/-(vs. Adar1+/+Ifih1-/-) and, as a comparator, the E12.5 fetal brain of Adar1E861A/E861A embryos (vs. Adar1+/+; Fig. 5d, Additional file 4: Dataset S2). The ADAR1-editing deficient signature is enriched in the adult brain even in the absence of MDA5, however, at a greatly re-duced level compared to the MDA5 WTAdar1E861A/E861A
E12.5 fetal brain.
ADAR1 is the primary editing enzyme in peripheral tissue and editing levels are significantly reduced in the Adar1E861A/E861AIfih1-/-tissues
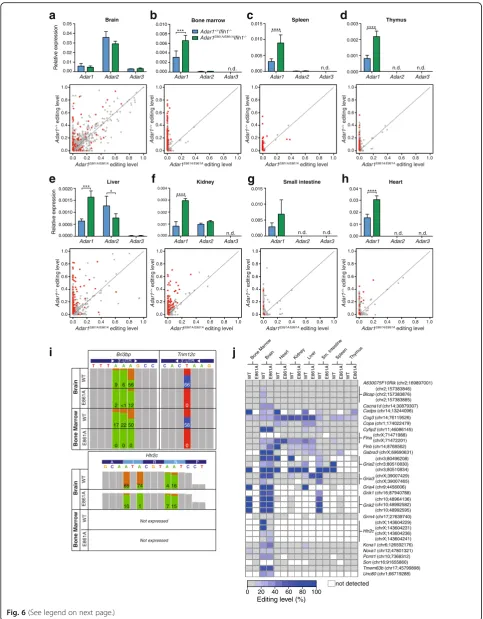
One potential explanation for the normality of the res-cued animals could be redundancy for editing targets with ADAR2. We therefore assessed eight tissues for the expression ofAdar isoforms and editing of known sites: BM, spleen, thymus, liver, brain, kidney, small intestine, and heart.Adar1 transcript could be detected in all tis-sues, whereas Adar2 transcript was expressed only in brain, kidney, and liver with low levels in spleen and BM (Fig. 6a–h, upper panels).Adar3transcript was detected in brain and at low levels in the liver only. Modestly increased overall expression of Adar1 was observed in
Adar1E861A/E861AIfih1-/- relative to Adar1+/+Ifih1-/- in BM, spleen, thymus, liver, kidney, and heart, possibly reflecting the mild ISG activation observed (Fig. 4a). (See figure on previous page.)
Fig. 3Hematopoiesis and B-cell production are normal in the absence of ADAR1 editing. PB, BM, spleen, and thymus analyzed of 12-week-old mice.a–ePB analysis from C57BL/6 (n = 25),Adar1+/+Ifih1-/-(n = 15),Adar1E861A/+Ifih1-/-(n = 17),Adar1E861A/E861AIfih1-/-(n = 19) indicating (a) total
leukocyte counts, (b) % and absolute number of each leukocyte subtype, (c) red blood cell counts, (d) hemoglobin levels, and (e) platelet
numbers.f–jBM analysis of C57BL/6 (n = 5),Adar1+/+Ifih1-/-(n = 10),Adar1E861A/+Ifih1-/-(n = 11),Adar1E861A/E861AIfih1-/-(n = 11) showing (f)
total leukocyte counts per femur, (g) numbers of granulocytes and monocytes, (h) mature (B220 + IgM+) and immature (B220 + IgM-) B-cell
populations and subsets of the immature populations as indicated, (i) erythroid cells; andj–khematopoietic stem and progenitor
popula-tions using two methods. (l) Spleen weight and cellularity, B cells and granulocyte numbers per spleen from C57BL/6 (n = 6),Adar1+/+Ifih1
-/-(n = 12),Adar1E861A/+Ifih1-/-(n = 12),Adar1E861A/E861AIfih1-/-(n = 14). (m) Thymic cellularity and CD4/CD8 composition in C57BL/6 (n = 6),Adar1+/+Ifih1 -/-(n = 12),Adar1E861A/+Ifih1-/-(n = 12),Adar1E861A/E861AIfih1-/-(n = 13). Results are mean ± SEM; data shown are pooled from at least three
independent experiments; significance determined using two-way ANOVA with correction for multiple comparisons; *P< 0.05, **P< 0.01,
a
Bone Marrow Spleen Kidney Small Intestineb
c
d
e
f
g
h
i
j
0 5 10 15 20
C57BL/6
Adar1+/+
Adar1E861A/+ Ifih1-/-Adar1E861A/E861
A
Ifih1-/-Tibial
Length
(mm, male
)
0 1 2 3 4
T
rabe
c
ular
Number
(1/
mm, Tb
.N
)
C57BL/6
Adar1+/+
Adar1E861A/+ Ifih1-/-Adar1E861A/E861
A
Ifih1-/-0.0 0.1 0.2 0.3
Cortical Thickness (mm, Ct.Th)
C57BL/6
Adar1+/+
Adar1E861A/+ Ifih1-/-Adar1E861A/E861
A
Ifih1-/-* 0.0 0.1 0.2 0.3
Trabe
c
ular Separation
(mm, Tb
.S
)
C57BL/6
Adar1+/+
Adar1E861A/+ Ifih1-/-Adar1E861A/E861
A
Ifih1-/-0.0 0.2 0.4 0.6 0.8 1.0
Cortical Area
(m
m
2, Ct.A)
C57BL/6
Adar1+/+
Adar1E861A/+ Ifih1-/-Adar1E861A/E861
A
Ifih1-/-* ** 0
5 10 15 20
C57BL/6
Adar1+/+
Adar1E861A/+ Ifih1-/-Adar1E861A/E861A
Ifih1-/-Bone Volume / To
tal Volume
(%)
0.00 0.02 0.04 0.06
T
rabe
cular Thickne
ss
(mm
, T
b.T
h
)
C57BL/6
Adar1+/+
Adar1E861A/+ Ifih1-/-Adar1E861A/E861
A
Ifih1-/-0 2 4 6
Endocortical Perimeter
(mm)
C57BL/6
Adar1+/+
Adar1E861A/+ Ifih1-/-Adar1E861A/E861
A
Ifih1-/-** Less
Mineral
Most Mineral C57BL/6 male Adar1+/+Ifih1-/- male Adar1E861A/+Ifih1-/- male Adar1E861A/E861AIfih1-/- male
C57BL/6 male Adar1+/+Ifih1-/- male
Adar1E861A/+Ifih1-/- male Adar1E861A/E861AIfih1-/- male
k
Adar1
E861A/+
Ifih1
-/-Adar1
E861A/E861A
Ifih1
[image:7.595.57.539.85.703.2]
(See figure on previous page.)
Fig. 4Normal organ histology in the absence of ADAR1 RNA editing.aHematoxylin and eosin (H&E)-stained sections of the indicated organs of Adar1E861A/E861AIfih1-/-(n = 4; 2 male, 2 female) andAdar1E861A/+Ifih1-/-(n = 4; 2 male, 2 female) control littermates. 10× magnification with 100-μM scale bar; 40× inset for each.b–gMicroCT analysis of tibial bone; C57BL/6 (n = 4),Adar1+/+Ifih1-/-(n = 4),Adar1E861A/+Ifih1-/-(n = 7),Adar1E861A/E861AIfih1
-/-(n = 9).bRepresentative images of reconstructed trabecular region of the secondary spongiosa within the proximal tibia with color-coded quantitative
mineralization from indicated genotypes.cTibial length, (d) Trabecular bone volume, (e) trabecular number, (f) trabecular separation, and (g) trabecular thickness.h–kMicroCT analysis of cortical bone of the same samples used for panels (b–g).hRepresentative images of reconstructed cortical bone with color-coded quantitative mineralization, (i) cortical thickness, (j) cortical bone area, and (k) endocortical perimeter. Results are mean ± SEM; significance tested using ANOVA, *P< 0.05, **P< 0.01
a
b
d
c
Sycp1 4930429F24Rik Gm13456 Gm11868 Trim43b Ifi203 Gm5859 Gm17167 Gm10600 Irf7 Rsad2 Bst2 Gbp4 Ddx60 Trim30a Gbp2 Ifit3 Iigp1 Ifit3b Irgm2
H2Q4
Rtp4 Ifit1 Gm43302 Slfn8 Nlrc5 Gbp3 Oasl2 Usp18
1.5 1 0.5 0 0.5 1 1.5
Adar1 Ifih1+/+ -/- Adar1 Ifih1E861A/E861A
-/-0 0 2 4 6 8 10 12
2
4
6
8
10
12
Density
Density
0 2 4 6 8
Fetal Brain(Adar1E861A/E861AIfih1+/+ / Adar1+/+Ifih1+/+)
Adult Brain(Adar1E861A/E861AIfih1-/- / Adar1+/+Ifih1-/-)
Fold change (Log )
GO biological process Genes in
dataset/ Genes in GO term
Fold Enrichment
P-value
Response to interferon-beta 8/45 > 100 4.33E-13
Innate immune response 11/482 24.26 1.10E-09
Defense response to other organism 10/411 25.86 1.05E-08
Defense response to virus 6/136 46.89 2.05E-05
Response to cytokine 8/501 16.97 8.06E-05
Response to stress 13/2652 5.21 6.01E-04
Response to interferon-alpha 3/19 > 100 6.48E-03
Adar1E861A/E861AIfih1-/-vs Adar1+/+Ifih1
-/-0
0 2 4 6
6
- -4 -2
5 10 15
Fold change (Log )
A
verage expression (Log
2
CPM)
Trim43b Gm11868
4930429F24Rik Gm13456 Sycp1
Ifit3 Ifit3b
Ifit1 Iigp1
Rsad2 Irf7 Usp18 Oasl2
LogFC>1 LogFC<1 FDR>0.05 Down-regulated in
Adar1E861A/E861AIfih1
-/-Up-regulated in
Adar1E861A/E861AIfih1
-/-LogFC=0.29 p=0.00086 FDR=0.0072
LogFC=2.52 p=9.62 x 10⁻⁷
FDR=5.03 x 10⁻⁵
2
2
Z-score
Fig. 5The absence of ADAR1-mediated editing has minimal effect on gene expression in the adult brain. RNA-sequencing (RNA-seq) analysis
of 12-week-old mouse brains (n = 3 biological replicates/genotype).aMA plot for differentially expressed genes. All genes expressed in brain
with CPM≥2 in all replicates/genotype indicated by adot.bHeatmapof differentially expressed genes with a log2FC≥1 in three biological
replicates/genotype.Colorsreflect the z-score.cEnriched pathways by GO term within differentially expressed genes (false discovery rate
[FDR]≤0.05, log2FC≥1, n = 29 genes).dQuSAGE analysis using theAdar1E861A/E861Afetal liver gene signature as the gene set. Each gene is
depicted by a single line within the barcode. Adult brain fromAdar1E861A/E861AIfih1-/-mice and fetal brain fromAdar1E861A/E861Amice (relative to
respective controls; n = 3 biological replicates/genotype) were compared against theAdar1E861A/E861Agene set.Curvesrepresent the standard
deviation between biological replicates for each gene and arecolor-codedby the magnitude of deviation. Theblack curvein each panel represents
[image:8.595.56.540.215.631.2]a
b
c
d
e
f
g
h
i
0.00 0.01 0.02 0.03 0.04 0.05 Relative e xpressionAdar1 Adar2 Adar3
Brain
Adar1 Adar2 Adar3
n.d. n.d. Small intestine 0.000 0.005 0.010 0.015 Relative expression
Adar1 Adar2 Adar3
Liver 0.0000 0.0005 0.0010 0.0015 0.0020 *** * n.d. 0.000 0.005 0.010 0.015
Adar1 Adar2 Adar3
Spleen **** 0.000 0.001 0.002 0.003 0.004 n.d.
Adar1 Adar2 Adar3
Kidney
****
Adar1 Adar2 Adar3
n.d. n.d. Thymus 0.000 0.001 0.002 0.003 ****
Adar1 Adar2 Adar3
n.d. n.d. Heart 0.00 0.01 0.02 0.03 0.04 ****
Adar1 Adar2 Adar3
Bone marrow n.d. 0.000 0.002 0.004 0.006 0.008 0.010
*** Adar1+/+Ifih1
-/-Adar1E861A/E861AIfih1
-/-0.0 0.0 0.2 0.2 0.4 0.4 0.6 0.6 0.8 0.8 1.0 1.0
Adar1E861A/E861A editing level
Adar1 +/+ editing level 0.0 0.0 0.2 0.2 0.4 0.4 0.6 0.6 0.8 0.8 1.0 1.0
Adar1E861A/E861A editing level
Adar1 +/+ editing level 0.0 0.0 0.2 0.2 0.4 0.4 0.6 0.6 0.8 0.8 1.0 1.0
Adar1E861A/E861A editing level
Adar1 +/+ editing level 0.0 0.0 0.2 0.2 0.4 0.4 0.6 0.6 0.8 0.8 1.0 1.0
Adar1E861A/E861A editing level
Adar1 +/+ editing level 0.0 0.0 0.2 0.2 0.4 0.4 0.6 0.6 0.8 0.8 1.0 1.0
Adar1E861A/E861A editing level
Adar1 +/+ editing level 0.0 0.0 0.2 0.2 0.4 0.4 0.6 0.6 0.8 0.8 1.0 1.0
Adar1E861A/E861A editing level
Adar1 +/+ editing level 0.0 0.0 0.2 0.2 0.4 0.4 0.6 0.6 0.8 0.8 1.0 1.0
Adar1E861A/E861A editing level
Adar1 +/+ editing level 0.0 0.0 0.2 0.2 0.4 0.4 0.6 0.6 0.8 0.8 1.0 1.0
Adar1E861A/E861A editing level
Adar1
+/+
editing level
Editing level (%)
0 20 40 60 80 100
WT E861A WT E861A WT E861A WT E861A WT E861A WT E861A WT E861A WT E861A
Bone MarrowBrain Heart Kidney Liver Sm. IntestineSpleen Thymus
3’-UTR 3’-UTR Bri3bp Trim12c WT Brain Bone Marrow WT E861A E861A
T T T A AA G C C C A C T A A G
6
9 56 66
0 12 <1 2 58 22 17 50 0 0 0 0 Htr2c Not expressed
T T T
T A A
A A G A
GC C C C
A I R N P
85 74 4 16
10 1 7 15
Not expressed WT Brain Bone Marrow WT E861A E861A
j
(chrX;143604241) (chrX;143604236) (chrX;143604231) (chrX;143604229) (chrX;71472201) (chrX;71471988)Gabra3 (chrX;69690631)
(chrX;39007465) (chrX;39007429)
Tmem63b (chr17;45799898)
Grm4 (chr17;27639740)
Grik1 (chr16;87940788)
Cog3 (chr14;76119526)
Cacna1d (chr14;30879307)
Cadps (chr14;13244096)
Flnb (chr14;8768562)
Nova1 (chr12;47801321)
Cyfip2 (chr11;46086145)
(chr10;48992595) (chr10;48992582) (chr10;48964136)
Pcmt1 (chr10;7368312)
Gria4 (chr9;4456006)
Kcna1 (chr6;126592176)
(chr3;80510834)
Gria2 (chr3;80510830)
(chr3;80496208)
A630075F10Rik (chr2;169897001)
(chr2;157383885)
Blcap (chr2;157383876)
(chr2;157383846)
Copa (chr1;174022479)
Unc80 (chr1;66719288)
Grik2
Son (chr16;91655860)
Gria3 Flna
Htr2c
not detected
[image:9.595.56.540.86.706.2]A-to-I editing across a range of defined substrates was assessed using microfluidics multiplexed PCR and deep sequencing (mmPCRseq) [48], allowing accurate mea-surements of editing of up to 11,103 sites in 557 loci (Fig. 6a–h, lower panels, Additional file 5: Dataset S3). Changes in editing across the tissues principally reflected the expression profile ofAdar1andAdar2. In the brain, where there are higher relative levels of Adar2 than
Adar1, there is a largely preserved editome with
evi-dence for a subset of ADAR1-specific and ADAR2-specific events (dots on y-axis or x-axis, respectively), but the majority can be edited by both. In contrast, in hematopoietic tissues there is little/no detectableAdar2
and with this there is a near complete absence of editing of known sites when ADAR1 editing is inactivated. In other peripheral tissues assessed, Adar1 predominates and most editing of known sites was lost in the
Adar1E861A/E861A-derived samples. Examples for
ADAR1-specific, ADAR2-specific, and ADAR1/2 shared editing sites were observed (Fig. 6i). We further assessed the status of evolutionary conserved recoding events across the tissues [49]. The most informative tis-sue was the brain, where the majority of these tran-scripts were robustly expressed (Fig. 6j). In the brain, editing at most sites was preserved indicating that ADAR2 was editing these sites. Known ADAR1 dependent sites such as Bclap and two sites in the
Htr2ctranscript had significantly reduced/no editing in the brain [13, 50]. For the remaining tissues, there were several patterns apparent: the transcripts were not de-tected as expressed in the tissue assessed (indicated in white; see Additional file 5: Dataset S3 for mouse EN-CODE expression data from tissues for each transcript); that editing of the conserved sites was preserved indi-cating an ADAR2-specific target, even in tissue with relatively low levels ofAdar2 as assessed by qPCR (see
Cog3as an example); that there was a loss of editing at these sites in theAdar1E861A/E861AIfih1-/--derived tissues indicating these sites are ADAR1-dependent (seeKcna1
in the liver, Nova1 in the bone marrow, Cyfip2 in the liver and small intestine for examples). The failure to edit the conserved sites in the Adar1E861A/E861AIfih1
-/-tissues suggests that while they are ADAR1-dependent
sites, their absence was not deleterious. This analysis demonstrated that editing in the tissues outside the cen-tral nervous system that were assessed is primarily medi-ated by ADAR1, yet despite the loss of this editing, these tissues are normal in the absence of MDA5.
The absence of ADAR1 or loss of ADAR1-mediated A-to-I editing are equivalent in vivo
A direct comparison of the specific loss of ADAR1-mediated editing and complete absence of ADAR1 pro-tein would clarify the potential for ADAR1 to contribute to processes beyond A-to-I editing. The difference in viability and tissue phenotypes between Adar1-/-Ifih1
-/-and Adar1E861A/E861AIfih1-/- rescued mice suggested
there may be editing-independent roles of ADAR1. We initially assessed cohorts of Adar1-/-Ifih1-/- and
Adar1E861A/E861AIfih1-/- pups and littermate controls at the day of birth, a time point when the majority of the
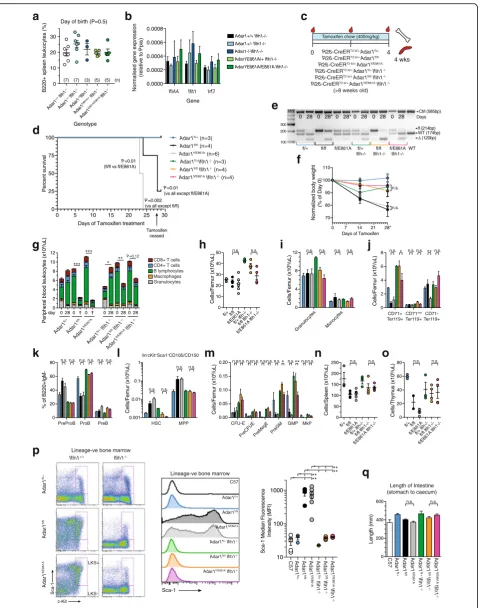
Adar1-/-Ifih1-/- are viable [17]. At this developmental age, there was no difference between the ADAR1 null and editing-deficient alleles with the frequency of B cells in the spleen being equivalent and no apparent activation of the innate immune sensing pathway (Fig. 7a, b).
Next, we evaluated this using an acute somatic dele-tion model comparingR26-CreERAdar1fl/+(control; ex-pressing WT ADAR1 protein after tamoxifen treatment),
R26-CreERAdar1fl/fl(ADAR1 protein null after tamoxi-fen treatment), andR26-CreERAdar1fl/E861A(expressing an editing deficient ADAR1 protein after tamoxifen treatment) on both an MDA5 WT and null background (Fig. 7c). All mice were aged at least eight weeks at the initiation of up to 28 days treatment with tamoxifen ad-ministered via the food (400 mg/kg in standard chow). The R26-CreER Adar1fl/fl and R26-CreER Adar1fl/E861A
animals both lost condition and weight from day 14 on-ward (Fig. 7d–f ). This decline in health was accompanied by a severe reduction in PB indices and the euthanasia of all R26-CreER Adar1fl/E861A animals and three of four
R26-CreERAdar1fl/flanimals prior to day 28 of treatment (Fig. 7f, g). All remaining genotypes remained healthy at day 28 and were assessed on day 29 (Fig. 7d). Upon eu-thanasia or cessation of tamoxifen as indicated, genotyp-ing confirmed the efficient recombination of the floxed (See figure on previous page.)
Fig. 6ADAR1 is the predominant ADAR in peripheral tissues and affects editing levels across all tissues.a–hUpper panels: qRT-PCR ofAdar
expression from tissues of 12-week-old mice. Data normalized toPpiaand are the mean ± SEM (n = 3/genotype).n.dnot detected.Lower panels:
Editing of known sites measured using multiplexed PCR and deep sequencing (mmPCR-seq) in each tissue. Editing levels inAdar1+/+Ifih1
-/-(ADAR1 WT;y-axis) plotted against those in theAdar1E861A/E861AIfih1-/-(ADAR1 editing deficient;x-axis) with each individual site indicated by a dot. Gray dot= no significant difference,red dot=P< 0.05.iExamples of editing at three loci.Colored panelsindicate the edited nucleotides ((+) strand:green= A,orange= G; (-) strand:red= T(A),blue= C(G)).Bri3bpis a representative sharedAdar1andAdar2target at the third adenosine; Trim12cis representative of an ADAR1-specific target.Htr2cis representative of an ADAR1-specific recoding event at the first two sites. Percent
editing is indicated for each site.jAnalysis of conserved editing sites in each tissue by mmPCR-seq. Editing sites were compared between
a
b
R26-CreERT2 ki/+ Adar1fl/+
R26-CreERT2 ki/+ Adar1fl/fl
R26-CreERT2 ki/+Adar1fl/E861A
R26-CreERT2 ki/+ Adar1fl/+ Ifih1
-/-R26-CreERT2 ki/+ Adar1fl/flIfih1
-/-R26-CreERT2 ki/+ Adar1fl/E861AIfih1
-/-(>8 weeks old)
0 4
Tamoxifen chow (400mg/kg)
4 wks
Days of Tamoxifen treatment
Percent survival
Tamoxifen ceased
Sca-1
Lineage-ve bone marrow
Adar1fl/fl
Adar1fl/E861A
Adar1fl/flIfih1
-/-Adar1fl/E861AIfih1
-/-C57
Adar1fl/+
Adar1fl/+Ifih1
-/-Adar1 fl/fl Ifih1 -/-Adar1 fl/E861A Ifih1 -/-C57
Sca-1 Median Fluorescence
Intensity (MFI) ** 10 100 1000 Adar1 fl/+ Adar1 fl/+ Ifih1 -/-Adar1 fl/fl Adar1 fl/E861A ** ** **
0 5 10 15 20 25 30
0 25 50 75 100
Adar1fl/fl (n=4)
Adar1fl/E861A (n=6)
Adar1fl/flIfih1-/- (n=4)
Adar1fl/E861AIfih1-/- (n=4)
Adar1fl/+ (n=3)
Adar1fl/+Ifih1-/- (n=3)
P=0.002
(vs all except fl/fl)
P=0.01
(vs all except fl/E861A)
P=0.01
(fl/fl vs fl/E861A)
c
0 2 4 6 8 10 12 Adar1 fl/flIfih1 -/-Adar1 fl/E861A Ifih1 -/-Adar1 fl/+ Adar1 fl/+Ifih1 -/-Adar1 fl/fl Adar1 fl/E861A0 280 0 0 28 0 28 0 28
day
CD4+ T cells B lymphocytes Granulocytes CD8+ T cells
Macrophages
Peripheral blood leukocytes (x10
6/uL)
d
0 10 20 30 40 50 Cells/Femur (x10 6/uL)fl/+ fl/fl
fl/E86
1A
fl/+ I fih
-/-fl/fl Ifi h1
-/-fl/E86
1A Ifi
h1
-/-h
0 4 8 12 Cells/Femur (x10 6/uL) Granul ocy tes Monoc yte si
0 2 4 6 8 Cells/Femur (x10 6/uL) CD71+ Ter119+ CD71mid Ter119+ CD71-Ter119+j
0 20 40 60 80% of
B220+IgM-PreProB ProB PreB
k
0.001 0.01 0.1 1 Cells/Femur (x10 6/uL) HSC MPPlin-cKit+Sca1+CD105/CD150
l
0.00 0.05 0.10 0.15 0.20 Cells/Femur (x10 6/uL) PreGM GMP MkP PreMegE CFU-E PreCFUEm
0 50 100 150 200 250 Cells/Spleen (x10 6/uL) fl/+ fl/fl fl/E8 61A fl/+ I fih -/-fl/fl Ifih1 -/-fl/E861 A If ih1-
/-n
0 20 40 60 80 Cells/Thymus (x10 6/uL) fl/+ fl/fl fl/E861Afl/+ Ifih
-/-fl/fl I fih
1-
/-fl/E8
61A I
fih1
-/-o
Sca-1 c-Kit Adar1 fl/fl Adar1 fl/E861A LKS+ LKS-Adar1 fl/+Ifih1+/+ Ifih1 -/-Lineage-ve bone marrow
p
0 200 400 600 Adar1 fl/fl Ifih1 -/-Adar1 fl/E861A Ifih1 -/-C57 Adar1 fl/+ Adar1 fl/+ Ifih1 -/-Adar1 fl/fl Adar1 fl/E861A Length (mm)Length of Intestine (stomach to caecum)
q
*** ***
** P=0.12
*
0 7 14 21 28*
70 80 90 100 110
Normalized body weight
(% of Day 0)
Days of Tamoxifen
n.s. n.s.
n.s. n.s. n.s. n.s. n.s. n.s. n.s. * n.s. n.s. **n.s.
n.s. n.s. n.s. n.s. n.s. n.s.
n.s. n.s. n.s. n.s.
n.s.n.s. n.s.n.s. n.s.n.s. n.s.*n.s.**n.s.n.s. n.s. n.s. n.s. n.s.
n.s. n.s. fl/fl fl/E861A fl/+
Ifih-/-fl/fl
Ifih1-/-0 28 Ifih1-/-0 28* Ifih1-/-0 28* Ifih1-/-0 28 0 28 0 28
WT
WT (174bp) fl (214bp)
Δ (120bp)
300 200 100 MW fl/+ Days fl/E861A Ifih1-/-Ctrl (585bp) 0 10 20 30 Adar1
+/+ Ifih1
-/-Adar1
+/- Ifih1 -/-Adar1 -/-Ifih1 -/-Adar1 E861A/+ Ifih1 -/-Adar1 E861A/E861 A Ifih1
-/-B220+ spleen leukocytes (%)
Day of birth (P=0.5)
Genotype
(7) (7) (3) (5) (5) (n)
Ifi44 Ifit1 Irf7
Gene Adar1+/+ Adar1+/- Ifih1-/- Adar1-/-Adar1E861A/+ Adar1E861A/E861A
Ifih1-/-Normalised gene expression
(relative to Ppia )
e
f
g
0.0000 0.0002 0.0004 0.0006 0.0008 [image:11.595.60.540.85.694.2]allele in the R26-CreER Adar1fl/+ animals (Fig. 7e). The
R26-CreER Adar1fl/fland R26-CreER Adar1fl/E861A, while both moribund and requiring euthanasia, retained the floxed allele indicative of selection against deletion as pre-viously observed in other settings [14, 18, 19]. Strikingly, the absence of MDA5 allowed the efficient recombination of the floxed allele in both theR26-CreERAdar1fl/flIfih1
-/-andR26-CreERAdar1fl/E861AIfih1-/-animals (Fig. 7e). We focused our assessment on hematopoiesis, given the well-characterized impact of ADAR1 deficiency on this system. Across PB (Fig. 7g), BM (Fig. 7h–m), spleen (Fig. 7n, Additional file 3: Figure S2), and thymus (Fig. 7o, Additional file 3: Figure S2), the results were highly comparable: that the complete absence of ADAR1 protein and the specific absence of A-to-I editing by ADAR1 were largely indistinguishable, and that the dele-tion of MDA5 rescued both the ADAR1 null and editing deficient alleles equivalently. In the presence of MDA5, the deletion of ADAR1 or prevention of editing by ADAR1 resulted in a loss of erythroid progenitors (Fig. 7j), a block in B-cell maturation in the BM (Fig. 7k), an accumulation of phenotypic stem and primitive pro-genitor populations (Fig. 7l) with a loss of the committed myelo-erythroid progenitor populations (Fig. 7m). These changes were prevented by the deletion of MDA5. The activation status of the innate immune response was queried using expression of Sca1, a cell surface protein induced by IFN resultant from an innate immune response [14, 51]. In the R26-CreER Adar1fl/fl and
R26-CreER Adar1fl/E861A BM primitive hematopoietic population, there was a profound upregulation of Sca1 expression that was completely prevented by deletion of MDA5 (Fig. 7p). Intestinal length was assessed as prior work identified intestinal shortening following the somatic deletion ofAdar1in aMavs-/-background, although the age of these animals was not provided [17]. No difference in intestinal length was observed in our cohorts (Fig. 7q). These results demonstrate that the complete absence of ADAR1 and the specific
absence of ADAR1-mediated A-to-I editing, in either the presence or absence of MDA5, respectively, are largely indistinguishable in adult mice. Therefore, pre-venting MDA5 substrate formation requires A-to-I editing of endogenous RNA and is the primary in vivo function of ADAR1.
Discussion
The consequences of altered ADAR1 function are se-vere, from embryonic lethality in mice to debilitating neurological disease and systemic interferonopathy in humans with loss-of-function alleles [22, 52], to putative oncogenic roles when overexpressed [31, 53, 54], so it is critical to clearly define the key function(s) of ADAR1. In contrast to the physiologically essential role of tran-script recoding by ADAR2, the importance of recoding to the biology of ADAR1 was unknown. In addition to protein recoding, ADAR1 can edit dsRNA substrates resulting in changes in multiple aspects of miRNA bio-genesis or function, affect mRNA stability, 3’-UTR length and translation, and modify splice site usage in addition to altering dsRNA secondary structures, which have been proposed to interface with the innate immune sensing system [19, 55]. We now demonstrate that the absence of ADAR1-mediated editing is surprisingly well tolerated, once the innate immune sensor MDA5 is de-leted.Adar1E861A/E861AIfih1-/-mice are strikingly normal in a homeostatic state. Given the extent of A-to-I editing in the transcriptome, the precedent of ADAR2/Gria2
and the diverse functions in which ADAR1 is implicated [2, 6, 56, 57], this was unexpected. This demonstrates that exonic recoding of transcripts by ADAR1, as well as other proposed editing-dependent effects of ADAR1 on gene expression, are not essential for development and adult homeostasis. Consistent with this, we saw very few changes to the global gene expression profile in adult brain of Adar1E861A/E861AIfih1-/- mice. The lack of phe-notypes in the Adar1E861A/E861AIfih1-/- mice at homeo-stasis reveals that ADAR1’s primary and physiologically (See figure on previous page.)
Fig. 7The complete absence of ADAR1 and the specific loss of ADAR1-mediated editing activity phenocopy.aPercentage of B cells (B220 + ve) spleen leukocytes in the indicated genotypes at the day of birth, n as indicated in (a). Data are pooled from at least two separate litters per genotype. bExpression ofIfi44,Ifit1, andIrf7transcript in whole brain from the indicated genotypes on the day of birth, n as for (a).cExperimental outline of
somatic deletion model; all mice were aged≥8 weeks at tamoxifen initiation (defined as day 0).dKaplan–Meier survivalplotof each genotype.
AllIfih1-/-lines fall under theAdar1fl/+. Mice were analyzed on the day of euthanasia or day 29 as indicated.eGenotyping of genomic DNA at day
0 (PB-derived cells) and day 28/euthanasia (BM-derived cells) for each genotype.fChange in body weight (day 0 normalized to 100%) and day
28/euthanasia.gPB leukocyte counts and lineage distribution within the total leukocyte count at day 0 (pre-tamoxifen) and day of euthanasia or
day 28 as indicated in (b). Statistics compare day 0 and day of euthanasia/day 28 within an individual genotype.hBM cellularity, (i) granulocytes
and macrophages, (j) erythroid cells, (k) percentages of B cell precursors within the B220 + IgM- population, (l) stem cell and multipotent progenitor
populations, (m) the numbers of myelo-erythroid progenitors/femur for each genotype.nSpleen and (o) thymus cellularity.pRepresentative FACS
plotsof Sca-1 expression in the lin-c-Kit+BM fraction. Representative median fluorescence intensity histogramplotsof Sca1 and quantitation of Sca1
expression levels.qIntestine length (stomach–caecum) for each genotype at day of euthanasia or day 29 as indicated in (b). Statistical comparison
most important function is to edit endogenous RNA to prevent the formation of endogenous MDA5 substrates.
We do not exclude subtle or additional phenotypes in the Adar1E861A/E861AIfih1-/-mice that were not appreci-ated in our analysis, as were demonstrappreci-ated after the broad phenotypic testing of the Adar2-/-Gria2R/R mice [10]. Additionally, the analysis of the Adar1E861A/E861AIfih1
-/-animals in non-homeostatic settings, such as when sub-jected to stress or in pathological settings, may identify essential functions for ADAR1-mediated editing that are not apparent under the homeostatic conditions assessed here. A small number of mammalian conserved, posi-tively selected recoding events have been identified [49]. While ADAR2 can edit many of these sites, particularly in the brain, it is also highly likely that the requirement for these may only become apparent in very specific cir-cumstances. The known conserved ADAR1 dependent sites in Bclap and the Htr2c transcript were no longer edited in the Adar1E861A/E861AIfih1-/- animals. Recoding events mediated by ADAR1 have been demonstrated to result in altered protein function. An example is the recoding of a serine-to-glycine in AZIN1 (p.S365G) [49, 54]. In this instance, the edited form of AZIN1 is predicted to result in a gain-of-function allele, whereas our murine models have a loss of ADAR1-mediated editing and the physiological consequences of this are likely to be distinct. Overall, the absence of the con-served ADAR1-mediated recoding events appears well tolerated, suggesting that these proteins may have functions in the whole organism that are either mild/ subtle, that their absence is not sufficient to be patho-genic in isolation, or that these only demonstrate an essential requirement in specific settings.
The nexus between ADAR1 and the innate immune system, centered on the MDA5-MAVS axis, has solidi-fied due to the work of a number of groups, including our own [17, 26]. However, the differences between the
Adar1E861A/E861AIfih1-/- animals reported here and the variousAdar1-/-rescued mice are intriguing [17]. Man-nion et al. reported survival of the Adar1-/-Mavs-/- ani-mals until the day of birth and that there was normal histology of internal organs of an Adar1-/-Mavs-/- pup at this time [26]. Pestal et al. also identified that the vast majority (>90–95%) of both Adar1-/-Mavs-/- and
Adar1-/-Ifih1-/-pups died by two days after birth. A very small number of the Adar1-/-Mavs-/- pups were identi-fied that survived for 13–20 days. These rare Adar1 -/-Mavs-/- survivors had defects in kidney patterning, small intestines, lymph nodes, and B lymphopoiesis [17]. The Adar1E861A/E861AIfih1-/- animals do not have these phenotypes, nor is an absence of B cells apparent in the cohort of Adar1-/-Ifih1-/- pups we assessed on the day of birth (Fig. 7a, b). The simplest interpretation of this is that editing-independent functions of ADAR1
have essential functions, specifically in early post-natal development. The phenotypes reported for the rescued
Adar1-/- were on a Mavs-/- background, which may be
an important contributing factor to the differences compared to the Adar1E861A/E861AIfih1-/-. The genetic rescue of the Adar1-/- achieved by loss of MDA5 was qualitatively better than MAVS deficiency at the day of birth [17]. A possible explanation may be that there is a difference between the cellular consequences of being
Mavs-/-andIfih1-/-. InAdar1-/-Mavs-/-andAdar1p150 -/-Mavs-/- cells, unedited endogenous dsRNA – the
pre-sumptive candidate immunogenic substrate – are
formed and can be sensed by MDA5. The loss of MAVS prevents downstream signaling, but sensing and fila-ment formation by MDA5 remains intact. While the consequences of MDA5 filament formation in the ab-sence of signaling is unknown, it is possible based on the rescue of the Adar1E861A/E861AIfih1-/- animals and cells that these may in part contribute to the pheno-types observed. Supporting this, in a cell-based assay of MDA5 function, 5–10% of signaling activity remained in the absence of MAVS [58].
To directly assess the contribution of editing-dependent and editing-inediting-dependent function of ADAR1 under identical conditions, we assessed pups at the day of birth and used an adult somatic deletion model that leaves animals acutely as eitherAdar1-null (Adar1fl/fl) or editing deficient (Adar1fl/E861A). The pups assessed on the day of birth were grossly normal, had normal B cell frequency in the spleen, and no evidence of activated ISGs, indicating that an absence of B cells is not an MDA5-independent function of ADAR1 at the age assessed but may be a phenotype restricted to those rare animals that survived 10–20 days after birth [17]. How these rareAdar1-/-Mavs-/-animals adapted and survived is unclear. ADAR1p150 appears to have a more specific function in B-cell homeostasis than ADAR1p110 based on the analysis ofAdar1p150-/-Mavs-/-, which would not be appreciable in the assays we have completed where both ADAR1 isoforms are either null or editing deficient [17]. In the somatic deletion model that we have applied, there was no/little difference across nearly all cell pop-ulations enumerated between the being ADAR1 null and editing-deficient on either an MDA5 WT and null background. This demonstrated that the Adar1-null animals were no worse off than animals expressing only an editing-deficient protein. Second, the phenotypes of ADAR1 deficiency or of editing loss were comparably rescued by MDA5 deletion. The somatic deletion of
Adar1 on a Mavs-/- background resulted in disrupted
intestinal homeostasis five days after tamoxifen treat-ment [17], with the caveat that the Adar1+/+Mavs
deletion model on anIfih1-/-background; however, these experiments have several important differences in-cluding Cre strain used and route of tamoxifen admin-istration that limit direct comparison.
While acknowledging there may be
editing-independent functions of ADAR1 that are only apparent in early postnatal development, we favor an alternative interpretation. We hypothesize a critically sensitive time point in early post-natal development where unedited dsRNA loads reach a high enough level, akin to the threshold model proposed for DNA sensing [59], that development cannot proceed and where having an ADAR1 protein, even editing-deficient, that can bind RNA is sufficient to “sequester” the dsRNA, can block/ reduce signaling to a tolerated level. Whether expression of an editing-deficient cytosolic isoform of ADAR1 would elicit the same effect requires testing. If it were to reduce innate immune signaling in the absence of editing, it would support the concept as has been ob-served in C. elegans and in murine embryonic fibro-blasts (MEFs) [26, 60]. The subtle innate immune activation, at least on a transcriptional level in the
Adar1E861A/E861AIfih1-/- tissues, alludes to alternative minor pathways able to induce the production of ISGs independent of MDA5 (Fig. 2a). Very recently it was re-ported that Ribonuclease L deficiency could rescue cell death associated with deletion of ADAR1 in a human cell line model [61]. The murine genetic data and res-cue indicate that such a mechanism does not get acti-vated in the Adar1E861A/E861AIfih1-/- animals, consistent with the concept that having a protein capable of binding RNA, even if incapable of editing, is advantageous com-pared to being completely deficient for ADAR1.
The present data demonstrate that once MDA5 is neu-tralized, there are no essential ADAR1-mediated editing events required for mammalian development and adult homeostasis. We do not find evidence for an analogous essential protein recoding event(s) mediated by ADAR1 to that ofGria2for ADAR2. Moreover, A-to-I editing by ADAR1 of a variety of substrates, including the editing of miRNAs and their target sequences, outside of modi-fying the potential for these to interact with MDA5, is neither essential nor required for normal mammalian homeostasis. The parallels between the ADAR1 null and editing-deficient models suggest that editing independent roles of ADAR1 are not significant contributors to the in vivo phenotypes associated with loss of ADAR1. As the transcriptional response and cellular consequences of loss of ADAR1 are conserved across mammals, these data have implications for humans withADAR1mutations, particu-larly those with AGS [17, 21, 52]. Our data demonstrate that if MDA5 activity/expression can be prevented or re-duced, even in the context of a completely editing-deficient ADAR1 protein, this is sufficient to result in
largely normal development with limited consequences on long-term organ and tissue homeostasis.
Conclusions
These analyses demonstrate that the lifetime absence of ADAR1-editing is well tolerated, once MDA5 is inacti-vated. We conclude that protein recoding arising from ADAR1-mediated editing, unlike ADAR2, is not essen-tial for organismal homeostasis. The comparison of both germline and acute somatic deficient Adar1-/- and
Adar1E861A animals, on either a WT and
MDA5-deficient background, did not identify distinct differences between being ADAR1 protein-deficient and having only the expression of an editing dead protein. The pheno-types associated with loss of ADAR1 are the result of RNA editing and MDA5-dependent functions. A-to-I editing by ADAR1 of a variety of substrates, including the editing of miRNAs and their target sequences, out-side of modifying the potential for these to interact with MDA5, is neither essential nor required for normal mammalian homeostasis.
Methods Animals
All animal experiments were approved by the AEC (AEC#030/14 and AEC#031/15; St. Vincent’s Hospital, Melbourne). AdarE861A/+ (Adar1E861A/+; MGI allele:
Adartm1.1Xen; MGI:5805648),Ifih1-/-(Ifih1tm1.1Cln), Adar
-/-(Adar1-/-; MGI allele:Adartm2Phs; MGI:3029862),Adarfl/fl
(Adar1fl/fl; MGI allele: Adartm1.1Phs; MGI:3828307), and
Rosa26-CreERT2 (Gt(ROSA)26Sortm1(cre/ERT2)Tyj) mice
were on a backcrossed C57BL/6 background as previ-ously described [14, 18, 19, 62, 63]. For day of birth ana-lysis, females were plug mated and pups collected before midday on the day of birth. For acute somatic deletion model, all animals were aged≥8 weeks at tamoxifen initiation; tamoxifen-containing food was prepared at 400 mg/kg tamoxifen citrate (Sigma) in standard mouse chow (Specialty Feeds, WA, Australia).
Histology
Four (two males, two females) 12-week-oldAdar1E861A/+ Ifih1-/-andAdar1E861A/E861AIfih1-/-littermates were used for histopathology examination. Tissue collection and histology was performed by the Australian Phenomics Network Histopathology and Organ Pathology Core, University of Melbourne. One male and one female
Flow cytometry analysis and fluorescent activated cell sorting
Peripheral blood was analyzed on a hematological analyzer (Sysmex KX-21 N, Roche Diagnostics). Single-cell BM, spleen, and thymus suspensions were prepared by passing through a 23-G needle (BM) or crushing through a 40-μm cell strainer (spleen/thymus) [64]. Antibodies against murine Ter119, CD71, B220, IgM, CD11b/Mac1, Gr1, F4/80, CD43, CD19, CD4, CD8, CD44, Sca-1, c-Kit, CD34, FLT3, FcγR (CD16/32), CD41, CD105, and CD150 were either biotinylated or conjugated with FITC; phycoerythrin, phycoerythrin-Cy5, peridinin chlorophyll protein-Cy5.5, phycoerythrin-Cy7, allophycocyanin, or allophycocyanin eFluor780 were all obtained from eBioscience. CD105 and CD150 were from BioLegend. Biotinylated antibodies were detected with streptavidin conjugated with Brilliant Violet-605 (Biolegend). Cells were analyzed on a BD LSRIIFortessa (BD Biosciences). Results were analyzed with FlowJo software Version 10.0 (Treestar).
For serum cytokine/chemokine expression analysis, serum was isolated from peripheral blood and assessed using a custom bead-based immunoassay (LEGENDPlex, BioLegend) measuring murine IFNγ IFNβ, IL-10, TNFα, CXCL10, CXCL1, CCL2, and CCL11. Serum from age-and sex-matched WT C57B6/J mice from the same rooms of the BioResources Facility were run in parallel. Samples were assessed on BD LSRIIFortessa (BD Biosci-ences). Results were analyzed with LEGENDPlex software version 7.0 (Biolegend). As a control, tissue culture media was isolated from immortalized myeloid progenitor cells generated from Rosa26-CreERT2 Adar1E861A/fl cell lines that were treated with 200 nM tamoxifen for four days to delete the WTAdar1allele. These cells were immortalized with HoxA9 and selected for proliferation in GM-CSF conditioned media as described [44].
Micro-computed tomography analysis of bone parameters (microCT)
Ex vivo microCT was performed on tibiae using the Sky-Scan1076 system (Bruker-microCT, Kontich, Belgium) essentially as previously described [47]. Male and female 12-week-old tibia were isolated, fixed overnight in 2% paraformaldehyde, and then stored in 70% ethanol until imaged. Images were acquired using the following set-tings: pixel size = 9 μm, aluminum filter = 0.5 mm, volt-age = 45 kV, current = 220μA, rotation = 0.7°, and frame averaging = 1. Images were reconstructed and analyzed with SkyScan software programs NRecon (version 1.6.3.3), DataViewer (version 1.4.4), CT Analyser (CTan, version 1.12.0.0), and CTVox (version 2.2.0). The tra-becular analysis region of interest (ROI) was determined by identifying the start of the mineralized zone of the proximal growth plate and calculating 3% of the total
tibial length towards the tibial mid-shaft, where we then analyzed an ROI of 13.5% of the total tibial length. Ana-lysis of trabecular bone structure was completed using adaptive thresholding (mean of min and max values) in CTan with threshold set at 45–255 for trabecular bone. Cortical analyses were performed at 40% of the total tibial length distal from the mineralized zone of the proximal growth plate and extending for 13.5% of the total tibial length; the threshold values for cortical bone were set to 79–255 and global thresholding algorithm was used. The three-dimensional visualization of tra-becular and cortical bone was performed with CTVox, where volume-rendered images were pseudo-colored based on grayscale (pixel) intensity that is reflective of bone mineralization.
qRT-PCR
Mouse tissues from three independent biological repli-cates from age-matched and sex-matched C57BL/6,
Adar1+/+Ifih1-/-, and Adar1E861A/E861AIfih1-/- mice were homogenized in Trisure reagent using IKA T10 basic S5 Ultra-turrax Disperser. Brain tissue was isolated from the pups collected at the day of birth and snap-frozen, then homogenized in Trisure reagent using IKA T10 basic S5 Ultra-turrax Disperser. RNA was extracted using Direct-Zol columns (Zymo Research) as per man-ufacturer’s instructions. Complementary DNA (cDNA) was synthesized using Tetro cDNA synthesis kit (Bio-line). Real-time PCR was done in duplicate with Brilliant II SYBR Green QPCR Master Mix (Agilent Technolo-gies) and primers from IDT (Additional file 3: Table S2). All primers were optimized to have equal efficiency (100 +/-10%) before use.Ppiawas used as a reference gene for relative quantification using the ΔCt method. RNA was obtained from fetal brain from E12.5 Adar1E861A/E861A
embryos and processed as described above [19].
Microfluidics-based multiplex PCR and deep sequencing (mmPCR-seq) identification of A-to-I editing sites
as a missing value. All editing sites with editing≤0.01 were removed, leaving 413–808 sites per tissue. Sites were ADAR1-specific targets if the editing level mea-surements between the WT (Adar1+/+Ifih1-/-) replicates and the editing-deficient (Adar1E861A/E861AIfih1-/-) repli-cates were significantly different (P< 0.1, ANOVA) and the average editing levels between WT and editing-deficient samples differed by at least 5% [48].
RNA-seq samples: adult brain
Total RNA was isolated from the whole brain from 12-week-old maleAdar1+/+Ifih1-/-andAdar1E861A/E861AIfih1
-/-mice (n = 3/genotype). Sequins were included before ribo-some depletion [65]. Post riboribo-some-depleted RNA was purified and subjected to indexing and library preparation using the Kapa Stranded RNA-seq Library Preparation Kit (Kapa Biosystems) and sequenced using the Illumina Next-Seq500 with 75-bp paired-end reads by the Ramaciotti Centre for Genomics (UNSW, Australia).
RNA-seq samples: fetal brain
Total RNA was isolated from the whole brain from E12.5 old maleAdar1+/+Ifih1-/-andAdar1E861A/E861AIfih1-/-mice (n = 3/genotype). RNA was purified and subjected to indexing and library preparation using the Illumina TruSeq RNA Sample Prep Kit v2. The libraries were sequenced using the Illumina HiSeq2000 with 100-bp paired-end reads by the Ramaciotti Centre for Genomics (UNSW, Australia).
RNA-seq analysis
RNA-seq reads from adult brain were aligned to the MM9/NCBIM37 reference genome with STAR [66] and gene counts were determined using“–quantMode GeneCounts.”Differential gene expression analysis was performed using the Degust analysis tool (http://victorian-bioinformatics-consortium.github.io/degust/); briefly, genes were only considered with a CPM of≥2 in 3/3 replicates of either the Adar1E861A/E861AIfih1-/- or Adar1+/+Ifih1
-/-(13,891 genes). Normalized read counts (moderated log counts per million) and differential expression were generated using edgeR [67] and genes were considered differentially expressed if FDR < 0.05 (124 genes: 81 up, 43 down). Adding a magnitude require-ment to the fold change of abs(log2FC) > 1 resulted in
29 genes (24 up, 5 down).
RNA-seq reads from fetal brain were aligned to the MM9/NCBIM37 reference genome with STAR [66] and gene counts were determined using“–quantMode Gene-Counts.” Differential gene expression analysis was per-formed using the Degust analysis tool (http://victorian-bioinformatics-consortium.github.io/degust/); briefly, genes
were only considered with a CPM of≥2 in 3/3 replicates of either the Adar1E861A/E861AIfih1-/- or Adar1+/+Ifih1
-/-(13,786 genes). Normalized read counts (moderated log counts per million) and differential expression were generated using edgeR [67] and genes were considered differentially expressed if FDR < 0.05 (808 genes: 745 up, 57 down). Adding a magnitude requirement to the fold change of abs(log2FC) > 1 resulted in 303 genes
(294 up, 9 down).
GO term enrichment of genes using PANTHER
PANTHER Overrepresentation Test [68] (release 20160715): PANTHER version 11.1 was used to perform statistical testing on sets of differential genes using allMus musculus
genes as the reference list against GO biological processes, using Bonferroni multiple testing correction.
QuSAGE gene set testing
Quantitative Set Analysis for Gene Expression (QuSAGE) was performed as described [69] against the MSigDB collection“C2:curated gene sets”(c2.cgp.v4.0).
Datasets
All datasets related to this work are deposited in GEO. RNA-seq accessions:
GSE94387 (adult brain) GSE94388 (fetal brain)
GSE94386 (mmPCR-seq: BM, spleen, thymus, liver, brain, kidney, small intestine, and heart)
Statistical analysis
For biological experiments, the significance of results was analyzed using the one-way or two-way ANOVA with multiple comparison corrections unless otherwise stated, P< 0.05 was considered significant. All data are presented as mean ± SEM.
Additional files
Additional file 1:Movie S1Video of 12-week-old male mice. (MOV 11186 kb)
Additional file 2:Movie S2Video of 12-week-old female mice. (MOV 6740 kb)
Additional file 3:Dataset S1Full histopathology report (related to Fig. 4), Figure S1(related to Fig. 4) 12-week-old female mouse bone parameters (full legend with figure).Figure S2(related to Fig. 7) Spleen and thymus data fromR26-CreERAdar1fl/flIfih1-/-andR26-CreERAdar1fl/E861AIfih1-/-and
control animals (full legend with figure).Table S2qPCR primers used
in this study. (PDF 882 kb)
Additional file 4:Dataset S2RNA-seq data (related to Fig. 5). (XLSX 9999 kb)
Additional file 5:Dataset S3mmPCR-seq data (related to Fig. 6). (XLSX 1061 kb)