How to cite this paper: Rodriguez, L.G. and Ortiz, E.Q. (2015) Modeling the Specific Seismic Risk Considering the Weight of Determining Variables. Open Access Library Journal, 2: e1157. http://dx.doi.org/10.4236/oalib.1101157
Modeling the Specific Seismic Risk
Considering the Weight of
Determining Variables
Liber Galbán Rodriguez, Elio Quiala Ortiz
Department of Hydraulic Engineering, Faculty of Construction, Universidad de Oriente, Santiago de Cuba, Cuba
Email:
[email protected]
,
[email protected]
Received 3 April 2015; accepted 19 April 2015; published 24 April 2015
Copyright © 2015 by authors and OALib.
This work is licensed under the Creative Commons Attribution International License (CC BY).
http://creativecommons.org/licenses/by/4.0/
Abstract
The seismic risk determination for any country is a vital tool in the process of physical planning,
construction and reduction of disasters caused by earthquakes. In recent years, there have been
several studies on the subject, however, different methodologies could be improved from the
de-sign of a set of basic criteria, which using the advantages of Geographic Information Systems (GIS),
could help to establish greater clarity in the seismic risk determining. To meet this goal, in this
study, the authors propose a new allocation methodology based on levels of importance of
va-riables that influence the specific seismic risk assessment and propose a new formula for
mathe-matical determination through modeling with GIS.
Keywords
Earthquakes, Methodology, Model, Risk, Variables
Subject Areas: Computer Engineering, Environmental Sciences, Geology, Geomorphology,
Hydrology, Natural Geography
1. Introduction
qua-OALibJ | DOI:10.4236/oalib.1101157 2 April 2015 | Volume 2 | e1157
rries, etc.). The possible occurrence of earthquakes is a threat whose impact can lead to serious injury or
geo-logical risks.
Geological risks are events or circumstances that occur in the geological environment and can cause damage
or harm to communities or infrastructure that are occupying a territory vulnerable areas
[1]
. According to
Galbán
et al.
(2012)
[2]
, seismic risks are a type of geological risk because the event which takes place in the
geological vulnerable enhancer of damage is the earthquake. The determination of the seismic risk leads to
fol-low three key steps: 1) the hazard assessment, 2) vulnerability and, 3) the evolution of risk. Changes in one or
more of these parameters influence the risk in itself. To consider these elements is necessary to use or design a
methodology to provide as much detail as possible to determine the behavior of risk in a given geographic area.
In the analysis of the seismic risk assessment at the international level were detected several methodologies in
this regard, although the methodology mostly employed are the HAZUS promoted by The United States
Geo-logical Survey (USGS) and Federal Emergency Agency (FEMA), and the one used by Japanese GeoGeo-logical
Survey
[3]
.
Most of these methodologies modeled seismic risk from the occurrence or not of the different processes or
factors that lead to hazards, vulnerability and seismic risk, however, with regard to the consideration of the
ef-fect or weight of the variables in their determination are not uniform, especially when it comes to damage to
specific elements located on the ground (buildings and infrastructure, people, etc.), which is why it is necessary
to address this gap and establish a new formulation for determining the seismic risk. To accomplish this task it is
necessary to establish a new formula for mathematical determination of specific seismic risk through modeling
with GIS. The novelty in this process comes in the allocation of a methodology based on levels of importance of
variables that influence the specific seismic risk assessment which takes into account the behavior of elements
involved in the manifestation of the phenomenon, as well as others related to the physical vulnerability
dis-cussed in the geographic spaces.
By other hand, the methodologies used so far internationally to determine the models do use the
multiplica-tion of hazard and vulnerability variables to find the risk. This point of view do not consider that factors
multip-lied only complicate the situation of the risk evaluation, giving them the possibility to be expressed in how many
times or for which factor should be multiplied to obtain a final result, when in real life it is only a sum of
pon-dered facts, which is why it is needed to solve these matters from a different perspective.
2. Definition of the Specific Seismic Risk Model
The Geographic Information Systems (GIS) are a valuable tool to tackle works that require multivariate
model-ing due to the large volume of information they can process, its ability to generate types, and therefore the
pos-sibility of overlapping maps coming to get a map that covers the features of all of them. These elements make
them ideal tools for modeling the specific seismic risk.
Using GIS seismic risk assessment is carried out through the acquisition or development of a set of maps or
models of hazard, vulnerability and specific seismic risk, which are governed by the following mathematical
formulation:
(
.
)
(
.
)
( .
)
=
+
+
Rs
R1 0 30
R2 0 20
R3 0 50
where:
1)
R1 or Liquefaction Model = underwater level (0.30) + Geological Susceptibility (0.30) + Seismic
Accelera-tion (0.40).
2)
R2 or Earthquakes Landslide Model = Vegetation (0.05) + underwater level (0.05) + Geological
Suscepti-bility (0.25) + Topographic slope (0.25) + Faults (0.10) + Seismic Acceleration (0.30).
3)
R3 or Specific vulnerability model = structural seismic vulnerability of buildings per community (0.30) +
structural seismic vulnerability of the Roads (0.10) + Population at risk (0.30) + Seismic Acceleration (0.30).
In the formulation are introduced values which should be multiplied by the variables that influence the hazard
identification, vulnerability and seismic risk; they obey to the weight of these variables in the occurrence or not
of different primary and secondary events.
OALibJ | DOI:10.4236/oalib.1101157 3 April 2015 | Volume 2 | e1157
support of other documented experiences and qualitative analysis of the distribution of the values of the
va-riables in space.
For a better understanding and correspondence between levels and generating information through maps and
graphics or mathematical models, it is suggested to standardize the values from the proposition made by Galbán
et al.
(2012)
[2]
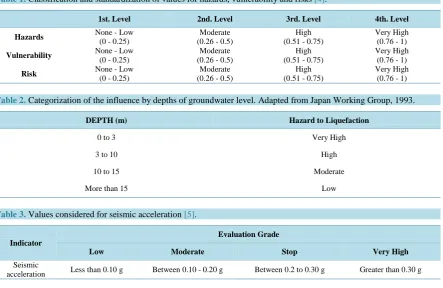
, so that the hazards, vulnerability and risks are classified on a scale from zero to one (0 - 1)
fol-lowing levels represented in
Table 1
.
The proposal aims to integrate on a numerical scale that standardized assessments of hazard, vulnerability and
risk, ensuring that all estimates are based probabilistically by its more affordable comparison; action that is
per-formed by applying mathematical standardization and interpolation methods. The choice the method depends on
the evaluators and can be done automatically with the help of GIS.
3. Evaluations of the Use of Variables
The underwater level is the underground water that exists on the planet and its depth varies depending on the
geological and climatic circumstances. Its presence constitutes an extremely destructive agent when seismic
waves are impacting soils and rocks, causing the phenomenon known as liquefaction. Its influence on the
seis-mic risk is expressed in
Table 2
.
Seismic acceleration is the main characteristic of a seismic wave; its determination allows knowing its value
at every point of the geography. The values used in the research for the consideration of seismic acceleration
were taken form Galbán
et al.
(2012)
[5]
, and are expressed in
Table 3
.
The vegetation development and its type is an important element in the succession of landslides in a given
area. The vegetation and its root system is a factor that can decrease the speed of the slides, and even prevent
them in slope areas. For the consideration of this item assumes the proposition made by Galbán
et al.
(2012)
[5]
and are expressed in
Table 4
.
3.1. Submodel Geological Susceptibility
Lithological variety according to their physical and mechanical properties, express certain geological levels of
susceptibility to the occurrence of different geological processes and phenomena. This influences susceptibility
Table 1.Classification and standardization of values for hazards, vulnerability and risks [4].
1st.Level 2nd.Level 3rd. Level 4th. Level
Hazards None - Low (0 - 0.25) (0.26 - 0.5) Moderate (0.51 - 0.75) High Very High (0.76 - 1)
Vulnerability None - Low
(0 - 0.25)
Moderate (0.26 - 0.5)
High (0.51 - 0.75)
Very High (0.76 - 1)
Risk None - Low
(0 - 0.25)
Moderate (0.26 - 0.5)
High (0.51 - 0.75)
[image:3.595.97.541.439.727.2]Very High (0.76 - 1)
Table 2.Categorization of the influence by depths of groundwater level. Adapted from Japan Working Group, 1993.
DEPTH (m) Hazard to Liquefaction
0 to 3 Very High
3 to 10 High
10 to 15 Moderate
[image:3.595.91.539.446.525.2]More than 15 Low
Table 3.Values considered for seismic acceleration [5].
Indicator
Evaluation Grade
Low Moderate Stop Very High
Seismic
OALibJ | DOI:10.4236/oalib.1101157 4 April 2015 | Volume 2 | e1157 Table 4. Considerations for the influence of vegetation and hazard levels [5].
Evaluation Grade
Low Moderate High Very High
Influence of Vegetation
Over 70 percent.
Well developed tree
cover (forest)
Between 70 - 40 percent. Tree cover relatively developed
Between 40 - 20 percent. Tree cover interbedded with poorly developed herbaceous cover
constants, crops and orchards
Less than 20 percent. Denuded areas with sparse grass and shrub cover (shrubs and secondary herbaceous communities) and
crops and orchards
rocks ability not only to allow passage of the seismic waves, but also to increase the translation speed of them.
Considering the above is proposed to employ the susceptibility for determining geologic model serving as
indi-cated in
Table 5
.
3.2. Topographic Slope Sub Model
The topographic slope value is an element that affects the performance of the force of gravity on the
phenome-non of sliding slope areas, because the greater the slope will have greater performance out of gravity in
conjunc-tion with other factors that also act in landslides. For the consideraconjunc-tion of this item assumes the proposiconjunc-tion
made by Galbán
et al.
(2012)
[5]
and are expressed in
Table 6
.
3.3. Faults Sub Model
For hazard assessment and risk estimation is consider that the main effects related to active faults in the
occur-rence of a strong earthquake are given mainly in the fact that these are weak areas in the surface were increases
of seismic intensity is experimented. Are also areas where differential movements can occur because faults
con-stitute limits of different dynamic blocks and serve as a waveguide from the seismic focus or hypocenter. Based
on these criteria is considered the following (
Table 7
).
3.4. Structural Seismic Vulnerability of Buildings per Community Sub Model
The structural seismic vulnerability of buildings is given by elements related to construction technical states of
buildings in different areas, communities or cities that comprise the study area, taking into account the different
constructive pathologies, speaking states (
Table 8
). Example: For states often adopt four levels or states of harm
they might suffer these buildings and infrastructure
[6]
:
E1 = no damage;
E2 = slight damage, operating;
E3 = damage repairable, not operating;
E4 = severe damage or ruin, out of service.
Given these evaluations is then used the proposition of Galbán
et al.
(2012)
[5]
.
3.5. Structural Seismic Vulnerability of the Roads Submodel
The structural seismic vulnerability of roads is given by elements related to construction technical states of roads
in different areas that comprise the study area, taking into account the different pathologies that are presented
from the bedrock to the asphalt or concrete surface. Given these assessment evaluations is then used on a scale
of 1 to 10 for vulnerability levels as proposed in
Table 9
.
3.6. Population at Risk Sub Model
The population sub-model is obtained from the database for each region edited by government statistics offices.
In it should be introduced, according to the population of different communities and local considerations, the
evaluation criteria. One of the criteria set forth in
Table 10
.
4. Result of the Application of the General Formulation and Discussion of Models
OALibJ | DOI:10.4236/oalib.1101157 5 April 2015 | Volume 2 | e1157 Table 5. Classification of lithological or geological susceptibility influence, according to the general conditions [5].
Rock types General
lithology PFM behavior of rocks
GS Representative
groups RGS
Jointing or cracking Permeability coefficient (cm/s) Moisture Void ratio Deformability of soil (MPa)
Plasticity index
Compressive strength
(Mpa)
Any type of rock, sedimentary or crystalline (this material can be characterized by a
propagation velocity of shear wave greater than
800 m/sec.) Impermeable limestones, basalts, and esites, low degree of weathering, little fracturing rocks with high shear strength, low
level of groundwater.
Drop
Basalt, diabase,
gabbro 0.08
Rigid floors of thickness less than
60 m to the rock base, provided that the
upper layers are composed of stable deposits of
sand, gravel or hard clays (this material can be characterized by a
propagation velocity of shear wave between 450
and 750 m/sec.).
0 - 0.25
Periods are between 0.3 and
0.5 sec.
Andesite, diorite, porphyry,
granite
0.16 Less than 3%
Less than 10 - 8
Between 0% - 10%
Less than 0.15
Greater than
20,000 Less
Greater than 80 Serpentinite, rhyodacite, rhyolite, marble, limestone compact
0.24 to 30
Stable deposits of non-cohesive soils or hard clays when its depth to bedrock exceeds 60 m and the upper layers are composed of sand, gravel or hard
clays (this material can
be characterized by a propagation velocity of shear wave between 240
and 450 m/sec.)
High degree of weathering of rocks mentioned
enzymes and massive clastic
sedimentary rocks, low shear
strength, shear fracture.
OALibJ | DOI:10.4236/oalib.1101157 6 April 2015 | Volume 2 | e1157
Continued
Periods are between 0.5 and
0.8 sec. 0.26 to 0.50 Schists, metamorphic clastic, igneous cracked 0.36 Between 3 and 10% Between 10 - 8
Between 10% - 40%
0.15 to 0.25 Between 20,000 and 10,000 Between 30 and 50
Between 80 and 50
Compact breccias and conglomerates,
sandstones cohesive
0.48 And
10 - 5
Soft clay deposits or sands
averages and thicknesses of 10 m or more with or
without the presence of intermediate layers of sand or
other non- cohesive soils class (this material
can be characterized by a
propagation velocity of shear wave of less than 240 m/sec.)
Unconsolidated rock or soil, weatherproof í sm
significant sedimentary rocks, intrusive and volcanic water table fluctuations. Average Volcano sedimentary rocks 0.54
Periods are between 0.8 and
1.2 sec.
From 0.51 to
0.75
Clays compact 0.62 Between 10% and 30%
Between 10 - 2
Between 40% - 70%
Between 0.25 and 0.50 Between 10,000 and 5000 Between 50 and Between 50 and 20 With jointing massive argillaceous rocks, conglomerates with medium cohesion diaclasades
0.72 And
10 - 5 70
Soft clay deposits with a thickness of 12 m (this material can be characterized by a propagation velocity of shear wave of less than 150 m/sec.)
Quaternary unconsolidated
soils, fill clay soils and pyroclastic unconsolidated fluvio-lacustrine, shallow groundwater levels. High Loams, silts, sandstones 0.76
0.76 to 1 Sandy clay soils, 0.88 Over 30% Greater
than 10 - 2
Greater than 70% Greater than 0.50 Less than 5.000 Greater
than 70 Less than 20
Swamp deposits, fluvio-lacustrine,
alluvial 0.96
GS: geological susceptibility, RGS: Range of geological susceptibility for groups of rocks.
4.1
.
Liquefaction Model
OALibJ | DOI:10.4236/oalib.1101157 7 April 2015 | Volume 2 | e1157 Table 6.Considerations for the influence of the slope and hazard levels [5].
Evaluation of the topographic slope value
Low Moderate High Very high
Between 0 and 15 percent Between 15 to 25 percent Between 25 and 45 percent More than 45 percent
Table 7.Considerations for the influence of faults and hazard levels [5].
Presence of active faults
Low Moderate Stop Very high
In remote locations of the selected area (more than 300 km2)
In the vicinity of the selected location (between 50 and 300 km2)
In close proximity to the selected location (between 5 and 50 km2)
In the vicinity of the selected location (less than 5 km2)
Table 8. Classification of construction technical states for buildings and infrastructure [5].
CTE Index CTE Generaldescription
Good 0 - 0.25 Prevalence of homes and buildings in good condition recent construc-tive. Good structural strength
Regular 0.26 to 0.50 construction pathologies. Moderate structural strength Prevalence of buildings with different
Bad From 0.51 to 0.75 Prevalence of different materials damaged homes.
Poor structural strength
Critical 0.76 to 1 Prevalence of huts, huts, temporary buildings with low cost materials, etc. No structurally resistant
Note: CTE construction technical states.
Table 9.Classification and constructivos of technical states road const [5].
ETC Structural vulnerability of roads Generaldescription
Good 0 - 0.25 Roads in good constructive. Good structural strength of the
base and paving, generally stable soils.
Regular 0.26 to 0.50
Road construction with different pathologies. Paved surface subsidence in some cases or settlements light, presence of
occasional bumps. Embankments improved
Bad From 0.51 to 0.75
S diverse pathology roads, eroded in some sections, with frequent potholes and structural Poor resistance.
Embankments not better ed
Critical 0.76 to 1
Roads with different pathologies constructive well marked. Paved surface in most cases with sinking or settlements, presence of holes, generally unstable soils or aggressive
environments. No structurally resistant. Trails, roads, among others.
ically the result of increased pore pressure caused by cyclic strain: a granular material such as soil sands are
shaken and these are subjected to a rapid compaction also when is saturated, the result of this compaction gives
a rapid lifting of the pore pressure or, since the cutting resistance, which is directly and simply related to the
ef-fective force.
OALibJ | DOI:10.4236/oalib.1101157 8 April 2015 | Volume 2 | e1157
4.2
.
Earthquakes Landslide Model
It is called slide to the mass of rock of low consolidation or compaction that has been moved or moves downhill
slope shed or (artificial slope) under the effect of gravity, hydrodynamic pressure (saturation effect), seismic
forces of various origins, etc. These agents may also act in landslides in combination. From the primary data of
the final model is obtained by earthquakes landslides. Their results are interpreted as posed in
Table 12
.
4.3
.
Specific Vulnerability Model
To determine the specific vulnerability model (R3), it was considered make queries to the system from the
pri-mary core values, levels of specific damages are classified and interpreted as follows (
Table 13
).
4.4. Specific Seismic Risk Model
Finally the specific seismic risk model is obtained from the superposition of the previously obtained submodels.
With the specific purpose of making an assessment as accurate as possible of the elements or variables that
cha-racterize the specific seismic risk, we suggest that the analysis for interpretation be made from what is stated in
the
Table 14
.
5. Conclusions
A methodology for the determination of specific seismic risk through its modeling with the use of GIS, which
has the novel feature weight consideration with the different variables in the process.
Sub models are some variables in concordance by level and values that can be obtained; the valuation of the
Table 10. Criteria for evaluation of the population at risk.
Exposure of the population General description
Low Rural communities usually isolated population, could be far from
generators foci. Less than 10,000 inhabitants
Moderate
Semi rural communities with concentrated population, may be mod-erate distances to generators foci.
Between 10,000 and 75,000 inhabitants.
High Urban communities with concentrated population may be at near
distances to generators foci. Between 75,000 and 250,000 inhabitants.
Very High
Urban communities with highly concentrated population and can be very close distances to generators foci.
[image:8.595.81.540.397.718.2]More than 250,000 inhabitants.
Table 11.Evaluation of risk levels for soil liquefaction.
Indicator
Evaluation Grade
Low Moderate High Very High
Liquefaction Ground solid state Wet soil Soil semi molten state
(saturated) Liquefied soil
Table 12.Evaluation of risk levels for soil liquefaction.
Indicator
Evaluation Grade
Low Moderate High Very High
Soil liquefaction Slow and limited land mass shifts
Moderate shifting of land masses. Few rock collapses.
Rapid and abundant land masses landslides, collapses, landslides,
falling boulders
Shifting of large masses of land, lahars, breakdowns,
OALibJ | DOI:10.4236/oalib.1101157 9 April 2015 | Volume 2 | e1157 Table 13. Levels of specific vulnerability proposed.
Indicator
Evaluation Grade
Under Moderate High Very High
State of buildings and infrastructure pathologies.
From 0 to 10 percent of buildings and infrastructure
are already affected by different pathologies. The population is low, may be isolated and or have excellent knowledge or perception of risk
Between 10 and 30 percent Between 30 to 50 percent More than 50 percent
population considerations
of buildings and infrastructure are already
affected by different pathologies. The population
is midle not concentrated and or have good
knowledge or perception of risk
of buildings and infrastructure are already
affected by different pathologies.
of buildings and infrastructure are already
affected by different pathologies.
The population is concentrated and or have
not good knowledge or perception of risk
The population is highly concentrated and or have no knowledge or perception
[image:9.595.93.538.298.727.2]of risk
Table 14.General elements to consider in the interpretation of the specific seismic risk model.
GRADE Riesgos Risks
Under
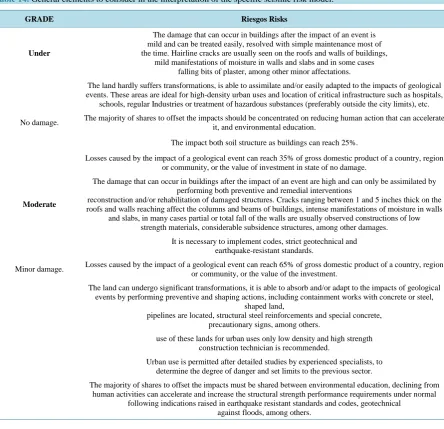
The damage that can occur in buildings after the impact of an event is mild and can be treated easily, resolved with simple maintenance most of the time. Hairline cracks are usually seen on the roofs and walls of buildings,
mild manifestations of moisture in walls and slabs and in some cases falling bits of plaster, among other minor affectations.
The land hardly suffers transformations, is able to assimilate and/or easily adapted to the impacts of geological events. These areas are ideal for high-density urban uses and location of critical infrastructure such as hospitals,
schools, regular Industries or treatment of hazardous substances (preferably outside the city limits), etc.
No damage. The majority of shares to offset the impacts should be concentrated on reducing human action that can accelerate it, and environmental education.
The impact both soil structure as buildings can reach 25%.
Losses caused by the impact of a geological event can reach 35% of gross domestic product of a country, region or community, or the value of investment in state of no damage.
Moderate
The damage that can occur in buildings after the impact of an event are high and can only be assimilated by performing both preventive and remedial interventions
reconstruction and/or rehabilitation of damaged structures. Cracks ranging between 1 and 5 inches thick on the roofs and walls reaching affect the columns and beams of buildings, intense manifestations of moisture in walls
and slabs, in many cases partial or total fall of the walls are usually observed constructions of low strength materials, considerable subsidence structures, among other damages.
It is necessary to implement codes, strict geotechnical and earthquake-resistant standards.
Minor damage. Losses caused by the impact of a geological event can reach 65% of gross domestic product of a country, region or community, or the value of the investment.
The land can undergo significant transformations, it is able to absorb and/or adapt to the impacts of geological events by performing preventive and shaping actions, including containment works with concrete or steel,
shaped land,
pipelines are located, structural steel reinforcements and special concrete, precautionary signs, among others.
use of these lands for urban uses only low density and high strength construction technician is recommended.
Urban use is permitted after detailed studies by experienced specialists, to determine the degree of danger and set limits to the previous sector.
The majority of shares to offset the impacts must be shared between environmental education, declining from human activities can accelerate and increase the structural strength performance requirements under normal
OALibJ | DOI:10.4236/oalib.1101157 10 April 2015 | Volume 2 | e1157
Continued
The impact both soil structure like the buildings can reach 70%
High
The damage that can occur in buildings after the impact of an event are high and
can only be assimilated by performing both preventive and remedial interventions reconstruction and/or rehabilitation of damaged structures. Cracks ranging between 1 and 5 inches thick on the roofs and walls reaching affect the columns and beams of buildings, intense manifestations of moisture in walls and slabs, in
many cases partial or total fall of the walls are usually observed constructions of low strength materials, considerable subsidence structures, among other damages.
It is necessary to implement codes, strict geotechnical and earthquake-resistant standards.
Serious damage Losses caused by the impact of a geological event can reach 65% of gross domestic product of a country, region or community, or the value of the investment.
The land can undergo significant transformations, it is able to absorb and/or adapt to the impacts of geological events by performing preventive and shaping actions, including containment works with concrete or steel, shaped land, pipelines are located, structural
steel reinforcements and special concrete, precautionary signs, among others.
The use of these lands for urban uses only low density and high strength construction technician is recommended.
Urban use is permitted after detailed studies by experienced specialists, to determine the degree of danger and set limits to the previous sector.
The majority of shares to offset the impacts must be shared between environmental education, declining from human activities can accelerate and increase the structural strength performance requirements under normal following indications raised in earthquake
resistant standards and codes, geotechnical against floods, among others.
The impact both soil structure like the buildings can reach 70%.
Very high
Damage can occur in buildings after the impact of an event are severe. The cost of rehabilitation of the building is so high that it becomes impractical implementation. Generally seen widespread cracking in buildings, loss of stability of structures, intense scouring of foundations, in many
cases failure or partial or total collapse of buildings and infrastructure (bridges, roads, etc.), considerable subsidence and landslides structures, destruction, among other damages.
The land can suffer large transformations presented, depending on the phenomenon that impacts: severe cracking, high porosity, subsidence and collapse, opening, rollovers, changes in topography, etc. That is, not assimilate impacts of geological events. In some cases it is advisable to perform preventive and
shaping actions, including containment works with concrete or steel, terrain profiling, piping, structural steel reinforcements and special high-strength concrete, precautionary signs, among others are.
Irreparable damage
Do not use this land for urban purposes is recommended. Only exceptions strategic or historical nature allowed for a community using criteria of high structural and nonstructural resistivity element that can only be achieved with high investment costs.
Could be used as ecological reserves, open recreation, parks or for growing short-cycle plants, consistent with the frequency of the threat.
--These lands are accepted only for urban use of low density and high constructive technical resistance. Its urban use shall be conditioned on the completion of detailed studies by experienced specialists, to determine the degree of danger and set limits to the previous sector.
The majority of shares to offset the impacts of geological events must be shared between environmental education, declining from human activities that can accelerate the impact, the relocation of infrastructure and increased structural strength under strict requirements
control the execution of works by applying principles of total quality management.
Losses to buildings can be up to 100% of the investment value. Destroying a whole can cost several times the GDP of a country, region or community.
variables can be adjusted or improved with more detailed requirement.
References
[1] Ayala Carcedo, F.J. (1992) Introducción a los riesgos geológicos. Instituto Geológico y Minero de España, Editorial Ríos Rosa, Madrid.
OALibJ | DOI:10.4236/oalib.1101157 11 April 2015 | Volume 2 | e1157 Académica Española, Madrid.
[3] JAPGEO (1999) Manual for Zonation of Seismic Geothecnical Hazards. The Japanese Geothecnical Society, Japan. [4] Galbán R.L., Lacaba, R.S., Rodriguez, C.J.T. and Quintana, N.V.I. (2014) Geological Risks Management and
Reduc-tion Procedure for Santiago Cuba Province. Open Access Library Journal, 1, e621. http://dx.doi.org/10.4236/oalib.1100621
[5] Galbán Rodríguez, L., Vidaud Quintana Ingrid, N. and Jacinto, C.R.T. (2012) Indicadores más comunes en la evalua-ción de riesgos geológicos. Indicadores cualitativos y cuantitativos para la evaluaevalua-ción de peligro, vulnerabilidad y riesgos geológicos, Editorial Académica Española, Madrid.
![Table 5. Classification of lithological or geological susceptibility influence, according to the general conditions [5]](https://thumb-us.123doks.com/thumbv2/123dok_us/8136838.798521/5.595.58.552.104.720/classification-lithological-geological-susceptibility-influence-according-general-conditions.webp)
![Table 6. Considerations for the influence of the slope and hazard levels [5].](https://thumb-us.123doks.com/thumbv2/123dok_us/8136838.798521/7.595.90.538.452.627/table-considerations-influence-slope-hazard-levels.webp)