R E S E A R C H
Open Access
In silico lineage tracing through single cell
transcriptomics identifies a neural stem cell
population in planarians
Alyssa M. Molinaro
1,2and Bret J. Pearson
1,2,3*Abstract
Background:The planarianSchmidtea mediterraneais a master regenerator with a large adult stem cell compartment. The lack of transgenic labeling techniques in this animal has hindered the study of lineage progression and has made understanding the mechanisms of tissue regeneration a challenge. However, recent advances in single-cell transcriptomics and analysis methods allow for the discovery of novel cell lineages as differentiation progresses from stem cell to terminally differentiated cell.
Results:Here we apply pseudotime analysis and single-cell transcriptomics to identify adult stem cells belonging to specific cellular lineages and identify novel candidate genes for future in vivo lineage studies. We purify 168 single stem and progeny cells from the planarian head, which were subjected to single-cell RNA sequencing (scRNAseq). Pseudotime analysis with Waterfall and gene set enrichment analysis predicts a molecularly distinct neoblast sub-population with neural character (νNeoblasts) as well as a novel alternative lineage. Using the predicted νNeoblast markers, we demonstrate that a novel proliferative stem cell population exists adjacent to the brain.
Conclusions: scRNAseq coupled with in silico lineage analysis offers a new approach for studying lineage progression in planarians. The lineages identified here are extracted from a highly heterogeneous dataset with minimal prior knowledge of planarian lineages, demonstrating that lineage purification by transgenic labeling is not a prerequisite for this approach. The identification of theνNeoblast lineage demonstrates the usefulness of the planarian system for computationally predicting cellular lineages in an adult context coupled with in vivo verification.
Keywords:Single cell RNAseq, Waterfall, in silico lineage tracing, Neural stem cells, νNeoblasts, Planarians, Schmidtea mediterranea
Background
Understanding how adult stem cells (ASCs) are regu-lated in homeostatic conditions and how they respond to injury and disease is a crucial step in the advancement of regenerative medicine [1]. In particular, elucidating the transition of cell states during lineage progression is a necessary precursor to developing techniques for the directed differentiation of tissue-specific ASCs. In vivo lineage tracing by transgenic labeling has proven to be a key experimental technique for studying the progressive
changes that occur as a stem cell differentiates to pro-duce a mature cell type [2]. However, the limited num-ber of ASCs present in vertebrate tissues makes the study of adult lineage progression difficult in these or-ganisms [3].
The freshwater planarianSchmidtea mediterraneais a non-parasitic flatworm well known for its regenerative ability [4–6]. Planarians have a large population of ASCs, termed neoblasts, which comprise approximately 20 % of the cells in the animal and are collectively responsible for the homeostatic maintenance and regeneration of all tissue types [7, 8]. Although S. mediterraneais morpho-logically simple, molecular studies involving in situ hybridizations of a variety of neural markers have dem-onstrated complexity within the planarian central ner-vous system (CNS) [9–14]. The planarian CNS consists * Correspondence:[email protected]
1
Hospital for Sick Children, Program in Developmental and Stem Cell Biology, Toronto, ON, Canada
2Department of Molecular Genetics, University of Toronto, Toronto, ON,
Canada
Full list of author information is available at the end of the article
of a bi-lobed brain comprised of approximately 5000 neurons that exist in precise patterns and ratios of major neuronal subtypes [13–15]. Two ventral nerve cords ex-tend posteriorly to the tail tip of the animal and the ani-mal has an extensive peripheral nervous system [16]. Not only can a decapitated planarian regenerate its en-tire brain in 7–10 days, but it has recently been shown that an uninjured animal has high levels of neuronal cell death and replacement (homeostasis) [17, 18]. Together, this has led to the hypothesis that there may be a popu-lation of ASCs committed to producing cells required by the CNS (i.e., neural stem cells) [12, 19].
Although planarians have the advantage of complete, scarless neural regeneration and provide the ability to study ASC biology in vivo, they have not been amenable to genetic lineage tracing experiments used in other model systems. Thus, it has been a major challenge to understand the cellular lineage progression from a par-ental ASC to differentiated neurons. A candidate gene approach is typically used where gene function is re-moved by RNA interference (RNAi), regeneration or homeostasis defects assayed, and the resulting lineage changes pieced together in a temporally backwards man-ner [12, 18–21]. As an alternative, unbiased approach, here we demonstrate that lineages can be computation-ally determined through the use of single-cell sequen-cing of planarian stem cells and their division progeny. Recently, a newly described bioinformatics approach called Waterfall was applied to single-cell RNA sequen-cing (scRNAseq) data obtained from transgenically la-beled neural stem cells to study their progression from quiescence to activation [22]. By temporally arranging single cells based on their gene expression profiles, Waterfall is able to order cells as a continuum of transi-ent states that define the progression of a particular lineage. Due to the ease of stem cell and progeny purifi-cation in S. mediterranea [18, 23], we hypothesize that Waterfall can be applied to study lineage progression in planarians as an in silico lineage-tracing tool.
Here we present scRNAseq of purified planarian stem (X1) and progeny (X2) cells specifically isolated from the head region and demonstrate the usefulness of the Waterfall analysis pipeline to study neural lineage pro-gression in this model system. Hierarchical clustering of the scRNAseq dataset revealed a high degree of hetero-geneity within the planarian head and allowed for the identification of distinct groups of cells based on gene expression profiles. One group, which we have termed the “ν (nu) Neoblasts”, exhibited overrepresentation of gene sets associated with neural processes and reduced expression of some stem cell and cell cycle genes. By using known markers of planarian stem cells and markers previously shown to be highly expressed in the brain, we were able to identify and exclude the cell
clusters that were not involved in neuronal differentiation and subsequently perform pseudotime analysis on the remaining cells to reveal a putative progression through transient states along a neural lineage. To validate the pro-posed lineage, Waterfall was used to visualize temporal changes in the expression of many other known stem cell and neural markers and showed that they decrease and in-crease, respectively, over pseudotime for this proposed lineage. Further, several genes previously undescribed in planarians with high expression in the νNeoblasts were identified and shown by fluorescent in situ hybridization (FISH) to be expressed in a novelpiwi-2+piwi-1lo cycling stem cell sub-class in the head. In this way, we demon-strate the usefulness of computational transcriptome ana-lysis with Waterfall to develop testable hypotheses about cell-state transitions even in very heterogeneous datasets and demonstrate that solving lineages with scRNAseq is a strength of the planarian system.
Results
Single-cell RNAseq reveals a high degree of stem cell heterogeneity in the planarian head
scRNAseq was used to assess the level of neoblast het-erogeneity in planarian heads (Fig. 1a). Neoblasts are thought to be the only cycling cells in planarians and are irradiation-sensitive [24, 25]; thus, these cells are ablated within 24 h following exposure to 60–100 Gray of
Figure S2a). In addition, examples of single cells express-ing markers of specific lineages were identified (Additional file 2: Figure S2b).
The dataset was reduced to include only the top 1000 highly variable transcripts for all subsequent analyses (Additional file 3: Supplemental data file 3). This was
[image:3.595.62.538.87.528.2]mean expression level (log2(mean) > 3 normalized counts)
(Fig. 1b). Hierarchical clustering of the single cell expres-sion profiles revealed a high degree of heterogeneity among both X1s and X2s and groups were defined by cut-ting the dendrogram at an arbitrary height that allowed for separation of both X1 and X2 populations into distinct groups (ten total groups; Fig. 1c). To validate the initial cluster analysis t-Distributed Stochastic Neighbor Embed-ding (t-SNE) [30] was used to plot a two-dimensional rep-resentation of the scRNAseq dataset. t-SNE clustered the cell groups in agreement with hierarchical clustering (Fig. 1d). As expected, t-SNE also showed clear separation of the X1 and X2 cells (Fig. 1e), further validating the clus-tering results.
The results of the hierarchical clustering analysis on the top 1000 most variable transcripts are summarized in Fig. 1f. Of the ten groups, Groups 1–3 consisted en-tirely of X1s, Groups 5–10 consisted enen-tirely of X2s, and Group 4 contained both X1s and X2s. Detection of the ubiquitous Smed-α-tubulin was used as a positive con-trol for gene detection in all cells and the well-described stem cell markers piwi-1and piwi-2 were used to valid-ate X1 identity [31]. Interestingly, while piwi-2 was de-tected in 100 % of X1s, piwi-1 was only very lowly detected or absent in the expression profiles of Group 3 cells. Because the mean expression level of piwi-1among single X1 cells was 1685 ± 24 normalized counts (3866 ± 48 counts per transcript per million reads in previously pub-lished bulk X1 data [18, 32]), it was unlikely that the low detection in Group 3 was due to dropout events during li-brary preparation. Importantly, neither piwi-1 nor piwi-2 were identified computationally to belong to the 1000 most variable transcripts used for clustering, indicating that the clustering of cells with lowpiwi-1expression is representa-tive of a true biological stem cell state and not an artifact of the gene set used for clustering. As previously observed, piwi-1andpiwi-2expression was variable among sorted X2 cells [31]. In total, these scRNAseq data from head X1 and X2 cells suggested high molecular heterogeneity, as well as a novel X1 type (Group 3) which had a novel piwi-2+piwi-1lo expression state.
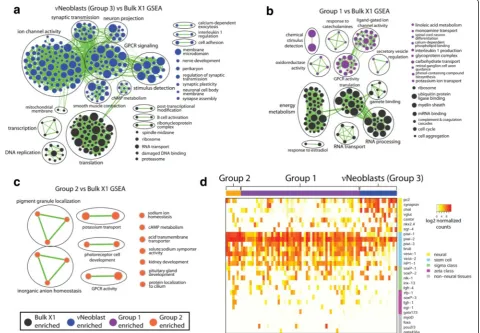
Gene set enrichment analysis reveals an X1 population in the head enriched for neural gene sets
Gene set enrichment analysis (GSEA) was performed to determine whether any groups were enriched for gene sets associated with neuronal processes when compared with the multiple datasets on whole-body bulk X1 se-quencing replicates [18, 32]. Because there is currently no annotated database for planarian genes, those with reciprocal BLAST hits to mouse homologs (e < 1e-4) were identified and the corresponding mouse gene IDs were used for GSEA as previously described [32]. Notably, the piwi-2+piwi-1lo Group 3 displayed an overrepresentation
(false discovery rate (FDR) < 0.01; p< 0.001) of neural-related gene sets (Fig. 2a), such as “neuron projection”, “synaptic transmission”, and “nerve development”; thus, Group 3 will now be referred to as the “nu-Neoblasts” (νNeoblasts). Group 1 was also enriched for neural-associated gene sets (Fig. 2b). Group 2 was enriched for very few gene sets compared with the bulk X1 data and these gene sets were predicted to be involved in a range of cellular processes, including several neural-associated pro-cesses [33] (Fig. 2c). Interestingly, neither Group 4 nor any of the X2-only groups were enriched for neural-associated gene sets, suggesting that maturing neurons may not pass through the X2 gate.
In order to understand these X1 sub-groups in more depth, expression levels of several known neural and stem cell transcripts were examined (Fig. 2d). Compared with Groups 1 and 2, νNeoblasts exhibited the highest expression of the pan-neural markers pc2 [34] and synapsin [10] as well as other genes known to be expressed in the brain (listed in Fig. 2d). Conversely,
νNeoblasts exhibited relatively low expression of known stem cell markers, such as vasa-1 [35] and HP1-1[36], although expression of these genes was still detected. Expression of non-neural tissue progenitor markers (myoD(muscle) [12],foxa(pharynx) [37],pou2/3 (proto-nephridia) [20] andgata456a(gut) [38]) was detected in a minority of Group 1 cells but was absent from all
νNeoblasts, suggesting that the νNeoblasts may repre-sent an X1 population responsible for specifically con-tributing to neuronal lineages. Notably, Group 2 cells exhibited the highest expression of stem cell markers, especially piwi-1 and piwi-2, and did not express non-neural tissue markers, suggesting that Group 2 may be the least committed to any lineage.
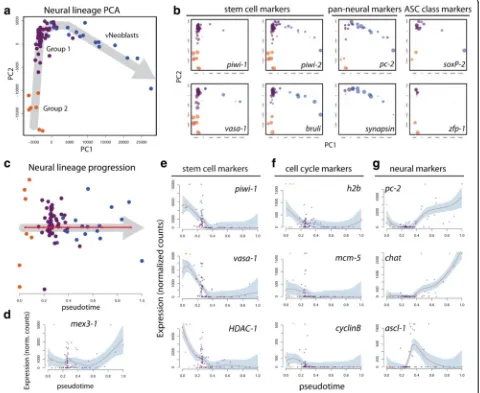
Waterfall analysis predicts a neural lineage trajectory
could imagine a trajectory beginning with theνNeoblasts and progressing through Group 1 then Group 2, or the exact opposite. It is also possible that Group 1 repre-sents the earliest stem cell state, which can differentiate along two distinct lineages (Group 2 or νNeoblast). To predict the most probable orientation of the trajectory, known stem cell and neural markers were examined and relative expression is represented as the size of the data points in the PCA plots in Fig. 3b. From this it was evi-dent that Group 2 cells consistently displayed the high-est expression of the known stem cell markers piwi-1, piwi-2, vasa-1 and bruli [39]. Expression of these four genes remained high in some Group 1 cells but was only lowly detected in others. Finally, νNeoblasts generally did not express piwi-1 or vasa-1 but did expresspiwi-2 andbruli. The expression levels of the pan-neural markers pc-2 and synapsinwere also considered for route deter-mination. Both of these genes were consistently highly
expressed inνNeoblasts and also in some Group 1 cells, but detection was lower or absent in Group 2 cells. Ex-pression of proposed markers for the previously described
σand ζneoblast classes was also considered. Theζ-class marker zfp-1was detected in only very few cells and did not appear to be group-specific [20] (see “Discussion”). Interestingly, expression of theσ-class markersoxP-2was detected primarily in Group 1 cells; however, analysis of scRNAseq data published by Wurtzel et al. [40] raises questions about the specificity of previously described
[image:5.595.59.540.90.423.2]trajectory was subsequently used for pseudotime ana-lysis. To temporally arrange the cells and assign pseudo-time values, k-means clustering was performed on the PCA plot and the k-means centers were connected by a minimum spanning tree (MST) trajectory. A pseudotime value for each cell was subsequently computed as de-scribed by Shin et al. [22], which essentially flattens Fig. 3a into Fig. 3c. As a proof of principle that pseudo-time analysis with Waterfall is a valid method for predicting cellular lineages, Waterfall was also applied to the well-characterized epithelial lineage using the scRNAseq data from [40]. The resulting pseudotime trajectory correctly predicted the temporal expression patterns of the epithelial lineage, beginning with ζ-class
neoblasts, then early progeny, and ending with known late progeny markers (Additional file 6: Figure S5). Thus, pseudotime analysis with Waterfall is a valid method for predicting cellular lineage trajectories.
Plotting the expression levels of known genes along pseudotime illustrated the progressive changes that occur along the predicted νNeoblast neural lineage tra-jectory. Expression ofmex3-1, a gene highly expressed in X1 and X2 cells and required for differentiation of neural cell types [18], was detected in all three groups and increased toward the end of pseudotime, which was the expected result because these cells are predicted to represent transient states along a continuum of increas-ing differentiation (Fig. 3d). Importantly, known stem Fig. 3Pseudotime analysis with Waterfall predicts a neural lineage trajectory.aPCA plot for Groups 1 and 2 andνNeoblasts.Grey arrow, proposed lineage orientation; eachpointis a single cell.bPCA plots with data point size proportional to the expression level of the gene specified in each plot.
cPlot of Groups 1 and 2 andνNeoblast cells ordered along pseudotime.Red line, linearized minimum spanning tree connecting k-mean centers;grey arrow, direction of lineage progression;y-axis, distance of cell to its nearest k-means center.d–gExpression patterns of known markers support the Waterfall lineage prediction:ddifferentiation genemex3-1;estem cell markerspiwi-1,vasa-1, andHDAC-1;fcell cycle markersh2b,mcm-5, andcyclinB;
[image:6.595.60.540.90.483.2]cell markers showed expression that was highest early in pseudotime and then gradually decreased (Fig. 3e). Simi-larly, the cell cycle markers h2b [41], mcm-5 [36], and cyclinB[31] were highest in Groups 1 and 2 and low in
[image:7.595.60.539.530.673.2]νNeoblasts despite the fact that all groups were sorted through the same X1 FACS gate (Fig. 3f ). The expres-sion of neural genes known to be expressed in the bulk X1 population, pc-2 and chat, was initially low in pseu-dotime and began to increase in the last Group 1 cells, reaching a maximum in theνNeoblasts (Fig. 3g). Finally, expression of the achaete-scute gene homolog ascl-1, which has previously been shown to have X1 expression, peaked at the Group 1 to νNeoblast transition, further supporting a transition state in the predicted lineage and suggesting that neural fates are downstream of ascl-1, similar to its established roles in vertebrates and flies [12, 42–44]. Together with the GSEA results, analysis of the scRNAseq data with Waterfall confidently predicted the progression of a neural lineage through pseudotime based on the expression of known stem cell, cell cycle, and neural genes.
piwi-2marks a population of head-specific stem cells
The observation made during the initial cluster analysis that some head X1s expressedpiwi-2but notpiwi-1was surprising and warranted further investigation in vivo. Characterization by whole-mount in situ hybridization (WISH) demonstrated that piwi-2 expression labeled more cells in the anterior than piwi-1along with diffuse brain labeling (Fig. 4a, b). Because these cells were clustered together into the νNeoblast group, it was hypothesized that piwi-2+piwi-1lo stem cells may be specific to the neural lineage; thus, double-fluorescent WISH (dFISH) was performed to assess the level of colocalization between piwi-1 and piwi-2 in the stem
cell compartment between the brain lobes and in the tail region, where there is no brain (Fig. 4c). In the tail, 96.6 ± 2.8 % of piwi-2+ cells were also piwi-1+; however, in the head, only 84.4 ± 2.6 % of piwi-2+ cells also expressed piwi-1 (Fig. 4d; p= 0.00035).
PIWI-1 protein has be shown to persist in cells even when piwi-1 expression can no longer be detected and colocalization of PIWI-1 with lineage-specific markers has been used to mark progenitor populations [18, 45]. BecauseνNeoblasts were predicted to arise from a piwi-1+population, allpiwi-2+stem cells were expected to be PIWI-1+. Indeed, >99 % of the piwi-2+ cells both be-tween the brain lobes and in the tail colocalized with PIWI-1 (Fig. 4e; p= 0.89742), supporting the predicted lineage and that the piwi-2+ cells were recently piwi-1+. The observation that not all stem cells expressed the pu-tative planarian pan stem cell markerpiwi-1and, indeed, that its expression was absent in a specific subpopula-tion of stem cells in the head may explain why a neural stem cell population has been elusive to detect in planarians.
Pseudotime analysis and in vivo validation of
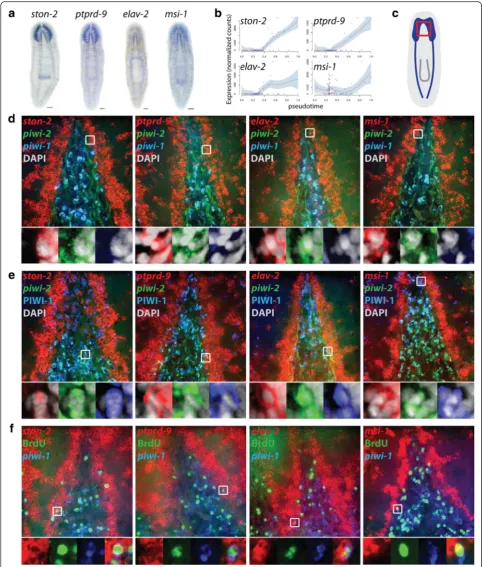
νNeoblast-enriched genes
In order to identify novel candidate genes involved in neural lineage progression, the expression patterns of 11 genes enriched in the Group 3 νNeoblasts were charac-terized by WISH (Fig. 5a; Additional file 7: Figure S6; Additional file 8: Supplemental data file 4). Strikingly, every gene tested was expressed in the brain and many were also expressed in the ventral nerve cords and pho-toreceptors. Four of these genes (ston-2, elav-2, ptprd-9, and msi-1 [46]), whose expression gradually increased over pseudotime (Fig. 5b), were further analyzed by triple FISH (tFISH) with piwi-1 and piwi-2 in the head
Fig. 4In situ identification ofpiwi-2+piwi-1lostem cells.aColorimetric WISH ofpiwi-1.bColorimetric WISH ofpiwi-2. Scale bars = 100μm.cHigh magnification images of the stem cell regions in the head between the brain lobes (top row) and tail stripe (bottom row) are shown.Arrowheads, piwi-2+piwi-1-PIWI-1+cells.dQuantification ofpiwi-2andpiwi-1colocalization in the stem cell areas in the head and tail; n = 5,p= 0.00035.
Fig. 5In situ validation of candidate neural lineage genes identified with Waterfall.aColorimetric WISH. Dorsal view, anterior up, scale bars = 100μm.
[image:8.595.56.539.87.655.2](Fig. 5c). Consistent with the observation thatνNeoblasts generally did not expresspiwi-1, examples ofν-gene+ piwi-2+piwi-1locells in the stem cell compartment between the brain lobes were identified (Fig. 5d). In addition, ν-gene/ piwi-2 dFISH combined with immunofluorescence for PIWI-1 expression demonstrated the presence of ν-gene
+
piwi-2+PIWI-1+cells in the head (Fig. 5e). In both cases, these cells were typically located along the lateral edge of the stem cell compartment, adjacent to the brain. This is consistent with the hypothesis that these cells arose from apiwi-1+population (i.e., Group 1) and, as they continued to differentiate along the neural lineage, had begun to mi-grate toward the brain lobes where they will terminally differentiate into mature neurons. Further, homeostatic worms were injected with the thymidine analog bromo-deoxyuridine (BrdU) and fixed after a 4-h chase period to determine whether these cells are actively cycling, which was predicted because they were isolated from the X1 gate. Following this very short time chase, some ν-gene+ cells had already incorporated BrdU (Fig. 5f). Interestingly, these cells typically also expressed low levels of piwi-1, which suggested that they represent the earliest stage of neural commitment.
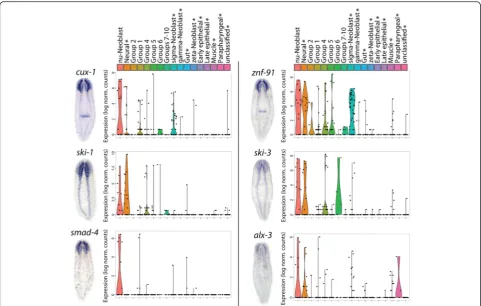
Additionally, six transcription factors enriched in
νNeoblasts were identified and were shown to have primarily neural expression patterns by WISH (Fig. 6; Additional file 8: Supplemental data file 4). Comparison of the expression levels of these transcription factors be-tween distinct cell groups identified in the current study as well as in [40] demonstrated that these genes are highly specific to νNeoblasts (X1s) and/or mature neu-rons (X-insensitive) (Fig. 6). Based on these in vivo vali-dations of the in silico predictions, we concluded that pseudotime analysis with Waterfall can be used to iden-tify new, lineage-specific expression differences, which can then provide the groundwork for future studies of neural homeostasis and regeneration.
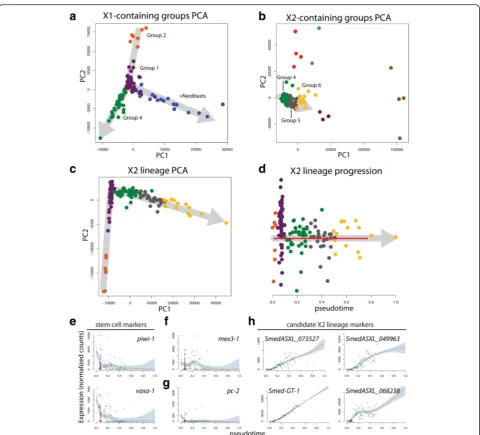
Waterfall analysis reveals a novel lineage trajectory through the X2 gate
The initial Waterfall analysis on the full scRNAseq data-set suggested a prominent X2 lineage. Because Group 4 contained both X1 and X2 cells, we hypothesized that this group may represent cells transitioning from the X1 fraction to the X2 fraction. To understand how these cells related to the three X1-only groups, PCA was per-formed with the X2-only groups excluded (Fig. 7a). Interestingly, the Group 4 cells appeared to originate from Group 1 cells as a lineage separate from the
νNeoblasts; this observation was also consistent with the hypothesis that Group 1 may represent a pluripo-tent stem cell population, from which multiple line-ages originate. Next, 3in order to understand how Group 4 cells related to the X2-only groups, PCA
was performed, this time excluding the X1-only groups. A clear trajectory through Groups 4, 5, and 6 was observed (Fig. 7b). Thus, Waterfall analysis pre-dicted that Group 2 gives rise to Group 1, which can subsequently differentiate to produce νNeoblasts or proceed down the Group 4 to X2 lineage.
PCA and pseudotime analysis were performed for this predicted X2 lineage (Fig. 7c, d). As expected, ex-pression of the stem cell markers piwi-1 and vasa-1 decreased over pseudotime (Fig. 7e). Expression of the differentiation-regulatormex3-1peaked at the Group 4 to Group 5 transition, which largely coincided with the tran-sition from X1 to X2 (Fig. 7f). This suggested a role for mex3-1in directing X1 differentiation along an X2 lineage and agrees with the previous finding thatmex3-1mediates the decision between self-renewal and differentiation [18]. The pan-neural marker pc-2 was not detected in this lineage (Fig. 7g). Several examples of genes that gradually increased over pseudotime were identified by testing the most highly expressed transcripts in Group 6, as this group was predicted to be the most differentiated. Curi-ously, 11/18 of these transcripts did not have clear ho-mologs in mice, humans, flies, or C. elegans but displayed striking pseudotime expression patterns (four representative examples are shown in Fig. 7h; Add-itional file 8: Supplemental data file 4).
The discrepancy in the average number of transcripts detected in X1s (5150) compared with X2s (2050) was consistent with the notion that stem cells are transcrip-tionally primed to produce several different cell types and that gene expression becomes more specific as cells differentiate. This concept was addressed by first com-paring the number of transcripts detected in each cell with the number of sequencing reads, which revealed no correlation (Pearson correlation = 0.1869, R2= 0.03494; Additional file 9: Figure S7a) and confirmed that the difference observed between X1s and X2s was not a consequence of data acquisition. Plotting the number of transcripts detected along pseudotime for the X2 lineage, which contained X1s and X2s, revealed that gene expression decreased gradually during this differ-entiation process (Additional file 9: Figure S7b, red dashed line indicates the beginning of lineage com-mitment). Again, this was independent of read depth, which remained constant throughout this pseudotime trajectory. As expected, this trend was less obvious for the neural lineage, which only extended to the earliest stage of lineage commitment and did not include any non-stem cell states (Additional file 9: Figure S7c).
Modeling planarian lineage relationships in silico
Merging the scRNAseq datasets from the current study and [40], PCA was used to predict global relationships between the various groups identified by each study (using a newly generated list of the top 1000 highly vari-able transcripts from the combined datasets). Figure 8a displays a PCA plot including the predicted pluripotent groups (Groups 1 and 2 from the current study and the
σNeoblasts from [40]) and groups representing various lineages (the νNeoblasts and Group 4 X1s from the current study and the γNeoblasts and epithelial lineage groups (ζNeoblasts, early epithelial and late epithelial) from [40]). The result was quite striking: Group 1, Group 2, and σNeoblasts clustered directly on top of each other and formed a vertex from which the lineage-specific groups extended outward as distinct, non-overlapping “branches”. Importantly, this “lineage tree” pattern was maintained even upon removing different lineages from the analysis (Fig. 8b–e). These analyses were highly supportive of our neural lineage predictions and demonstrated that the clustering groups identified in silico are robust and lead to novel lineage discovery as well as generate testable hypotheses to take back to the worm in vivo (Fig. 8f ).
Discussion
In silico analysis as a new approach for elucidating planarian ASC lineages
Here we demonstrate the usefulness of computational techniques for predicting lineages from single cell transcriptomes in planarians. Waterfall was applied to hierarchically clustered single-cell transcriptome data to identify a neural stem cell population, the ν Neo-blasts, within the X1 FACS gate and predicted a neural lineage trajectory in planarian heads. Subse-quent in situ hybridization experiments revealed neural expression patterns for several genes enriched in νNeoblasts and pseudotime analysis predicted that the expression of many of these ν-genes increases as differentiation progresses along the neural lineage. The in silico analyses also predicted the presence of a novel population of piwi-2+piwi-1lo stem cells in the head, which was subsequently validated by dFISH. Previously, planarian stem cell studies have focused almost exclusively on piwi-1+ cells; thus, this finding should be considered for future studies, as exclusion of piwi-1- cells may result in an incomplete view of the planarian stem cell compartment and biased inter-pretation of experimental results.
[image:10.595.57.539.87.393.2]Although the focus here was on neural lineage pro-gression, the Waterfall pipeline has led to the identifica-tion of a novel X2 lineage in the planarian head that was not enriched with neural gene sets. This illustrates the usefulness of pseudotime analysis for predicting lineages from highly heterogeneous scRNAseq datasets and for identifying new candidate genes for lineage specification, even without first selecting for a specific lineage by transgenic labeling. In future studies, it will be interest-ing to apply the Waterfall analysis pipeline to scRNAseq data acquired from whole-body samples and during
brain regeneration to gain insights into the molecular timing of lineage specification in an injury context. Upon unbiased scRNAseq of thousands of cells in the future, we predict that every cell lineage in planarians can be dissected by computational means.
Stem cell hierarchies in planarians and detection of neoblast classes
The concept of stem cell hierarchies has not been assessed to great depth in planarians due to the lack of transgenic lineage tracing. Here pseudotime analysis has Fig. 7Pseudotime analysis with Waterfall predicts a novel, non-neural X2 lineage.aPCA plot for the X1-containing groups.bPCA plot for the X2-containing groups.cPCA plot for the predicted X2 lineage.dPlot of X2 lineage (Groups 1, 2, 4, 5, and 6) cells ordered along pseudotime.Red line, linearized MST connecting k-mean centers;grey arrows, direction of lineage progression;y-axis, distance of cell to its nearest k-means center.
[image:11.595.58.539.84.519.2]predicted a neural lineage that progresses sequentially through three major X1 subgroups (Group 2, Group 1, andνNeoblasts).In a recent study on planarian stem cell heterogeneity, σNeoblasts have been proposed to give rise to theζNeoblasts of the epithelial lineage and poten-tially γNeoblasts of the gut lineage, speaking to their pluripotent nature and leaving open the possibility that other lineages may also extend from this stem cell class [20]. The expression of different tissue-specific markers in Group 1 may suggest that it is primed for differenti-ation along multiple lineages, with the enrichment of
neural gene sets a consequence of collecting only cells from the head region. As displayed in Figs. 2d and 3b, Group 1 cells expressed the highest levels of the σ Neo-blast markersoxP-2and also expressed other genes pre-viously shown by [20] to be enriched in σNeoblasts, raising the possibility that Group 1 cells are members of the σ-class. However, analysis of additional planarian scRNAseq data published by [40] questions the specifi-city of these previously publishedσNeoblast markers. As demonstrated in Additional file 5: Figure S4, the previ-ously identifiedσNeoblast markers are in fact expressed Fig. 8Model of planarian stem cell hierarchies.aPCA for predicted pluripotent and lineage-committed groups from the current study and [40]. Colored arrowsindicate separate lineages.b–ePCA plots with the following lineages removed:bneural lineage;cnovel X2/Group 4 lineage;
[image:12.595.55.541.86.509.2]evenly across all three neoblast classes identified by [40], unlike the ζmarker zfp-1and γ markerhnf4, which are largely specific to their respective classes. Thus, are
σNeoblasts a truly distinct neoblast class or simply a collection of non-ζand non-γcells? Further, the propos-ition that σNeoblasts give rise toζNeoblasts is based on the ability of X1 cells obtained fromzfp-1(RNAi) animals to reconstitute the ζ-class when grafted into irradiated hosts with no stem cells [20]. Unfortunately, due to the technical limitations in isolating specific cell types, it is impossible to know precisely which types of neoblasts (σ,γ, ν, or other currently unidentified classes) gave rise to the newly formed ζNeoblasts. This is not to suggest that previous conclusions were unfounded but rather to highlight the limitations of current techniques for lineage analysis and the need for a new, unbiased ap-proach for studying lineages in planarians. In addition, another σNeoblast marker,znf-91, identified by Wurtzel et al. [40] was found to be one of the top ν Neoblast-enriched transcription factors and is primarily expressed in the brain and ventral nerve cords (Fig. 6), suggesting that some σNeoblasts may be misclassified νNeoblasts. Thus, due to the lack of specific markers, it is difficult to conclude whether previously described neoblast classes are represented in our dataset. Nevertheless, a connec-tion between Group 1 and σNeoblasts can be drawn based on the predicted pluripotency of these two X1 groups, as presented by the PCA plots and model of proposed lineages in Fig. 8. The fact that different lineages appear to originate from Group 1/σNeoblasts supports this connection and supports the relationship betweenσNeoblasts and the ζNeoblasts/epithelial lineage despite the uncertainty mentioned above. That being said, the presence of additional heterogeneity within Group 1/σNeoblasts cannot be ruled out and may be re-solved in future scRNAseq studies by using cells isolated from different regions of the planarian or during regeneration.
In addition to the neoblast classes discussed above, a relatively rare cell type, the clonogenic neoblasts (cNeoblasts), has been demonstrated to have the self-renewal capacity to re-populate the entire stem cell compartment following irradiation and can give rise to cells of all tissues [17, 35]. Such a stem cell would be expected to reside upstream of the Group 1/σNeoblasts on the stem cell hierarchy, leading to the hypothesis that Group 2 cells may be cNeoblasts (Fig. 8f). Interestingly, fewer transcripts are typically detected in Group 2 cells compared with Group 1 cells (Additional file 9: Figure S7). While highly speculative, this speaks to the idea that Group 2 may represent a less active, or possibly quiescent, stem cell population under homeostatic conditions. Al-though some cell cycle markers were detected in some Group 2 cells, it is not unreasonable to hypothesize that
the massive injury caused by decapitating the worms prior to FACS resulted in the activation of this stem cell popula-tion in the short time period from amputapopula-tion to sorting (30–60 min). It will be interesting to test these hypotheses in future studies by RNAi knockdown of group-specific candidate genes to better understand the nature of these stem cell subgroups and how they behave in both homeo-static and regenerative contexts in planarians.
No prediction of the epithelial lineage in the head
From the results presented here, it is clear that Waterfall can be used as an efficient way to determine novel lineage trajectories, leading to testable hypotheses. How-ever, from our regionalized X1 and X2 cells from the head, it did not predict the epithelial lineage that is already known to exist in planarians. For example, it has been shown thatzfp-1+ζNeoblasts give rise toprog-1/2+ and agat-1+ epithelial progenitors [20]. This lineage physically exists in the head by WISH, yet Waterfall did not pull the lineage out of our scRNAseq dataset. There are three possible explanations for this: (1) Waterfall was not sensitive enough to detect this lineage; (2) the low percentage of cells that express these progenitor markers was too small in the context of 168 cells used in this study; or (3) the X1 stem cells that give rise to epithelial progenitors are not prevalent in the head. First, the abundance of prog-1/2+ epithelial progenitors in the X2 gate is very low (only 8.5 % of X2s are early epithelial progenitors [47]) and the number detected in this study was 5/72 X2s, or 7 %. This is a very low number in the context of our total cells and neither prog-1 nor prog-2 were identified in the top 1000 variably expressed genes. Furthermore, no study has been able to show that epithelial progenitors are actually born in the head and they may instead be born more posterior and mi-grate forward, similar to eye progenitors [45]. Second, as illustrated in Additional file 6: Figure S5, when we incorporated 245 additional cells sequenced in [40] from the body of the animal and used the top 1000 variable transcripts from this combined dataset, our analysis pipeline readily predicts the known order of epithelial lineage differentiation described by previous works [18, 20, 47]. This proof of principle example provides confidence in the ability of this technique and analysis pipeline to reconstruct planarian neoblast lineages. Thus, we propose that the epithelial lineage was not predicted in our dataset due to a combin-ation of sequencing cells only from the head region and the total number of cells sequenced.
Conclusions
model system for stem cell and regeneration biology. Without transgenics, however, elucidating the mecha-nisms of tissue turnover and regeneration in vivo has been challenging. Here we show for the first time that, with recent advances in single cell technology and bio-informatics modeling, it is possible to discover ASC line-ages in planarians de novo via pseudotime analysis of single cell transcriptomes. This approach has identified a new neural stem cell population, the νNeoblasts, and has predicted the existence of a novel X2 lineage in planarian heads (Fig. 8f ). Overall, this study demon-strates the usefulness of in silico lineage tracing with Waterfall for studying the progressive differentiation of planarian adult stem cells along multiple lineages. This approach can be applied to regeneration studies in pla-narians in order to gain insights into the mechanisms regulating ASC fate decisions.
Methods
Single-cell FACS and cDNA library preparation
FACS was performed as previously described [18]. Single-cell cDNA libraries were prepared using the Smartseq2 protocol, as previously described [26, 48]. See Additional file 10: Supplemental data file 1 for a detailed protocol.
Sequencing and read alignment
Single-cell libraries were sequenced to an average depth of 4.5 million single end 50-bp reads on an Illumina HiSeq2500 with v4 chemistry and the data have been uploaded under NCBI Gene Expression Omnibus (GEO) project GSE79866. Reads were aligned to theS. mediter-ranea SmedASXL transcriptome assembly under NCBI BioProject PRJNA215411 using bowtie2 [27] with 15-bp 3′ trimming. Raw read counts (Additional file 11: Supplemental data file 5) were imported into R (version 3.2.2) [49] as a matrix with transcripts as rows and cells as columns and normalized with DESeq [50]. See Additional file 11: Supplemental data file 5 for raw single cell counts.
Selection of the top 1000 highly variable transcripts
The normalized counts data were Winsorized to prevent counts from the two most extreme individual cells from contributing to gene selection. Row means and coeffi-cients of variation (CV) were calculated and log-transformed, then plotted as a smooth scatterplot using the smoothScatter function from the graphics package in R. A regression line with 95% confidence intervals was fit to the scatterplot using the statmod package [51] and transcripts were ranked by the signifi-cance of their deviation from the fit. See Additional file 3: Supplemental data file 3 for a ranked list of the top 1000 highly variable transcripts. A new counts matrix was
created (hvg1000.RData), which included the top 1000 transcripts from the ranked list and their normalized read counts in each cell. These counts data were used for all subsequent cluster analyses. The full dataset was also saved as a RData file (full_dataset.RData) for subsequent use in the heatmap and Waterfall pipeline. See Additional file 12: Supplemental data file 2 for a vignette and Additional file 13.
Cluster analysis
A Euclidean distance matrix was computed for the hvg1000 data matrix using the dist function from the stats package in R with default parameters. Hierarchical clustering was then performed using the hclust function with the parameter method =“ward.D2” and the results were plotted using the plot function. The cutree func-tion was used to cut the dendrogram into k = 10 groups, which allowed for separation into several distinct X1 and X2 subgroups. The rect.hclust function was used to add colored boxes around the subgroups on the hclust dendrogram. t-SNE was performed using the R imple-mentation (Rtsne) [30]. The Rtsne function was applied to the hvg1000 counts matrix with default parameters. The results were plotted with the color of the data points corresponding to the group colors from the hclust dendrogram or by FACS gate. The heatmaps were produced using the heatmap.3 code available from https:// raw.githubusercontent.com/obigriffith/biostar-tutorials/ master/Heatmaps/heatmap.3.R with minor modifications (provided as Additional file 14: Supplemental data file 7). See Additional file 15: Supplemental data file 6 for the counts used in Fig. 2d.
Gene set enrichment analysis
GSEA was performed as previously described using plan-arian genes with a reciprocal top BLAST hit in the top five hits to mouse homologs when e < 1e-4and freely available GSEA software [32] (http://www.broadinstitute.org/gsea/). The bulk X1 data were obtained from NCBI GEO (acces-sion numbers GSE68581 and GSE37910).
Waterfall analysis
then called to calculate a pseudotime value for each cell. The y-axis in pseudotime plots represents the distance of each cell to its nearest k-means center. The pseudotime.foo function was used to plot the ex-pression levels of specific genes over pseudotime. See Additional file 12: Supplementary data file 2 for a vi-gnette. Analyses including data from [40] included only single cells isolated at 0 h post-injury and these cells were grouped by their cluster assignment in [40] (accession number SRA:PRJNA276084).
Animal husbandry
Asexual individuals ofS. mediterraneaCIW4 strain were reared as previously described [52].
Cloning
Transcripts enriched in νNeoblasts were identified by performing differential expression analysis using the SCDE R package [28] and cloned using forward and re-verse primers into T4P vectors as previously described [53] and these vectors were subsequently used as PCR templates for the production of riboprobes as previously described [54]. Previously undescribed planarian tran-scripts were named by their top reciprocal blast hit to mouse. The transcripts cloned in this manuscript are available in Additional file 8: Supplementary data file 4.
BrdU, in situ hybridization, and image acquisition
BrdU (Sigma B5002-5G, 25 mg/ml) was dissolved in 50 % ethanol and injected into the gut of animals. Animals were fixed 4 h later and BrdU was stained as previously described [20]. In situ hybridizations were performed as previously described [18, 55]. Colorimetric WISH samples were imaged on a Leica M165 fluores-cent dissecting microscope. dFISH and tFISH samples were imaged on a Leica DMIRE2 inverted fluorescence microscope with a Hamamatsu Back-Thinned EM-CCD camera and spinning disc confocal scan head with Volocity software. Raw images were opened in ImageJ and saved as tiffs and resolution, brightness, and contrast were adjusted in Adobe Photoshop.
Availability of supporting data
The scRNAseq data set supporting the results of this article were uploaded to NCBI GEO, accession number GSE79866. The whole-worm bulk X1 data
sets are available from NCBI GEO, accession
numbers GSE68581 (http://www.ncbi.nlm.nih.gov/geo/ query/acc.cgi?acc=GSE68581) and GSE37910 (http:// www.ncbi.nlm.nih.gov/geo/query/acc.cgi?acc=GSE37910). The S. mediterranea SmedASXL transcriptome assembly is available from NCBI BioProject PRJNA215411 (http:// www.ncbi.nlm.nih.gov/bioproject/?term=PRJNA215411).
Additional files
Additional file 1: Figure S1.FACS gates used for isolating single cells.
aUnirradiated andbirradiated FACS plots. X1 and X2 gates were set based on Hoechst red vs. blue fluorescence detection as previously described [18, 32]; 20,000 cells are plotted. (PNG 422 kb)
Additional file 2: Figure S2.Markers of known tissue lineages are detected among the bulk and scRNAseq samples. Heatmaps displaying log2 normalized counts of known tissue-specific markers inabulk X1 and X2 samples (200 cells each) andbselect single cells (in columns). (PNG 169 kb)
Additional file 3:A ranked list of the top 1000 highly variable transcripts with means, coefficients of variation, and the hierarchical clustering group in which the average expression was highest. (XLSX 56 kb)
Additional file 4: Figure S3.PCA plot including all ten hierarchical clustering groups. This method did not clearly distinguish individual clusters of cell types. (PNG 107 kb)
Additional file 5: Figure S4.Previously describedσNeoblast markers are not specific to theσ-class. Plots were made using an online single cell RNAseq resource published by [40] (http://radiant.wi.mit.edu/app/). Legend of neoblast classes in top right. (PNG 245 kb)
Additional file 6: Figure S5.Pseudotime analysis correctly reconstructs the epithelial lineage.aPCA plot including theζNeoblast, early epithelial, and late epithelial groups identified in [40].Red line, MST connecting k-means centers;grey arrow, direction of lineage progression.bPseudotime plot for the epithelial lineage.Red line, linearized MST connecting k-means centers;grey arrow, direction of lineage progression;y-axis, distance of cell to its nearest k-means center.cSummary model of the epithelial lineage.d–fExpression levels of previously describedζNeoblast (d), early epithelial progeny (e), and late epithelial progeny (f) markers.Red line, local polynomial regression fit; shaded region, 95 % confidence interval. (PNG 539 kb)
Additional file 7: Figure S6.Additionalν-enriched genes. Colorimetric WISH for seven additional transcripts enriched in theνNeoblasts showed strong brain expression. Dorsal view, anterior up, scale bars = 100μm. (PNG 760 kb)
Additional file 8:A table listing the newly described genes and top BLASTx hits. (XLSX 33 kb)
Additional file 9: Figure S7.The number of transcripts detected decreases with increasing differentiation state.aThe number of transcripts detected versus read depth for each single cell sample shows no correlation. Pearson correlation = 0.1869,R2= 0.03494.b, cNumber of transcripts detected (left) or number of reads (right) plotted along pseudotime for the X2 (b) and neural (c) lineages. Thered dashed line indicates the start of lineage commitment.Solid red line, local polynomial regression fit;shaded region, 95 % confidence interval. (PNG 297 kb)
Additional file 10:A detailed protocol for single cell FACS and RNA-seq. (DOCX 39 kb)
Additional file 11:A table of raw read counts obtained for all 168 single cell samples aligned to the SmedASXL planarian transcriptome assembly. (TXT 23858 kb)
Additional file 12:A vignette for reproducing the computational analyses. (TXT 11 kb)
Additional file 13:An annotation file for use with the vignette. (TAB 999 bytes)
Additional file 14:The modified heatmap source code. (R 16 kb)
Additional file 15:A table of normalized counts for the genes used in Fig. 2d for cells in Group 1, Group 2, andνNeoblasts. (TXT 13 kb)
Abbreviations
RNAi: RNA interference; scRNAseq: single-cell RNA-deep sequencing; tFISH: triple fluorescent in situ hybridization; t-SNE: t-Distributed Stochastic Neighbor Embedding; WISH: whole-mount in situ hybridization.
Competing interests
The authors declare that they have no competing interests.
Authors’contributions
AMM performed all experiments and computational analyses. AMM and BJP designed the experiments, interpreted the experimental results, and wrote the manuscript. Both authors read and approved the final manuscript.
Acknowledgements
We would like to thank Dr. Jeff Burrows for help with BrdU injections.
Funding
AMM was supported by Canadian Institute for Health Research (CIHR) Frederick Banting and Charles Best Canada Graduate Scholarship-Master’s (CGS M) and Natural Sciences and Engineering Research Council of Canada (NSERC) grant number RGPIN-2016-06354. BJP was supported by Ontario In-stitute for Cancer Research (OICR) grant #IA-026.
Author details
1Hospital for Sick Children, Program in Developmental and Stem Cell Biology,
Toronto, ON, Canada.2Department of Molecular Genetics, University of Toronto, Toronto, ON, Canada.3Ontario Institute for Cancer Research,
Toronto, ON M5G0A4, Canada.
Received: 23 March 2016 Accepted: 8 April 2016
References
1. Tollervey JR, Lunyak VV. Adult stem cells: simply a tool for regenerative medicine or an additional piece in the puzzle of human aging? Cell Cycle. 2011;10:4173–6.
2. Blanpain C, Simons BD. Unravelling stem cell dynamics by lineage tracing. Nat Rev Mol Cell Biol. 2013;14:489–502.
3. Weissman IL. Stem cells: units of development, units of regeneration, and units in evolution. Cell. 2000;100:157–68.
4. Reddien PW, Sanchez Alvarado A. Fundamentals of planarian regeneration. Annu Rev Cell Dev Biol. 2004;20:725–57.
5. Newmark PA, Sanchez Alvarado A. Not your father’s planarian: a classic model enters the era of functional genomics. Nat Rev Genet. 2002;3:210–9. 6. Cebria F. Regenerating the central nervous system: how easy for planarians!
Dev Genes Evol. 2007;217:733–48.
7. Rink JC. Stem cell systems and regeneration in planaria. Dev Genes Evol. 2013;223:67–84.
8. Pellettieri J, Sanchez Alvarado A. Cell turnover and adult tissue homeostasis: from humans to planarians. Annu Rev Genet. 2007;41:83–105.
9. Agata K, Soejima Y, Kato K, Kobayashi C, Umesono Y, Watanabe K. Structure of the planarian central nervous system (CNS) revealed by neuronal cell markers. Zoolog Sci. 1998;15:433–40.
10. Cebria F. Organization of the nervous system in the model planarian Schmidtea mediterranea: an immunocytochemical study. Neurosci Res. 2008;61:375–84.
11. Cebria F, Kudome T, Nakazawa M, Mineta K, Ikeo K, Gojobori T, et al. The expression of neural-specific genes reveals the structural and molecular complexity of the planarian central nervous system. Mech Dev. 2002;116:199–204.
12. Cowles MW, Brown DD, Nisperos SV, Stanley BN, Pearson BJ, Zayas RM. Genome-wide analysis of the bHLH gene family in planarians identifies factors required for adult neurogenesis and neuronal regeneration. Development. 2013;140:4691–702.
13. Fraguas S, Barberan S, Ibarra B, Stoger L, Cebria F. Regeneration of neuronal cell types in Schmidtea mediterranea: an immunohistochemical and expression study. Int J Dev Biol. 2012;56:143–53.
14. Currie KW, Pearson BJ. Transcription factors lhx1/5-1 and pitx are required for the maintenance and regeneration of serotonergic neurons in planarians. Development. 2013;140:3577–88.
15. Hill EM, Petersen CP. Wnt/Notum spatial feedback inhibition controls neoblast differentiation to regulate reversible growth of the planarian brain. Development. 2015;142:4217–29.
16. Ross KG, Omuro KC, Taylor MR, Munday RK, Hubert A, King RS, et al. Novel monoclonal antibodies to study tissue regeneration in planarians. BMC Dev Biol. 2015;15:2.
17. Wagner DE, Wang IE, Reddien PW. Clonogenic neoblasts are pluripotent adult stem cells that underlie planarian regeneration. Science. 2011;332:811–6.
18. Zhu SJ, Hallows SE, Currie KW, Xu C, Pearson BJ. A mex3 homolog is required for differentiation during planarian stem cell lineage development. Elife. 2015;4:1–23.
19. Scimone ML, Kravarik KM, Lapan SW, Reddien PW. Neoblast specialization in regeneration of the planarian Schmidtea mediterranea. Stem Cell Rep. 2014;3:339–52.
20. van Wolfswinkel JC, Wagner DE, Reddien PW. Single-cell analysis reveals functionally distinct classes within the planarian stem cell compartment. Cell Stem Cell. 2014;15:326–39.
21. Tu KC, Cheng LC, Tk Vu H, Lange JJ, McKinney SA, Seidel CW, Sanchez Alvarado A. Egr-5 is a post-mitotic regulator of planarian epidermal differentiation. Elife. 2015;4.
22. Shin J, Berg DA, Zhu Y, Shin JY, Song J, Bonaguidi MA, et al. Single-cell RNA-Seq with Waterfall reveals molecular cascades underlying adult neurogenesis. Cell Stem Cell. 2015;17:360–72.
23. Hayashi T, Asami M, Higuchi S, Shibata N, Agata K. Isolation of planarian X-ray-sensitive stem cells by fluorescence-activated cell sorting. Dev Growth Differ. 2006;48:371–80.
24. Newmark PA, Sanchez Alvarado A. Bromodeoxyuridine specifically labels the regenerative stem cells of planarians. Dev Biol. 2000;220:142–53.
25. Dubois F, Wolff E. Sur une méthode d’irradiation localisée permettant de mettre en évidence la migration des cellules de régénération chez les planaires. Soc Biol Strasbourg. 1947;141:903–9.
26. Picelli S, Bjorklund AK, Faridani OR, Sagasser S, Winberg G, Sandberg R. Smart-seq2 for sensitive full-length transcriptome profiling in single cells. Nat Methods. 2013;10:1096–8.
27. Langmead B, Salzberg SL. Fast gapped-read alignment with Bowtie 2. Nat Methods. 2012;9:357–9.
28. Kharchenko PV, Silberstein L, Scadden DT. Bayesian approach to single-cell differential expression analysis. Nat Methods. 2014;11:740–2.
29. Wang Y, Navin NE. Advances and applications of single-cell sequencing technologies. Mol Cell. 2015;58:598–609.
30. van der Maaten L, Hinton G. Visualizing high-dimensional data using t-SNE. J Mach Learn Res. 2008;9:2579–605.
31. Reddien PW, Oviedo NJ, Jennings JR, Jenkin JC, Sanchez Alvarado A. SMEDWI-2 is a PIWI-like protein that regulates planarian stem cells. Science. 2005;310:1327–30.
32. Labbe RM, Irimia M, Currie KW, Lin A, Zhu SJ, Brown DD, et al. A comparative transcriptomic analysis reveals conserved features of stem cell pluripotency in planarians and mammals. Stem Cells. 2012;30:1734–45. 33. Betke KM, Wells CA, Hamm HE. GPCR mediated regulation of synaptic
transmission. Prog Neurobiol. 2012;96:304–21.
34. Collins 3rd JJ, Hou X, Romanova EV, Lambrus BG, Miller CM, Saberi A, et al. Genome-wide analyses reveal a role for peptide hormones in planarian germline development. PLoS Biol. 2010;8:e1000509.
35. Wagner DE, Ho JJ, Reddien PW. Genetic regulators of a pluripotent adult stem cell system in planarians identified by RNAi and clonal analysis. Cell Stem Cell. 2012;10:299–311.
36. Zeng A, Li YQ, Wang C, Han XS, Li G, Wang JY, et al. Heterochromatin protein 1 promotes self-renewal and triggers regenerative proliferation in adult stem cells. J Cell Biol. 2013;201:409–25.
37. Martin-Duran JM, Amaya E, Romero R. Germ layer specification and axial patterning in the embryonic development of the freshwater planarian Schmidtea polychroa. Dev Biol. 2010;340:145–58.
38. Martin-Duran JM, Romero R. Evolutionary implications of morphogenesis and molecular patterning of the blind gut in the planarian Schmidtea polychroa. Dev Biol. 2011;352:164–76.
39. Guo T, Peters AH, Newmark PA. A Bruno-like gene is required for stem cell maintenance in planarians. Dev Cell. 2006;11:159–69.
41. Wenemoser D, Lapan SW, Wilkinson AW, Bell GW, Reddien PW. A molecular wound response program associated with regeneration initiation in planarians. Genes Dev. 2012;26:988–1002.
42. Skeath JB, Doe CQ. The achaete-scute complex proneural genes contribute to neural precursor specification in the Drosophila CNS. Curr Biol. 1996;6:1146–52.
43. Casarosa S, Fode C, Guillemot F. Mash1 regulates neurogenesis in the ventral telencephalon. Development. 1999;126:525–34.
44. Sommer L, Shah N, Rao M, Anderson DJ. The cellular function of MASH1 in autonomic neurogenesis. Neuron. 1995;15:1245–58.
45. Lapan SW, Reddien PW. dlx and sp6-9 Control optic cup regeneration in a prototypic eye. PLoS Genet. 2011;7:e1002226.
46. Higuchi S, Hayashi T, Tarui H, Nishimura O, Nishimura K, Shibata N, et al. Expression and functional analysis of musashi-like genes in planarian CNS regeneration. Mech Dev. 2008;125:631–45.
47. Eisenhoffer GT, Kang H, Sanchez Alvarado A. Molecular analysis of stem cells and their descendants during cell turnover and regeneration in the planarian Schmidtea mediterranea. Cell Stem Cell. 2008;3:327–39. 48. Picelli S, Faridani OR, Bjorklund AK, Winberg G, Sagasser S, Sandberg R.
Full-length RNA-seq from single cells using Smart-seq2. Nat Protoc. 2014;9:171–81.
49. Team RC. R: A language and environment for statistical computing. Vienna, Austria: R Foundation for Statistical Computing; 2015.
50. Anders S, Huber W. Differential expression analysis for sequence count data. Genome Biol. 2010;11:R106.
51. Gordon Smyth YH, Peter D, Belinda P, Yunshun C. Statmod: statistical modeling. 2015. https://cran.r-project.org/web/packages/statmod/index. html.
52. Sanchez Alvarado A, Newmark PA, Robb SM, Juste R. The Schmidtea mediterranea database as a molecular resource for studying platyhelminthes, stem cells and regeneration. Development. 2002;129:5659–65.
53. Rink JC, Gurley KA, Elliott SA, Sanchez Alvarado A. Planarian Hh signaling regulates regeneration polarity and links Hh pathway evolution to cilia. Science. 2009;326:1406–10.
54. Pearson BJ, Eisenhoffer GT, Gurley KA, Rink JC, Miller DE, Sanchez Alvarado A. Formaldehyde-based whole-mount in situ hybridization method for planarians. Dev Dyn. 2009;238:443–50.
55. Currie K, Brown D, Zhu S, Xu C, Voisin V, Bader G, et al. HOX gene complement and expression in the planarianSchmidtea mediterranea. EvoDevo. 2016;7:7.
• We accept pre-submission inquiries
• Our selector tool helps you to find the most relevant journal
• We provide round the clock customer support
• Convenient online submission
• Thorough peer review
• Inclusion in PubMed and all major indexing services
• Maximum visibility for your research
Submit your manuscript at www.biomedcentral.com/submit


![Fig. 8 Model of planarian stem cell hierarchies. a PCA for predicted pluripotent and lineage-committed groups from the current study and [40].Colored arrows indicate separate lineages](https://thumb-us.123doks.com/thumbv2/123dok_us/8604169.865575/12.595.55.541.86.509/planarian-hierarchies-predicted-pluripotent-committed-indicate-separate-lineages.webp)
