Journal of Chemical and Pharmaceutical Research, 2014, 6(8):177-183
Research Article
CODEN(USA) : JCPRC5
ISSN : 0975-7384
Electrical control system of portable hydraulic meter
Zhigang Di
*, Chunrong Jia and Jingxuan Zhang
College of Electrical Engineering, Hebei United University, Tangshan Hebei, China
_____________________________________________________________________________________________
ABSTRACT
With the development of hydraulic engineering technology, status monitoring technology of hydraulic system is the effective method to ensure hydraulic equipment working reliably. As a result, the effective hydraulic monitoring and fault diagnosis system is urgent to improve the reliability. A novel electronic control system was proposed in this paper. First, STM32F103ZET6 single chip microcomputer was adopted as the core of data processing chip. Second, temperature sensor, pressure sensor, liquid level sensor and pollution sensor suitable for hydraulic circuit were chosen to measure temperature, pressure, liquid level and pollution. Then the voltage signals according to each sensor were collected by AD7656 chip and were converted to digital signal. The data acquisition and signal process of single chip microcomputer were accomplished by software. Finally, data information of control system was displayed on LCD real-time, and the initial value could be set and adjusted by button, to find the fault position of hydraulic system. This portable hydraulic tester can test hydraulic system, according to the measuring data of temperature, pressure, flow, pollution, the fault location could be diagnosed quickly in the hydraulic system, so the hydraulic circuit fault can be solved quickly and efficiently. The portable hydraulic tester for electric control system of the design can meet the needs of the monitoring of hydraulic system.
Key words: Hydraulic meter, sensor, data acquisition, signal process
_____________________________________________________________________________________________
INTRODUCTION
Modern hydraulic equipment is made up of machines, hydraulic system and electronic control system. With the development of technology, especially the update of degree of automation, hydraulic system has been the most important part of automation equipment[1]. As a result, the requirement of working reliability for hydraulic system is higher and higher, and the status monitoring and fault diagnosis are more and more urgent. Hydraulic fault diagnosis mainly to find the true reasons leading to fault, then make clear fault mechanism, so as to eliminate fault, and summarize experiences, provide ground for preventing and eliminating fault. According to the fault characteristics, hydraulic fault diagnosis can carry on with the assistance of any effective methods. With the development of signal process, network and communication technology, and the amalgamation of different subjects, hydraulic fault diagnosis has developed from traditional subjective analysis method to intelligent, network, high precise and so on[2]. At present, there are two methods of hydraulic fault diagnosis, one is virtual testing method which is based on Labview software[3], it analyses the hydraulic system performance approximately. The other is hydraulic meter, which should be connected in measured hydraulic system. This method can only test hydraulic branch or hydraulic component, while for complex hydraulic system, it is impossible to test accurately and quickly.
EXPERIMENTAL SECTION
The hydraulic system design instrument is composed of data acquisition system and data processing system.
Data acquisition system consists of pressure sensors, liquid level sensor, temperature sensor, particle meter sensor and AD data conversion module composition and so on.
A data processing system by the interface circuit, STM32 MCU, LCD display, buttons, etc. The hydraulic tester during working timing acquisition sensor voltage signal and calculate the voltage value, after completion of the calculation results through liquid crystal display. Then after compared with the initial value, find out the hydraulic circuit failure problem, timely treatment, reduce the loss. The system chart was shown in figure 1.
Fig.1: Diagram of hydraulic meter system
The sensor contacts of hydraulic meter were connected in measured hydraulic circuit, hydraulic oil will act on the temperature sensor( T sensor), pressure sensor(P sensor), liquid level sensor(L sensor) and particle meter sensor( Pt sensor), then resulting voltage signals will input into AD7656 chip, and will be converted to digital signals. The digital signals will input into STM32 microcontroller for data processing. Then processed data will be displayed on the LCD. By comparing with standard values which set by buttons, the conclusion can be drawn that the working device of the hydraulic circuit is normal or not, at the same time, the data can be printed. The working flow was shown in figure 2.
Hardware Design
The hardware included single chip microcomputer (SCM), sensors, ADC, filtering circuit, LCD and power circuit. The main modules were shown as following.
1.Single chip microcomputer (SCM) module
In this system, the testing precise was higher, and LCD was adopted to display data real time, the STM32F103ZET6 was adopted as main controller. This chip incorporates the high-performance ARM® Cortex™-M3 32-bit RISC core operating at a 72 MHz frequency, high-speed embedded memories (Flash memory up to 512 Kbytes and SRAM up to 64 Kbytes), and an extensive range of enhanced I/Os and peripherals connected to two APB buses. All devices offer three 12-bit ADCs, four general-purpose 16-bit timers plus two PWM timers, as well as standard and advanced communication interfaces. Because of above characteristics, the adoption of STM32F103ZET6 can reduce the complex level and the amount of peripheral devices to a great extent, the circuit was shown in figure 3.
2.Sensors module
2.1 Temperature sensor
The working temperature range of hydraulic oil is 50 ~ 80 oC, while during measurement, the temperature range is
45 ~ 55 oC, so MSTT temperature sensor was adopted. The power is 20 VDC, output signal is 0 ~ 5 V, measure
range is 0 ~ 100 oC. Besides, this sensor equipped transfer chip to fulfill amplify and linear process, so as to improve
the sensor precise.
2.2Pressure sensor
Pressure sensor adopted NAT-8252, which power is 24 VDC, output signal is 0 ~ 10 V, measure range is 0 ~ 600 bar.
Fig.3: The circuit of main controller
2.3Liquid level sensor
In this system, CR606 digital liquid level sensor was adopted, which is based on radio frequency capacitance measurement principle. This kind of sensor has no any flexible component, it is easy to install and impact resistance. It can be utilized all kind of situations to measure level gasoline, diesel oil and hydraulic oil accurately. Besides, it can be adjusted automatically, has no temperature drift. The measure range is 100 ~ 1400mm, resolution ratio is 0.01mm, output signal can be selected 0 ~ 10 V, power supply is 12 ~ 24 VDC.
2.4 Particle meter sensor
analysis instrument, hydraulic oil pollution status can be displayed real time and online, so as to make maintenance crew intervene the system in early stage to prevent abrasion or destroy. Thus the security of system can be improved and lifetime of system can be prolonged. The working flow is 50 ~ 300mL/min, power supply is 12 ~ 24 VDC, ant
the precision is ±0.5 ISO.
3.ADC module
ADC provides original data for SCM core computation, and transform the filtered voltage into digital signals so as to be identified by SCM. In this system, AD7656 was utilized. It is 16-Bit ADC, and has 6 independent ADCs, true
bipolar analog inputs, fast throughput rate: 250 kSPS, Specified for VCC of 4.5 V to 5.5 V, and it is low power
160mW at 250 kSPS with 5 V supplies. The circuit was shown in figure 4.
Fig.4: ADC circuit of detection system
Software Design
The system utilized µC/OS-II real time operation system, main controller adopted STM32 SCM to receive signals
from AD7656 and display them on LCD, at the same time, the buttons can control the store and display the acquisition data. The main control program flow was shown in figure 5.
Hardware initialization subprogram mainly includes system clock initialization, IO port initialization, LCD module initialization, ADC initialization and USART initialization, the flow chart was shown in figure 6.
Fig.6: The flow chart of hardware initialization subprogram
Operation system initialization subprogram need create a start task, and then this task will create all particular tasks, including data acquisition, data display and indicator light task. The flow chart of operation system initialization subprogram was shown as figure 7.
Fig. 7: The flow chart of operation system initialization subprogram
Fig. 8: The flow chart of data acquisition subprogram
RESULTS AND DISCUSSION
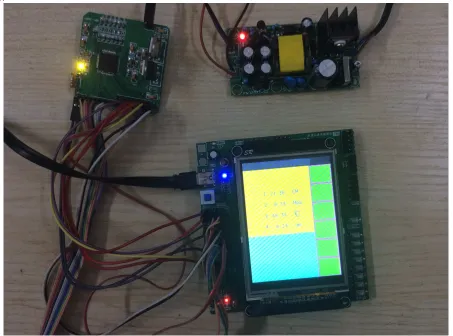
In order to ensure the practicability of designed detection system, the experiments were carried on, the whole control system was shown in figure 9, and the result of data acquisition, data storage and data display were shown in figure 10.
a.data acquisition b. data storage c. data display Fig.10: The result of hydraulic meter
In figure 10, 1 refers to flux, 2 refers to hydraulic pressure, 3 refers to oil temperature and 4 refers to pollution level.
CONCLUSION
This article elaborated the electronic control system of hydraulic meter. From the experiment results, this system can be utilized to detect hydraulic faults. This system can reduce the loss of hydraulic system, and improve the production efficiency.
Acknowledgments
This research was supported in part by scientific research fund of Hebei provincial education department (ZD2013102); Doctor Scientific Research Foundation of Hebei United University.
REFERENCES
[1]Liu Xuexia, Journal of Electrical Engineering, 2012,10(8), 2041-2046.
[2]WU Dinghai, ZHANG Pei-lin, FU Jian-ping, WANG Cheng, Chinese Hydraulics & Pneumatics, 2007, (7),
79-82.
[3]Yi Jin, Xi Xia Liu, Wei Ping Liu, Advanced Materials Research, 2012,458(1),257-260.
[4]HU Zengrong, Hydraulics Pneumatics & Seals, 2011, 31(8), 38-43.