International Journal of Emerging Technology and Advanced Engineering
Website: www.ijetae.com (ISSN 2250-2459,ISO 9001:2008 Certified Journal, Volume 3, Issue 7, July 2013)
350
Clustering Algorithm for Temporal Data Mining: An Overview
Y Leela Sandhya Rani
1, P Naga Deepthi
2, Ch Rama Devi
31,2,3Assistant Professor ,CSE Department,Sir C R R Colllege of Engineering, Eluru, W G Dt, Andhra Pradesh, India.
Abstract— Temporal data mining is the extraction of knowledge from huge amounts of complex temporal database. Most research in this area has focused on efficient clustering algorithm for temporal database to analyze the complexity. In this paper we present clustering algorithms for temporal data mining that extends the current temporal data mining algorithms to efficiently support for dynamically extracting temporal data.
Keywords— Data Mining, K-means, Temporal database Temporal data Mining, Time series.
I. INTRODUCTION
Data Mining, also popularly known as Knowledge Discovery in Databases (KDD), refers to the nontrivial extraction of implicit, previously unknown and potentially useful information from data in databases. While data mining and knowledge discovery in databases (or KDD) are frequently treated as synonyms, data mining is actually part of the knowledge discovery process. The goal is to find interesting patterns, that is, patterns that are valid, novel, useful, and understandable.
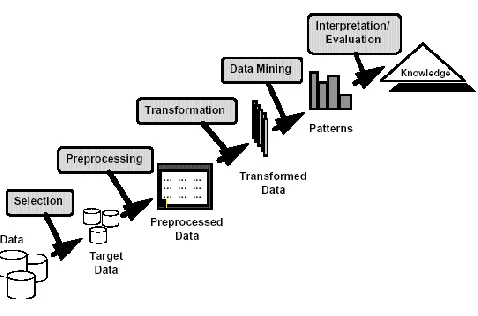
The Knowledge Discovery in Databases process comprises of a few steps leading from raw data collections to some form of new knowledge[1]. The iterative process consists of the following steps(Fig 1.1):
Data cleaning: also known as data cleansing, it is a
phase in which noise data and irrelevant data are removed from the collection.
Data integration: at this stage, multiple data sources,
often heterogeneous, may be combined in a common source.
Data selection:at this step, the data relevant to the
analysis is decided on and retrieved from the data collection.
Data transformation: also known as data
consolidation, it is a phase in which the selected data is transformed into forms appropriate for the mining procedure.
Data mining:it is the crucial step in which clever
techniques are applied to extract patterns potentially useful.
Pattern evaluation:in this step, strictly interesting
patterns representing knowledge are identified based on given measures.
Knowledge representation: is the final phase in which
[image:1.612.330.569.260.418.2]the discovered knowledge is visually represented to the user. This essential step uses visualization techniques to help users understand and interpret the data mining results.
Fig 1.1 Knowledge discovery
Data mining is a relatively new technology that has not fully matured. Despite this, there are a number of industries that are already using it on a regular basis. Some of these organizations include retail stores, hospitals, banks, and insurance companies. Many of these organizations are combining data mining with such things as statistics, pattern recognition, and other important tools. Data mining can be used to find patterns and connections that would otherwise be difficult to find. This technology is popular with many businesses because it allows them to learn more about their customers and their relationships. There are a number of applications that data mining has.
With market segmentation, you will be able to find behaviors that are common among your customers. You can look for patterns among customers that seem to purchase the same products at the same time. By using data mining a retail store may be able to
International Journal of Emerging Technology and Advanced Engineering
Website: www.ijetae.com (ISSN 2250-2459,ISO 9001:2008 Certified Journal, Volume 3, Issue 7, July 2013)
351
One industry that can be created by data mining is the automatic prediction of both behaviors and trends. Imagine for a moment that you were the owner of a fashion company, and you were able to precisely predict the next big fashion trend based on the behavior and shopping patterns of your customers. Data mining can allow you to become better at what
you do. It is also a powerful tool for those who deal with finances. A financial institution such as a bank can predict the number of defaults that will occur among their customers within given period of time.
II. BACK GROUND STUDY
The kinds of patterns that can be discovered depend upon the data mining tasks employed. By and large, there are two types of data mining tasks: descriptive data
mining tasks that describe the general properties of the
existing data, and predictive data mining tasks that attempt to do predictions based on inference on available data [4]. The data mining functionalities and the variety of knowledge they discover are briefly presented in the following list:
Characterization: Data characterization is a
summarization of general features of objects in a target class, and produces what is calledcharacteristic
rules. The data relevant to a user-specified class are
normally retrieved by a database query and run through a summarization module to extract the essence of the data at different levels of abstractions.
Discrimination: Data discrimination produces what
are calleddiscriminant rulesand is basically the comparison of the general features of objects between two classes referred to as thetarget classand the
contrasting class. For example, one may want to
compare the general characteristics of the customers who rented more than 30 movies in the last year with those whose rental account is lower than 5.
Association analysis: Association analysis is the
discovery of what are commonly called association
rules. It studies the frequency of items occurring
together in transactional databases, and based on a threshold called support, identifies the frequent item sets. Another threshold, confidence, which is the conditional probability than an item appears in a transaction when another item appears, is used to pinpoint association rules. Association analysis is commonly used for market basket analysis.
Classification: Classification analysis is the
organization of data in given classes. Also known
assupervised classification, the classification uses
given class labels to order the objects in the data collection. Classification approaches normally use
atraining setwhere all objects are already associated
with known class labels. The classification algorithm learns from the training set and builds a model. The model is used to classify new objects.
Prediction: Prediction has attracted considerable
attention given the potential implications of successful forecasting in a business context. There are two major types of predictions: one can either try to predict some unavailable data values or pending trends, or predict a class label for some data. The latter is tied to classification. Once a classification model is built based on a training set, the class label of an object can be foreseen based on the attribute values of the object and the attribute values of the classes. Prediction is however more often referred to the forecast of missing numerical values, or increase/ decrease trends in time related data.The major idea is to use a large number of past values to consider probable future values.
Clustering: Similar to classification, clustering is the
organization of data in classes. However, unlike classification, in clustering, class labels are unknown and it is up to the clustering algorithm to discover
acceptable classes. Clustering is also
calledunsupervised classification, because the
classification is not dictated by given class labels. There are many clustering approaches all based on the principle of maximizing the similarity between objects in a same class (intra-class similarity) and minimizing the similarity between objects of different classes (inter-class similarity).
Outlier analysis: Outliers are data elements that
cannot be grouped in a given class or cluster. Also known asexceptionsorsurprises, they are often very important to identify. While outliers can be considered noise and discarded in some applications, they can reveal important knowledge in other domains, and thus can be very significant and their analysis valuable.
International Journal of Emerging Technology and Advanced Engineering
Website: www.ijetae.com (ISSN 2250-2459,ISO 9001:2008 Certified Journal, Volume 3, Issue 7, July 2013)
352
III. TEMPORAL DATA MINING
Temporal data mining is concerned with data mining of
large sequential data sets. For example, time series constitute a popular class of sequential data, where records are indexed by time. Other examples of sequential data could be linear regression, statistical language, gene
sequences, protein-sequences, signal-processing,
econometrics, weather forecasting, prediction, stock
market data, and logged activities [3].
Time-Series Databases contain time related data such
stock market data or logged activities. These databases usually have a continuous flow of new data coming in, which sometimes causes the need for a challenging real time analysis. Data mining in such databases commonly includes the study of trends and correlations between evolutions of different variables, as well as the prediction of trends and movements of the variables in time.
The main difference between classical time series analysis and temporal data mining lies in the size and nature of data sets and the manner in which the data is collected, and the second major difference lies in the kind of information that we want to estimate from the data[5],[6].
A. Temporal Data Mining Methods
Temporal data mining has to perform several methods which are specified below [7]
1. Temporal Knowledge Discovery
2. Clustering Methods 3. Temporal Association rules
4. Sequence Mining
B. Applications
There are so many number of applications are there some of them are
Wether Forecasting
Stock market data analysis
Web logged data analysis
Econometrics
Medical and DNA data analysis
Mathematical analysis
C. Clustering methods
The collection of clusters is known as clustering. There are various types of clustering they are as follows
1. Hierarchical Methods [8]
Agglomerative Algorithm
Divisive Algorithm
2. Partitioning Methods [9]
Nearest Neighbor Algorithm
Density Based Algorithm
K-Medoids Methods
K-Mean Methods
3. Grid Based Methods
4. Methods Based on Co-occurrence of categorical Data. 5. Density Based methods
IV. IMPROVED K-MEANS ALGORITHM
Data mining techniques have been widely used in various applications. One of the most important data mining applications is k-means algorithm, introduced by J.B.Mac Queen in 1967 and is one of the simplest unsupervised learning algorithms that solve the well known clustering problem. Efficient k-means computation is crucial in many practical applications such as clustering, facility location planning and spatial decision-making.
Given a data set P={p1, p2, . . . , pn }of 2D points, a
k-means query returns a center set M of k points {m1,m2, . .
.,mk}, such that cost(M)=∑ni=1dist2(pi,NN(pi,M)) is
minimized. Where for all i satisfying 1≤ i ≤ n, NN(pi,M ) is
the nearest neighbor of pi in M, and dist is a distance (usually, Euclidean) metric. The data points whose NN is mj ƐM (1≤ j≤ k) form the cluster of mj.[2] Since the
problem is NP-hard [10], several approximate algorithms have been proposed and used in practice.
The inputs to the algorithm are dataset (from temporal data base) and number of clusters to form. Let us take K as the number of total clusters we take K rows from the dataset.
For Example, if there are 10,000 rows of data in the dataset and 3 clusters need to be formed, then the first K=4 initial clusters will be created by selecting 4 records randomly from the dataset as the initial clusters [11, 12]. Each of the 4 initial clusters formed will have just one row of data. And this first row will be taken as centre for the remaining data to be verified.
A. Procedure for K-means Algorithm
Step 1: Choose K random data sets as a initial group of
clusters.
Step 2: For point p in the dataset assign to the cluster which
has nearest center
Step 3: Recalculate the positions of the centers
Step 4: If the positions of the centers didn't change
go to the next step,
Else go to Step 2.
International Journal of Emerging Technology and Advanced Engineering
Website: www.ijetae.com (ISSN 2250-2459,ISO 9001:2008 Certified Journal, Volume 3, Issue 7, July 2013)
353 B. Working
The K-Means algorithm calculates the Arithmetic Mean of each cluster formed in the dataset. The Arithmetic Mean of a cluster is the mean of all the individual records in the cluster. In each of the first K initial clusters, there is only one record. The Arithmetic Mean of a cluster with one record is the set of values that make up that record.
For Example if the dataset we are discussing is a set of Salary, Commission of an employee in an organization, where a record P in the dataset S is represented by
P = {Salary, Commission).
Then a salary record of an employee X = {2000, 170} Since there is only one record in each initial cluster then the Arithmetic Mean of a cluster with only the record is {2000,170}.
Next, Each record is assigned to the nearest cluster (the cluster which it is most similar to) using a measure of distance or similarity like the Euclidean Distance Measure. We have to re-assigns each record in the dataset to the most similar cluster and re-calculate the arithmetic mean of all the clusters in the dataset. The arithmetic mean of a cluster is the arithmetic mean of all the records in that cluster.
For Example, if a cluster contains two records where the record of the set of measurements for
X = {2000, 170} and Y = {3000, 200},
Then the arithmetic mean Pmean is represented as P mean = {Salary mean, Commission mean).
The arithmetic mean of this cluster = {(2000+3000)/2, (170+200)/2}.
Now the new arithmetic mean (2500,185) becomes the center of this new cluster. Following the same procedure, new cluster centers are formed for all the existing clusters. It K-Means re-assigns each record in the dataset to only one of the new clusters formed. The preceding steps are repeated until stable clusters are formed and the K-Means clustering procedure is completed. Stable clusters are formed when new iterations or repetitions of the K-Means clustering algorithm does not create new clusters as the cluster center or Arithmetic Mean of each cluster formed is the same as the old cluster center. There are different techniques for determining when a stable cluster is formed or when the k-means clustering algorithm procedure is completed.
B. Computational complexity
NP-hard in general Euclidean space d even for 2 clusters. NP-hard for a general number of clusters k even in the plane.
If k and d are fixed, the problem can be exactly solved in time O (n dk+1 log n), where n is the number of entities to be clustered.
It has some of the advantages are relatively efficient: O (tkn), where n is the number of instances, c is the number of clusters, and t is the number of iterations. Normally, k, t << n. Often terminates at a local optimum. The global optimum may be found using techniques such as: simulated annealing or genetic algorithms
Also have some disadvantages it’s applicable only when mean is defined.
Need to specify c, the number of clusters, in advance. Unable to handle noisy data and outliers.
Not suitable to discover clusters with non-convex shapes
V. CONCLUSION
Temporal data mining is a very fast expanding field with many new research results reported and many new temporal data mining analysis methods or prototypes developed recently. In this report we have provided an overview of the temporal data mining process and some background to Temporal Data Mining. Also we discussed a a general analysis theory of temporal data mining and provided an enhanced clustering algorithm on temporal data and complexity.
This work is motivated us to extend the proposed techniques to related problems. For instance, k-medoids are similar to k-means, but the centers are restricted to points in the data set. Another direction concerns distributed monitoring of k-means over temporal data.
REFERENCES
[1] Marek Maurizio―Data Mining Tecniques and concepts‖ 2011 [2] K. Alsabti, S. Ranka, and V. Singh, ªAn Efficient k-means
Clustering Algorithm,º Proc. First Workshop High Performance Data Mining, Mar. 1998.
[3] ―Temporal Data Mining: an overview‖ Claudia M. Antunes and Arlindo L. Oliveira
[4] M. S. Chen, J. Han, and P.S.Yu. Data Mining: An Overwiew from a Database Perspective. IEEE Transcations on Knowledge and Data Engineering, 8(6):883, 1996.
International Journal of Emerging Technology and Advanced Engineering
Website: www.ijetae.com (ISSN 2250-2459,ISO 9001:2008 Certified Journal, Volume 3, Issue 7, July 2013)
354 [6] Srivatsan Laxman and P S Sastry―A survey of temporal data mining‖
Sadhana Vol. 31, Part 2, April 2006, pp. 173–198.
[7] John F. Roddick and Myra Spiliopoulou ―A Survey of Temporal Knowledge Discovery Paradigms and Methods " vol. 14, no. 4, Aug 2002
[8] G.Karypis, E-H. Han and V. Kumar, ―CHAMELEON: A Hierarchical Clustering Algorithm Using Dynamic Modeling,‖ Computer, vol. 32, no. 8, pp 68-75, Aug. 1999
[9] L. Kaufman and P.J. Rousseeuw, Finding Groups in Data: an Introduction to Cluster analysis. John Wiley &Sons, 1990
[10] M. Meila, ―The Uniqueness of a Good Optimum for k-Means,‖ Proc. 23rd Int’l Conf. Machine Learning (ICML), 2006
[11] G. Milligan and M. Cooper, ―An Examination of Procedures for Determining the Number of Clusters in a Data Set,‖Psychometrika, vol. 50, pp. 159–179, 1985