Journal of Chemical and Pharmaceutical Research, 2015, 7(5):392-397
Research Article
CODEN(USA) : JCPRC5
ISSN : 0975-7384
Ontology sparse algorithms via dual program and applied to biology and
chemical sciences
Wei Gao
1, Li Yan
2and Yun Gao
31
School of Information Science and Technology, Yunnan Normal University, Kunming, China
2
School of Engineer, Honghe University, Mengzi, China
3
Department of Editorial, Yunnan Normal University, Kunming, China
_____________________________________________________________________________________________
ABSTRACT
Ontology similarity calculation is important research topics in information retrieval and widely used in science and engineering. In this paper, we consider the ontology applications on biology and chemical sciences. The new ontology sparse vector learning algorithm is obtained via dual program computation, and the new algorithm is applied to ontology similarity measure and ontology mapping. Via the ontology sparse vector learning, the ontology graph is mapped into a line consists of real numbers. The similarity between two concepts then can be measured by comparing the difference between their corresponding real numbers. The experiment results show that the proposed new algorithm has high accuracy and efficiency on ontology similarity calculation and ontology mapping.
Keywords: Ontology, Similarity Measure, Ontology Mapping, Sparse Vector, Dual program
_____________________________________________________________________________________________
INTRODUCTION
As a conceptual shared and knowledge representation model, ontology has been used in knowledge management, image retrieval and information retrieval search extension. Furthermore, acted as an effective concept semantic model, ontology is employed in other fields except computer science, including medical science, social science, pharmacology science, geography science and biology science(see Przydzial et al., [1], Koehler et al., [2], Ivanovic and Budimac [3], Hristoskova et al., [4], and Kabir et al., [5] for more detail).
The ontology model is a graph G=(V,E) such that each vertex v expresses a concept and each directed edge e=vivjdenote a relationship between concepts vi and vj. The aim of ontology similarity measure is to get a similarity
function Sim: V×V
→
{0} such that each pair of vertices is mapped to a non-negative real number. Moreover, the aim of ontology mapping is to obtain the link between two or more ontologies. In more applications, the keyof ontology mapping is to get a similarity function S to determine the similarity between vertices from different ontologies.In recent years, ontology similarity-based technologies were employed in many applications. By virtue of technology for stable semantic measurement, a graph derivation representation based trick for stable semantic measurement is presented by Ma et al., [6]. Li et al., [7] determined an ontology representation method which can be used in online shopping customer knowledge with enterprise information. A creative ontology matching system is proposed by Santodomingo et al., [8] such that the complex correspondences are deduced by processing expert knowledge with external domain ontologies and in view of novel matching technologies. The main features of the food ontology and several examples of application for traceability aims were reported by Pizzuti et al., [9]. Lasierra et al., [10]pointed out that ontologies can be employed in designing architecture for taking care of patients at home. More ontology learning algorithms can refer to [11-22].
In this paper, we present the new ontology similarity computation and ontology mapping algorithms relied on the ontology sparse vector learning, and the learning algorithm is given by dual program. In terms of the sparse vector, the ontology graph is mapped into a real line and vertices are mapped into real numbers. Then the similarity between vertices is measured by the difference between their corresponding real numbers. At last, this new algorithm is employed in biology and chemical science. Two experiments are designed to test its effectiveness on ontology similarity measuring and ontology mapping.
2. Basic Idea
Let V be an instance space. For any vertex in ontology graph G, its information (including its attribute, instance, structure, name and semantic information of the concept which is corresponding to the vertex and that is contained in its vector)is denoted by a vector with p dimension. Let v={ ,v1L,vp} be a vector which is corresponding to a vertex v.
For facilitating the expression, we slightly confuse the notations and denote v both the ontology vertex and its corresponding vector. The purpose of ontology learning algorithms is to get an optimal ontology function f: V
→
, then the similarity between two vertices is determined by the difference between two real numbers which they correspond to. The essence of such algorithm is dimensionality reduction, that is to say, use one dimension vector to represent p dimension vector. From this point of view, an ontology function f can be regarded as a dimensionality reduction map f: p→
.
3. Main Ontology Algorithms
In this section, we present our main ontology sparse vector learning algorithms for ontology similarity measuring and ontology mapping by virtue of graph-constrained elastic-net. .
In the real implement, the sparse ontology function can be denoted as
( ) fβ v =
1 p i i i vβ =
∑
, (1)where
β
=(β1,L,βp) is a sparse vector. For determining the ontology function f, we should get the sparse vectorβ
first.The simplest model to learn the ontology sparse vector can be denoted as
ˆ
β
= 22 1
1 arg min
2 y V
β − β +λ β , (2)
where V is information matrix, y is the target vector and λ
∈
+ is a balance parameter. More general, this problemcan be expressed as
ˆ
β
= 22 1
1 arg min
2 y V D
β − β +λ β , (3)
where D
∈
m p× is a penalty matrix.For a general ontology information matrix V, we deduce the dual of (3) as:
1
min imize (
) (
) (
)
2
m
T T T T T T
u
V y
D u
V V
+V y
D u
∈
−
−
(4)s.t.
u
∞≤
λ
,D u
T∈
row( )
V
.In this paper, we consider the ontology problem (3). Our strategy is to sole the equivalent dual problem (4). The relationship between the primal and dual solutions is
ˆ
λ
β
=(
V V
T) (
+V y
T−
D u
Tˆ
λ)
+
b
, (5)Define
y
%
=VV y
+ andD
%
=DV
+. (6)Here the pseudoinverse of a rectangular matrix A is
A
+=(
A A A
T)
+ T. Abbreviating P =P
col(V) =VV
+, the objectivefunction in (4) becomes
(
V y
T−
D u
T) (
TV V
T) (
+V y
T−
D u
T)
=(
y
%
−
Du
%
) (
Ty
%
−
Du
%
)
.Therefore we can rewrite the dual problem (4) in terms of our transformed data and penalty matrix:
2
2
1
min imize
2
m
T
u
y
D u
∈
%
−
%
(7)s.t.
u
∞≤
λ
,D u
T∈
row( )
V
.It is also helpful to rewrite the relationship (5) in terms of our new data and penalty matrix:
ˆ
λ
β
=V
+(
y
%
−
D u
%
T%
)
+
b
, (8)where b
∈
null(V), which implies that the fit is simplyˆ
V
β
λ=y
%
−
D u
%
T%
. (9)Hence, the dual problem of (3) is
2
2
1
min imize
2
m
T
u
y
D u
∈
−
(10)s.t.
u
∞≤
λ
.Thus, we can see that (10) has a nice constraint set,
{ :
u u
∞≤
λ
}
, which is simply a box, free of any lineartransformation. From this point of view, the given ontology optimal problem can be implemented by standard convex optimization method.
4. Experiments
Two simulation experiments on ontology similarity measure and ontology mapping are designed in this section. For detail implement, we first obtain the optimal sparse vector using the algorithm raised in our paper, and then the ontology function is yielded by (1).
4.1.Experiment on Biology Data
The “Go” ontology O1 was constructed byhttp: //www. geneontology. org. (Fig. 1 presents the graph structure of O1).
We use P@N (defined by Craswell and Hawking [23]) to determine the equality of the experiment result.
Figure 1. “Go” ontology.
Table 1. The experiment data for ontology similarity measure
P@3 average precision ratio
P@5 average precision ratio
P@10 average precision ratio
P@20 average precision ratio
Our Algorithm 4714% 54.34% 66.01% 84.13% Algorithmin [12] 46.38% 53.48% 62.34% 74.59% Algorithm in [13] 43.56% 49.38% 56.47% 71.94% Algorithm in [14] 42.13% 51.83% 60.19% 72.39%
As we can see in the Figure 1, when N= 3, 5, 10 or 20, the precision ratio in view of our algorithm is higher than that got by tricks which has been determined in Huang et al., [12], Gao and Liang [13] and Gao and Gao [14].
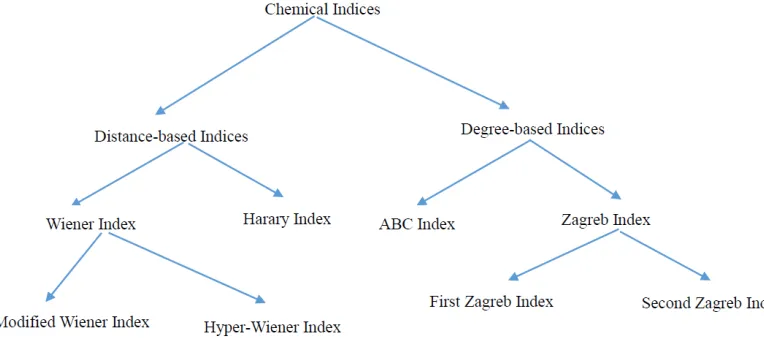
4.2.Experiment on Chemical Data
For our second experiment, we use “Chemical Index” ontologies O2 and O3 (part of the graph structures of O2 and O3
are presented in Fig. 2 and Fig. 3 respectively). Note that the Figure 2 and Figure 3 only show the part of vertices on O2
and O3. Actually, the number of vertex on O2 is 24, and the number of vertex on O3 is 17. The purpose of this
experiment is to construct the ontology mapping between O2 and O3. Again, P@N criterion is applied to measure the
equality of the experiment results.
Furthermore, ontology technologies in Wang et al., [11], Huang et al., [12], and Gao and Liang [13]are employed to “Chemical Index” ontology. At last, we compare the precision ratio that we have obtained from four tricks. Table 2 present several results for this experiment.
[image:4.595.109.491.521.690.2]Figure 3. “Chemical Index” Ontology O3.
Table 2. The experiment data for ontology mapping
P@1 average precision ratio
P@3 average precision ratio
P@5 average precision ratio
Our Algorithm 48.78% 60.16% 80.49% Algorithm in [11] 46.34% 56.10% 68.29% Algorithm in [12] 36.59% 47.97% 58.54% Algorithm in [13] 46.34% 56.91% 73.66%
From what we have obtained in Table 2, we find it more efficient to use our Algorithm than algorithms determined by Wang et al., [11], Huang et al., [12], and Gao and Liang [13], especially where N is sufficiently large.
CONCLUSION
In our article, a new algorithm for ontology similarity measure and ontology mapping application is presented by virtue of dual program. Furthermore, experiment results reveal that our new algorithm has high efficiency in both biology and chemical applications. The ontology algorithm presented in our paper illustrates the promising application prospects for ontology use.
Acknowledgment
We thank the reviewers for their constructive comments in improving the quality of this paper. The research is financed by: NSFC (No.11401519), and the PhD initial funding of the first author.
REFERENCES
[1] J. M. Przydzial, B.Bhhatarai,A. Koleti, Bioinformatics, 2013, 29(24),3211-3219.
[2] S.Koehler, S. C.Doelken, C. J. Mungall, Nucleic Acids Research, 2014, 42(D1),966-974. [3] M.Ivanovic,Z. Budimac, Expert Systerms and Applications, 2014, 41(11),5158-15166. [4] A.Hristoskova, V.Sakkalis, and G.Zacharioudakis,Sensors, 2014, 14(1),1598-1628. [5] M. A.Kabir, J.Han, J.Yu,.Personal and Ubiquitous Computing, 2014, 18(3), 1061-1083.
[6]Y. L.Ma, L.Liu,K.Lu, B. H.Jin, X. J.Liu, IEEE Transactions onKnowledge and Data Engineering, 2014, 26(3), 1039-1052.
[7] Z.Li, H. S.Guo, Y. S.Yuan, L. B. Sun, Applied Mechanics and Materials, 2014, 483,603-606.
[8] R.Santodomingo, S.,Rohjans, M.Uslar, J. A.Rodriguez-Mondejar, M.A.Sanz-Bobi,Engineering Applicationsof Artificial Intelligence, 2014, 32, 242-257.
[9] T.Pizzuti,G.Mirabelli, M. A.Sanz-Bobi, F.Gomez-Gonzalez,Journal of Food Engineering, 2014, 120(1), 17-30. [10] N.Lasierra, A.Alesanco,J.Garcia, IEEE Journal of Biomedical and Health Informatics, 2014, 18(3),896-906. [11] Y. Y. Wang, W.Gao, Y. G. Zhang, Y. Gao, The 3rd International Conference on Computational Intelligence and Industrial Application,Wuhan, China, 2010, 20-22.
[12] X.Huang,T. W. Xu, W. Gao, Z. Y. Jia,International Journal of Applied Physics and Mathematics,2011, 1,54-59. [13] W.Gao, L.Liang,Future Communication, Computing, Control and Management,2011, 142, 415-421.
[14] Y.Gao,W.Gao, International Journal of Machine Learning and Computing,2012, 2(2),107-112.
science and Information technology, Chengdu, China, 2011, pp. 571-574.
[16] W.Gao, Y. Gao, L.Liang, Journal of Chemical and Pharmaceutical Research, 2013, 5(9),592-598. [17] W. Gao, L. Shi, BioTechnology: An Indian Journal,2013, 8(11), 1572-1577.
[18] W. Gao, T. W. Xu, Energy Education Science and Technology Part A: Energy Science and Research, 2014, 32(3), 3793-3806.
[19] W.Gao,Y.Gao, Y. G. Zhang, Information,2012, 15(11A), 4585-4590.
[20] W.Gao, T. W.Xu, Abstract and Applied Analysis,2013, 9 pages, http://dx.doi.org/10.1155/2013/174802.
[21] W. Gao,L. L. Zhu, Computational Intelligence and Neuroscience,2014, 12 pages, http://dx.doi.org/10.1155/2014/438291.