Evaluation of Surface Roughness and Material Removal
Rate in End Milling of Complex Shape
Suha K. Shihab
1,*, Ethar Mohamed Mahdi Mubarak
21Department of Materials Engineering, Engineering College, Diyala University, Iraq 2Mechanical Department, Institute of Technology, Middle Technical University, Iraq
Copyright©2016 by authors, all rights reserved. Authors agree that this article remains permanently open access under the terms of the Creative Commons Attribution License 4.0 International License
Abstract In this work, an attempt has been made to
analyze the influence of various machining input parameters of CNC end milling process viz. cutting speed, feed rate and depth of cut on machining output variables (surface roughness and material removal rate) during machining complex shape of copper. Three different levels of input parameters were planned as per Taguchi’s L9 orthogonalarray. The parameters are optimised from analysis of mean (ANOM). Analysis of variance (ANOVA) was employed to investigate the effect of machining parameters on the variables. Results of this study indicate that the depth of cut has the most significant effect on Ra having percentage
contribution of 71.06% followed by feed rate and cutting speed having percentage contribution of 23.22% and 2.12% respectively. For material removal rate, it is observed that the percentage contribution of feed rate is maximum i.e. 68.58% followed by depth of cut and cutting speed having percentage contribution of 22.13% and 7.52% respectively. Also, the results revealed that optimum combination of machining parameters which resulted in optimum value of the surface roughness is A3B1C2 i.e. cutting speed of 6000
rpm, feed rate of 500 mm/tooth and depth of Cut of 0.06 mm. Similarly, optimum combination of machining parameters which resulted in optimum value of material removal rate is A1,B3C3 where the values for cutting speed, feed rate and
depth of cut are 2000 rpm, 1500 mm/tooth and 0.08 mm respectively.
Keywords
End Milling, Surface Roughness, Material Removal Rate, Copper, Optimization1. Introduction
Surface roughness and material removal rate are two important aspects during machining which involve attention both from manufacturing as well as research and development point of view. In recent industry, one of the tendencies is to produce low cost, high quality products in short time [1]. The roughness of the machined surface is considered as the important aspect affecting on the quality of the product, function, and reliability [2-5]. On the other hand,
the material removal rate is another important aspect in improving machining performance, effecting on the productivity and reduced lead times and cost [6]. It is very difficult for an operator to select optimum machining parameters to achieve best surface finish and higher productivity. Therefore, many researchers have focused on the effect of machining parameters and selection the optimum values of these parameters to determine best surface finish and highest value of material removal rate [1, 7].In this research an attempt has been made to produce complex shapes using vertical milling operation through end milling process. The specific objectives of the study are: to understand milling machine and various milling operations; to investigate the effect of various machining parameters on surface roughness and material removal rate; and to optimize the machining parameters. Experiments have been carried out according to Taguchi's L9 orthogonal array (OA) on a
CNC vertical milling machine. The details of the procedure are discussed in the following sections.
2. Materials
Table 1. Chemical composition of copper
Elements Copper Tin Lead Iron Nickel Manganese Cobalt Silver Phosphorus Zinc
Composition % 99.90 0.024 0.004 0.002 0.002 < 0.001 < 0.001 0.001 0.040 0.017
3. Experimental Method
From a bar, copper cube of 80 mm was cut by power hacksaw and face milling was carried out on vertical CNC milling machine using face milling cutter. Then, the experiments were carried out on vertical CNC milling machine by using different machining parameters of L9
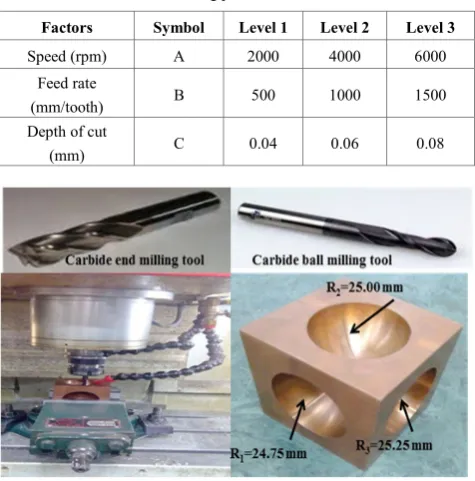
orthogonal array. The machining parameters and their levels used in present study as shown in Table 2. Nine hemispherical shapes (Complex Shape geometry) were formed on nine faces of two cubes, 6 hemispheres on 6 faces of one cube and 3 on the other cube, using end milling cutter and for better surface finish, ball milling cutter of 8 mm was used. Each hemisphere has three different Radii (24.75 mm, 25 mm and 25.25 mm) as shown in the Figure 1. Surface roughness values were measured by surface roughness tester (SURTEST SV-2100; make: Mitutoyo, Japan). During machining, the material removal rate was calculated against recorded “time of cut”.
Table 2. Machining parameters and their levels
Factors Symbol Level 1 Level 2 Level 3
Speed (rpm) A 2000 4000 6000 Feed rate
(mm/tooth) B 500 1000 1500 Depth of cut
(mm) C 0.04 0.06 0.08
Figure 1. milling operation of copper cube
4. Taguchi Design of Experiment
In this study, experiments based on Taguchi L9 orthogonal
array were performed to determine the best levels of the process parameters. The greatest advantages of the Taguchi method are to decrease the experimental time, to reduce the cost and to find out significant factors in a shorter time
period [9, 10]. Taguchi used the S/N ratio as the quality characteristic of choice to analyze the data [11-13]. The methods for calculating the S/ N ratio are classified into three main categories, depending on whether the desired quality characteristics are smaller the better, larger the better or nominal the better. In the case of surface roughness, the smaller values are always considered and in case of material removal rate, the larger values are always considered. The Eq.1 and Eq.2 were applied for calculating the S/N ratio for smaller the better characteristics and larger the better characteristics respectively.
∑
=−
=
mi ij
y
n
12
1
log
10
N
S
(1)∑
=−
=
mi
y
ijn
1 21
1
log
10
N
S
(2)5. Results and Discussion
In this section, an ANOVA is conducted to analyze the experimental results and identify statistically significant trends in the surface roughness and material removal rate data.
5.1. Analysis for Surface Roughness
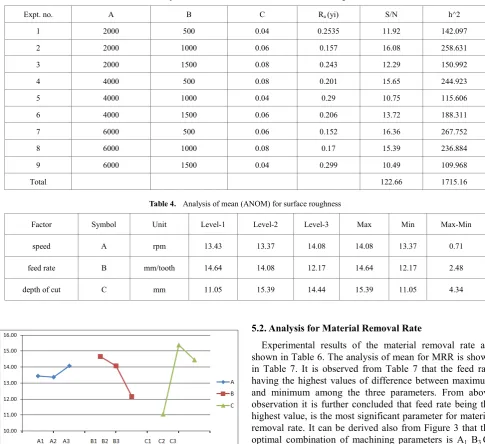
Table 3 shows the experimental results and corresponding S/N ratio for surface roughness (Ra) using
the relation for lower the better. Table 4 shows the analysis of mean (ANOM) for surface roughness. From Table 3, it is observed that optimized level for surface roughness is A3 B1
and C2. Moreover, the depth of cut (C) having the largest
values of difference between maximum and minimum values among the three parameters. The main effects plots for surface roughness were constructed. As may be observed also from Figure 2 that the optimal combination of machining parameters is A3 B1 C2 i.e. the minimum value of
surface roughness is obtained at speed of 6000 rpm, feed rate of 500 mm/tooth and depth of cut of 0.06 mm. ANOVA results for surface roughness are given in Table 5 . From Table 5 it can be noticed that the depth of cut has maximum influence on the Ra with the contribution 71.60%,
[image:2.595.59.297.389.630.2]Table 3. Experimetal results and S/N ratios values for surface roughness
Expt. no. A B C Ra (yi) S/N h^2
1 2000 500 0.04 0.2535 11.92 142.097
2 2000 1000 0.06 0.157 16.08 258.631
3 2000 1500 0.08 0.243 12.29 150.992
4 4000 500 0.08 0.201 15.65 244.923
5 4000 1000 0.04 0.29 10.75 115.606
6 4000 1500 0.06 0.206 13.72 188.311
7 6000 500 0.06 0.152 16.36 267.752
8 6000 1000 0.08 0.17 15.39 236.884
9 6000 1500 0.04 0.299 10.49 109.968
Total 122.66 1715.16
Table 4. Analysis of mean (ANOM) for surface roughness
Factor Symbol Unit Level-1 Level-2 Level-3 Max Min Max-Min
speed A rpm 13.43 13.37 14.08 14.08 13.37 0.71
feed rate B mm/tooth 14.64 14.08 12.17 14.64 12.17 2.48
depth of cut C mm 11.05 15.39 14.44 15.39 11.05 4.34
Figure 2. The main effect plot for S/N ratio for Surface Roughness
Table 5. ANOVA results for surface roughness.
Source Sum of sequence DF Mean square F ratio % Contribution A 0.92 2 0.46 0.69 2.12 B 10.11 2 5.06 7.59 23.22 C 31.19 2 15.60 23.41 71.60 Error 1.33 2 0.67 3.06
Total 43.56 8 100.00
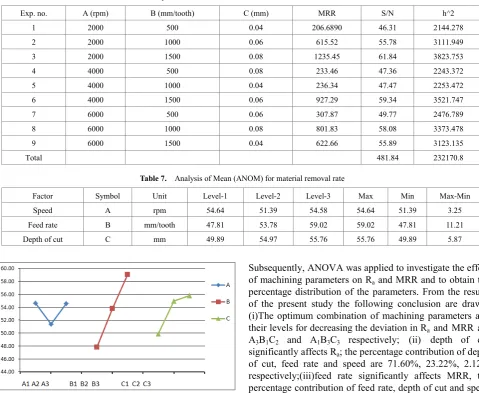
5.2. Analysis for Material Removal Rate
Experimental results of the material removal rate are shown in Table 6. The analysis of mean for MRR is shown in Table 7. It is observed from Table 7 that the feed rate having the highest values of difference between maximum and minimum among the three parameters. From above observation it is further concluded that feed rate being the highest value, is the most significant parameter for material removal rate. It can be derived also from Figure 3 that the optimal combination of machining parameters is A1 B3 C3
[image:3.595.59.545.87.531.2]Table 6. Experimetal results and S/N ratios values for material removal rate
Exp. no. A (rpm) B (mm/tooth) C (mm) MRR S/N h^2
1 2000 500 0.04 206.6890 46.31 2144.278
2 2000 1000 0.06 615.52 55.78 3111.949
3 2000 1500 0.08 1235.45 61.84 3823.753
4 4000 500 0.08 233.46 47.36 2243.372
5 4000 1000 0.04 236.34 47.47 2253.472
6 4000 1500 0.06 927.29 59.34 3521.747
7 6000 500 0.06 307.87 49.77 2476.789
8 6000 1000 0.08 801.83 58.08 3373.478
9 6000 1500 0.04 622.66 55.89 3123.135
Total 481.84 232170.8
Table 7. Analysis of Mean (ANOM) for material removal rate
Factor Symbol Unit Level-1 Level-2 Level-3 Max Min Max-Min Speed A rpm 54.64 51.39 54.58 54.64 51.39 3.25 Feed rate B mm/tooth 47.81 53.78 59.02 59.02 47.81 11.21 Depth of cut C mm 49.89 54.97 55.76 55.76 49.89 5.87
Figure 3. The main effect plot for S/N ratio for material removal rate
Table 8. ANOVA results for material removal rate.
Source Sum of sequence DF
Mean
square F ratio
% Contribution A 20.71 2 10.35 4.26 7.52 B 188.73 2 94.37 38.81 68.58 C 60.92 2 30.46 12.53 22.13 Error 4.86 2 2.43 1.77 Total 275.22 8 100.00
6. Conclusions
In this study, milling operations of complex shape on difficult to machine material i.e. copper were conducted. The effect of three machining parameters viz. speed, feed rate and depth of cut on the two response variables namely surface roughness and material removal rate were investigated. Taguchi’s design i.e. L9 orthogonal array was
used to obtain optimum machining parameters.
Subsequently, ANOVA was applied to investigate the effect of machining parameters on Ra and MRR and to obtain the
percentage distribution of the parameters. From the results of the present study the following conclusion are drawn: (i)The optimum combination of machining parameters and their levels for decreasing the deviation in Ra and MRR are
A3B1C2 and A1B3C3 respectively; (ii) depth of cut
significantly affects Ra; the percentage contribution of depth
of cut, feed rate and speed are 71.60%, 23.22%, 2.12% respectively;(iii)feed rate significantly affects MRR, the percentage contribution of feed rate, depth of cut and speed are 68.58%, 22.13% and 7.52% respectively.
REFERENCES
[1] M. Gupta, S. Kumar, Investigation of surface roughness and MRR for turning of UD-GFRP using PCA and Taguchi method Engineering Science and Technology, an International Journal Vol. 18 (2015), p.70-81.
[2] T. Kivak: Measurement Vol.50 (2014), p.19-28, Optimization of surface roughness and flank wear using the Taguchi method in milling of Hadfield steel with PVD and CVD coated inserts. Measurement, Vol. 50, pp. 19-28, 2014. [3] N. Mandal, B. Doloi, B. Mondal: Predictive modeling of
surface roughness in high speed machining of AISI 4340 steel using yttria stabilized zirconia toughened alumina turning insert, Int. Journal of Refractory Metals and Hard Materials Vol.38, p.40-46, 2013
[5] G. Petropoulos, F. Mata, J. P. Davim, Statistical study of surface roughness in turning of peek composites, Materials and Design Vol.29 p.218-223, 2008.
[6] R. Suresh, S. Basavarajappa, V. N. Gaitonde, G. L. Samuel: Machinability investigations on hardened AISI 4340 steel using coated carbide insert, Int. Journal of Refractory Metals and Hard Materials 33, p.75-86, 2012.
[7] R. Dhabale, V. K. S. Jattib, T. P. Singh, Multi-Objective Optimization of Turning Process during Machining of AlMg1SiCu Using Non-Dominated Sorted Genetic Algorithm, Procedia Materials Science, Vol.6, p.961-966, 2014.
[8] A. Molina, A. Torres-Islas, S. Serna, M. Acosta-Flores, R.A. Rodriguez-Diaz, J. Colin, Corrosion, Electrical and Mechanical Performance of Copper Matrix Composites Produced by Mechanical Alloying and Consolidation Int. J. Electrochem. Sci. Vol.10, p.1728- 1741, 2015.
[9] I. Asilturk, H. Akkus, Determining the effect of cutting parameters on surface roughness in hard turning using the
Taguchi method, Measurement Vol.44, p.1697-1704, 2011. [10] O. Koksoy, Z. F. Muluk, Solution to the Taguchi’s problem
with correlated responses, Gazi Univ. J. Sci. Vol.17, No.1, p. 59-70, 2004.
[11] S.H. Park: Robust design and analysis for quality engineering, Chapman & Hall, London1996.
[12] A. Hamdan, A. A. D. Sarhan, M. Hamdi: An optimization method of the machining parameters in high-speed machining of stainless steel using coated carbide tool for best surface finish, Int J Adv Manuf Technol, Vol.58, p.81-91, 2012. [13] N. Masmiati A,B, Ahmed A.D. Sarhan, Optimizing cutting
parameters in inclined end milling for minimum surface residual stress-Taguchi approach, Measurement, Vol.60, 267-275, 2015.