Journal of Chemical and Pharmaceutical Research, 2015, 7(8):862-867
Research Article
CODEN(USA) : JCPRC5
ISSN : 0975-7384
Correlation study between two analytical techniques used to
measure serum potassium: An automated potentiometric method
and flame photometry reference method
Ibrahim Sbai El Otmani
1, Anass Jarmoumi
1, Mustapha Bouatia
2, Brahim Mojemmi
2,
Mohammed O. B. Idrissi
2, Mustapha Draoui
2and Nabiha Kamal
11Laboratory of Biochemistry, University Hospital Ibn Rochd, Casablanca, Morocco
2Laboratory of Analytical Chemistry, Faculty of Medicine and Pharmacy of Rabat, University Mohamed V, Rabat,
Morocco
_____________________________________________________________________________________________
ABSTRACT
The comparison between analytical techniques is often necessary in clinical chemistry, in particular, when a usual method is to be replaced by a new one. The aim of this work is to demonstrate the correlation between the potentiometric determination of potassium serum made on a multi-parameter automated analyzer and flame photometry considered as reference method. 50 serum samples were collected, identified and divided into two parts to be analyzed for potassium using the two methods: Indirect potentiometry using potassium ion selective electrode (ISE), performed on a DIRUI CS-1200 auto-chemistry analyzer and flame photometry performed on a JENWAY PFP7 flame photometer. Mean potassium values were found to be 3.92 mEq/L ; range 2.1-6.7 mEq/L with indirect ISE method and 4.21 mEq/L ; 2.35-7.79 mEq/L with flame photometry. A Passing-Bablok regression curve was plotted. The linear regression of matched pairs of values showed a very good correlation with R2 = 0.912. Bias plots representing the differences between the values of the two techniques against the means of both methods according to the propositions of Bland and Altman were also drawn. The comparison between the results obtained by flame photometry and indirect ISE methods showed a good agreement in potassium determination. This study showed that there is a very good correlation and agreement when serum potassium is determined by indirect potentiometry performed on the DIRUI CS-1200 auto-chemistry analyzer and by the flame photometry standard method.
Key words: Serum potassium; Ion selective electrode; Flame photometry; Correlation.
_____________________________________________________________________________________________
INTRODUCTION
Potassium measurement is very crucial in clinical practice. The normal range for serum potassium is narrow (3.5 to 5.5 mEq/L), and minor departure from this range (by less than 1.0 mEq/L) is associated with significant morbidity and mortality [1].
The development of ion selective electrodes (ISE) and the use of potentiometry to measure potassium and other electrolytes has been a particularly welcomed advance in clinical chemistry practice. The time and the amount of sample needed for these determinations have been considerably reduced. But lot of apprehensions still remain regarding the results of potassium measure using ISE methods owing to the fact that this techniques measure the ion activity in water phase and not the concentration in plasma [2,3].
EXPERIMENTAL SECTION
Samples collection
50 samples of venous blood collected in dry tubes and sent for routine check up in the laboratory of biochemistry at the university hospital Ibn Rochd were taken randomly to give a wide range of potassium values.
Serums obtained after centrifugation of samples were split into two fractions and identified to be analyzed for potassium using the two methods: Indirect potentiometry using ion selective electrodes (ISE), performed on a DIRIUI CS-1200 auto-chemistry analyzer and flame photometry performed on a JENWAY PFP7 flame photometer.
Serum potassium measurement by indirect ISE method using the DIRUI CS-1200 Auto-Chemistry Analyzer
The DIRUI CS-1200 is a fully automated analyzer. The potassium determination uses a specific electrode which has a selective membrane for potassium in contact with both the test solution (solution of serum sample) and an internal filling solution containing a fixed concentration of potassium. Thanks to the particular nature of this membrane, the potassium ions will closely associate with the membrane on each side so that the membrane develops an electric potential or electromotive force (EMF). The amount of this EMF is determined by the difference in concentration of the test solution and the internal filling solution. The measurement system includes the potassium ISE, a reference electrode and the electronic circuits to measure and process the EMF to give the potassium concentration. The system must be calibrated at least every 24 hours. The calibration procedure requires the use of standard solutions (low and high potassium concentrations) to determine the slope factor. An internal reference solution is also measured during the calibration and between samples to correct for drift [2,4].
Serum potassium measurement by flame photometry using the JENWAY PFP7 flame photometer
Flame photometry measurement of potassium exploits the fact that some of the potassium atoms introduced in the apparatus flame are excited to a higher energy level. When these excited atoms return to the ground state, they emit radiation which can be measured by a detector using an appropriate filter (765nm for potassium) and correlated to the potassium concentration in the sample [5,6].
We used a JENWAY PFP7, which is a low temperature, single channel emission flame photometer designed for the routine determination of sodium, potassium, lithium, calcium and barium. Butane and air were used as fuel and oxidizer.
A calibration curve was plotted using standard solutions containing known concentrations of potassium ranging between 0 and 5ppm (or mg/L). Above these low levels, the flame begins to saturate and the flame emission ceases to increase in a linear relationship to concentration. All the serum samples were diluted 1/50 using deionised water so that they would lie on the calibration curve.
Considering the normal relatively high serum concentration in sodium compared to potassium and to ensure that the standards and samples backgrounds match we used a solution of NaCl in deionised water as solvent for the preparation of the standard solutions. The concentration of this solution was 0,164 g(NaCL)/L corresponding to 1/50 x 140 mEq(Na)/L. This concentration was chosen considering that the normal concentration of sodium in human serum is 137 to 142 mEq/L of plasma.
RESULTS AND DISCUSSION
Results of serum potassium measurement by indirect ISE method using the DIRUI CS-1200 auto-chemistry analyzer
The fully automated potassium determination in this analyzer gave the following results (table 1):
Results of serum potassium measurement by flame photometry
The calibration curve for potassium measurement was plotted using 6 standard solutions with concentrations ranging from 0 to 5ppm potassium. We calculated the corresponding concentrations in mEq(K)/L before dilution 1/50 as follow :
Concentration in mEq(K)/L before dilution 1/50 = K (ppm) x 50 / 39.0983
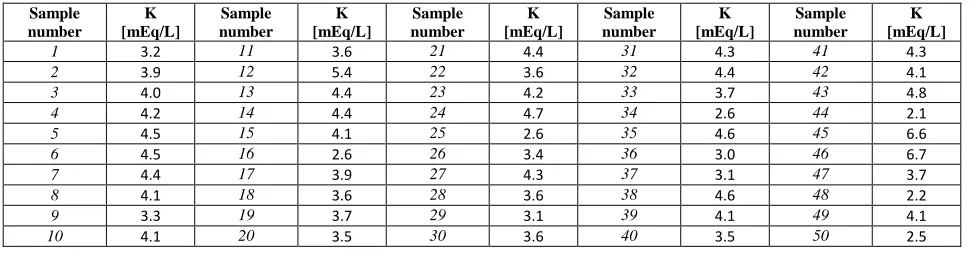
Table 1 : Results of serum potassium measurement by ISE method using the DIRUI CS-1200 auto-chemistry analyzer
Sample number
K [mEq/L]
Sample number
K [mEq/L]
Sample number
K [mEq/L]
Sample number
K [mEq/L]
Sample number
K [mEq/L]
1 3.2 11 3.6 21 4.4 31 4.3 41 4.3
2 3.9 12 5.4 22 3.6 32 4.4 42 4.1
3 4.0 13 4.4 23 4.2 33 3.7 43 4.8
4 4.2 14 4.4 24 4.7 34 2.6 44 2.1
5 4.5 15 4.1 25 2.6 35 4.6 45 6.6
6 4.5 16 2.6 26 3.4 36 3.0 46 6.7
7 4.4 17 3.9 27 4.3 37 3.1 47 3.7
8 4.1 18 3.6 28 3.6 38 4.6 48 2.2
9 3.3 19 3.7 29 3.1 39 4.1 49 4.1
10 4.1 20 3.5 30 3.6 40 3.5 50 2.5
The signal corresponding to every solution was measured. The results are summarized in table 2 :
Table 2 : Signals corresponding to the potassium calibration curve solutions measured in the JENWAY PFP7 flame photometer
K (ppm) 0 1 2 3 4 5
Corresponding concentration in mEq(K)/L before dilution 1/50 1.279 2.558 3.836 5.115 6.394 1.279
Signal 0 106 199 303 402 506
The calibration curve showing the relation between the signal and the concentration of potassium in mEq(K)/L before dilution 1/50 is represented in fig 1.
Fig1 : Calibration curve for potassium measurement by flame photometry
Table 3 : Results of serum potassium measurement by flame photometry Sample number K [mEq/L] Sample number K [mEq/L] Sample number K [mEq/L] Sample number K [mEq/L] Sample number K [mEq/L]
1 3.43 11 3.91 21 4.94 31 4.91 41 4.09
2 4.16 12 5.30 22 4.19 32 5.03 42 4.34
3 4.22 13 4.57 23 4.37 33 4.08 43 4.87
4 4.25 14 4.62 24 5.09 34 2.46 44 3.37
5 4.32 15 4.49 25 3.18 35 5.11 45 7.01
6 4.82 16 3.06 26 3.70 36 3.05 46 7.79
7 4.62 17 4.37 27 4.68 37 3.32 47 4.27
8 4.32 18 3.84 28 3.86 38 4.49 48 2.35
9 3.52 19 3.94 29 3.16 39 4.70 49 4.15
10 4.32 20 3.79 30 4.04 40 3.54 50 2.68
Results comparison between ISE method and flame photometry
Mean serum potassium values were found to be 3.92 mEq/L ; range 2.1-6.7 mEq/L with ISE method and 4.21 mEq/L ; 2.35-7.79 mEq/L with flame photometry. The Mean±S.D. of potassium in serum samples using both methods is given in table 4 :
Table 4 : Mean serum potassium values using flame photometry and automated ISE
Method Potassium (mEq/L)Mean ±S.D
ISE method 3.92 ± 0.90
Flame photometry 4.21 ± 0.96
Two methods of comparison were used to assess the agreement between the results of the two techniques:
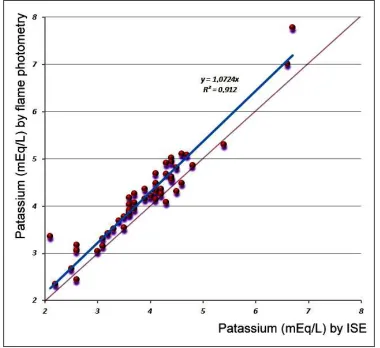
-Passing and Bablok regression [7,8] :
The linear regression of matched pairs of results given by the two methods showed a very good correlation with R2 = 0.912. The regression line’s slope is 1.072 (nearly 1) and the intercept value is 0. Fig 2 shows these results. The identity line representing a perfect equality between the values is also represented so that a quick visualization of the obvious agreement can be made.
-Bias plots between the differences of (ISE result – flame photometry result) values against the mean of both techniques were drawn according to the proposition of Bland and Altman [9] :
The mean difference for potassium concentrations in serum was found to be -0.229 mEq/L. The standard deviation was 0.259. Fig 3 shows this scatter plot. The 95% limits of agreement for serum potassium values (mean difference ± 2 SD) were found to be from -0.747 to 0.290 mEq/L.
Fig. 3 shows that the values of serum potassium as determined by both flame photometry and ISE lie between the upper limit and lower limit showing 95% limits of agreement. There is only a 5% chance that the values may lay beyond the limits of agreement.
Our results are similar to other studies that have been done to compare and standardize the automated potentiometric techniques with the traditional flame photometric method [3,10-12].
The differences we observed are small, without much clinical significance, thus the two methods are considered equivalent.
CONCLUSION
In this study, a very good correlation was found between the ion selective electrode method for the measurement of serum potassium performed on the DIRUI CS-1200 auto-chemistry analyzer and the standard flame photometry method performed on a JENWAY PFP7 flame photometer.
The potentiometric method using potassium ISE is fully automated and offers a high throughput while the flame photometry is more time consuming and requires manual operations.
The high degree of agreement demonstrated in this work shows that the results given by this two methods do not differ enough to cause any problems in clinical practice and that they can be used interchangeably.
Acknowledgments
The authors wish to thank all the individuals and institutions who made this work possible.
REFERENCES
[1] HK Walker; WD Hall; JW Hurst. Clinical Methods: The History, Physical, and Laboratory Examinations, 3rd edition, Butterworths Publishers, Boston USA, 1990, 884-885.
[2] RW Burnett; AK Covington; N Fogh-Andersen; WR Külpmann; A Lewenstam; AH Maas; O Müller-Plathe; C Sachs; O Siggaard-Andersen; AL VanKessel; WG Zijlstra. Clin Chem Lab Med., 2000, 38(10), 1065-1071.
[3] N Kau; M Gunther ; H Fahenstich, S Kowalewski ; P. Bartmann. Acta Anaesthesiol Scand., 1995, 39, (Supp 107), 107-111.
[4] M Bishop; E Fody; L Schoeff. Clinical Chemistry: Principles, Techniques, and Correlations, 7th edition, Lippincott Williams & Wilkins, Philadephia USA , 2013, 141-145.
[5] SJ Peitzman. Am J Kidney Dis., 2010, 56(2), 379-386. [6]PM Hald, J Biol Chem., 1947, 167(2), 499-510.
[7] W Bablock; H Passing. J Clin Chem Clin Biochem., 1983, 21, 709-720. [8] L Bilić-Zulle. Biochem Med., 2011, 21(1), 49-52.
[9] JM Bland; DG Altmant. Stat Methods Med Res., 1999, 8(2), 135-160. [10] B Sharma ; D Sarmah. Int J Health Sci Res., 2013, 3(6), 59-65.
[11] SC Raut; RS Chandel; LG Abichandani. Sch. J. App. Med. Sci., 2013, 1(6), 972-974