response surface methodology
Xiaomeng Guo and Tingjun Ma*
Food Science and Engineering, Beijing University of Agriculture, Beijing Key Laboratory of Agricultural Product Detection and Control for Spoilage Organisms and Pesticide, Beijing, China
ABSTRACT
This study applied response surface methodology and synthetic evaluation method to optimize the alkaloid content of buckwheat sprouts. Solid-liquid (1:10-1:30), ethanol concentration (60%-80%), extraction temperature (20℃-60℃) and extraction time (20-40 min) were considered as treatment factors in the optimization. All treatment variables shown significant effects on the alkaloid content of buckwheat sprouts (P<0.05). A second order polynomial model produced a satisfactory fitting of the experimental data considering the alkaloid content (R2adj=0.8803, S=0.094). Considering the feasibility, the best conditions for the alkaloids content were identified as
solid-liquid ratio 1:15, ethanol concentration70%, extraction temperature 45℃ and extraction time 20 min, under these conditions the alkaloids content was 1.35 mg/g. This process control study provided baseline data for developing industry of buckwheat sprouts.
Key words: Buckwheat, Germination, Alkaloid, Response surface methodology, Ultrasonic extraction
INTRODUCTION
Buckwheat has two main species including common buckwheat (Fagopyrum esculentum Moench) and tartary buckwheat (Fagopyrum tataricum Gaertn), which is a nutritious and pharmaceutically important plant. They are rich in functional ingredients, such as, flavonoid compounds (mainly rutin and quercetin), phenolic acids, amino acids, minerals, vitamins and crude fibers. Buckwheat and its products have high antioxidant activity and reducing capillary vessel brittleness, improving microcirculation, so buckwheat attracted wide attention in recently years [1, 2].
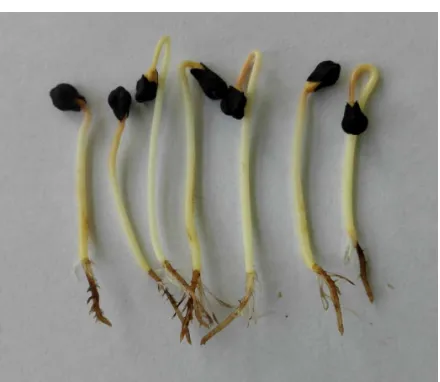
During germination (Fig.1), many significant changes were observed in the biochemical and physical aspects that resulted in the reduction of undesirable substances and the improvement of nutritional values [3]. Due to the buckwheat germination can enhance the digestibility of buckwheat protein as well as improve the quality of protein and the nutritional value of fatty acid composition, the germinated buckwheat has been considered as a new
vegetable. Michał S´ wieca had studied on the impact of elicitation and the phenylpropanoid pathway feeding on the
nutritional quality, the potentially bioaccessible phenolics and the antioxidant capacity of young buckwheat sprouts [4]. Jianxiong Hao had studied the slightly acidic electrolyzed water(SAEW) treatment could promote the rutin accumulation of germinated buckwheat by influencing phenylpropanoid secondary metabolic pathway instead of the
inhibition of rutin degrading enzyme (RDE) activity [5]. All of the above have proved that buckwheat sprouts were
further studied by more and more researchers.
Fig. 1. Germination buckwheat seeds
EXPERIMENTAL SECTION
Materials
Buckwheat seeds were collected from Shanxi Academy of Agricultural Sciences during its availability of the season. Chemicals including bromocresol green, potassium hydrogen phthalate, hydrochloric acid, sodium hydroxide, sodium carbonate, ethanol, chloroform. atropine sulfate were obtained from Sigma Aldrich (Gillingham, Dorset, UK). Other chemicals were of analytically pure.
Germination seeds
Approximately 50.0 g of buckwheat were sanitized by soaking for 3 min in a sodium hypochlorite solution 0.1 mol/L. Seeds were rinsed three times with deionized water. The resulting seeds were spread uniformly into the dish
for germination. The germination process was carried out in a incubator with the temperatures 25℃ and the relative
humidity about 80% to 95%[7]. Germination was conducted in dark conditions. Sprouts were harvested in the proper germination times, then immediately washed three times with deionized water. Samples were immediately
placed into plastic bags and stored at -18℃.
Alkaloids Extraction
The extraction of Alkaloids was carried out according to Hadi and Bremner [8] and extraction of Alkaloids was done by the ultrasonic assisted ethanol extraction method. Centrifuge at 4000 rpm, 15 min. The filtrate was rotary evaporated to a syrup state. The crude alkaloid mixture was then separated from neutral, acidic materials, and water soluble ingredients by hydrochloric acid solution (2% ), then basification of the aqueous solution using sodium carbonate (5%, w/v) and re-extracted with Chloroform. Dilute with Chloroform to volume 25 mL and absorbance was measured at 415.5 nm. The results were indicated as mg atropine sulfate equivalent.
Determination of alkaloids content
Weighed accurately 1.0 g sample, ultrasonic extracted in the appropriate parameter, then centrifugated at 4000 rpm, 15 min, under the room temperature. The final extract was filtered and the filtrate was concentrated under vacuum. The crude alkaloid mixture was then separated from neutral, acidic materials, and water soluble ingredients by extraction with aqueous hydrochloric acid (5%) followed by chloroform extraction, then basification of the aqueous solution using sodium carbonate (5%, w/v) and re-extracted with chloroform, and evaporated in volume to 5 mL. Pipetted 1 mL concentrate to 10 mL test tube, and added chloroform to 6 mL, then putted 4 mL Bromocresol Green in the mixture. The mixed solution was transferred to a separatory funnel, then added 15 mL chloroform, shocked 3 min, pipette chloroform layer to the 25 mL volumetric flask, diluted with ethanol to volume 25 mL and absorbance was measured at 415.5 nm. The results were expressed as mg atropine sulfate equivalent.
Effect of different experiment factors and levels on the alkaloid content
A Box-Behnken Design including 29 experimental runs formed by four variables and three levels was used. The experimental data were fitted to a second order polynomial model.
The data were statistically analyzed by means of a stepwise multiple regression using Design Expert 8.0.6 to yield equations for optimizing the process variables. Significant effects of independent variables on each response was determined by ANOVA.
RESULTS AND DISCUSSION
Effect of different solid-liquid ratio on the alkaloid content
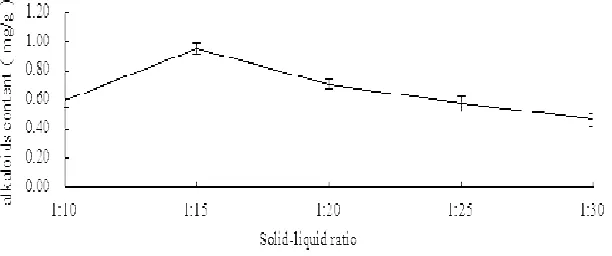
As the Fig. 2 shown, alkaloids content was increased according to the increase of solid-liquid ratio, in the rang from 1:10 to 1:15, and then with the increase of the solid-liquid ratio, alkaloid content in reduced. In this study, alkaloid content reached to the maximum 0.95 mg/g, when its solid-liquid ratio was 1:15.
Fig. 2. Effect of different Solid-liquid ratio content
Effect of different ethanol concentration on the alkaloid content
[image:3.595.153.459.403.531.2]Fig. 3. Effect of different Ethanol concentration content
Effect of different extraction temperature on the alkaloid content
As HANG[11] reported that thermally unstable alkaloids will be broken. The Fig. 4 shown, in the range of
temperature of 20 ℃ to 50 ℃ the higher temperature, the less alkaloids content. But, the alkaloids content suddenly
decreased, when the temperature higher than 50 ℃. The result is that alkaloid content reached to the maximum 1.20
mg/g, when temperature is 50 ℃.
Fig. 4. Effect of different Extraction temperature content
Effect of different extraction time on the alkaloid content
respectively.
Total desirability value was 61.4% in operational conditions (solid-liquid ratio 1:15, ethanol concentration 71.18%,
extraction temperature 48.85℃, extraction time 19.11 min) . Considering the feasibility, the best conditions for the
alkaloids content were identified as solid-liquid ratio 1:15, ethanol concentration70%, extraction temperature 45℃,
extraction time 20 min, under these conditions the alkaloids content was 1.35 mg/g.
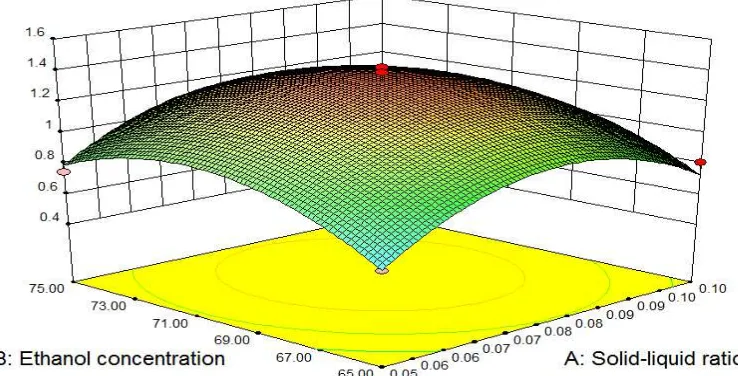
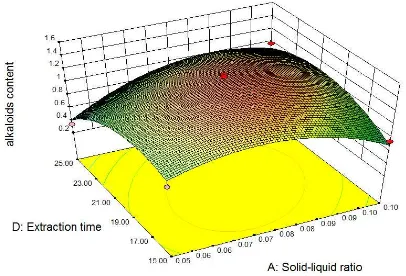
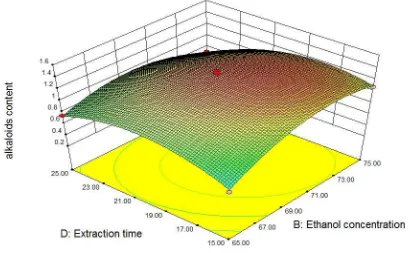
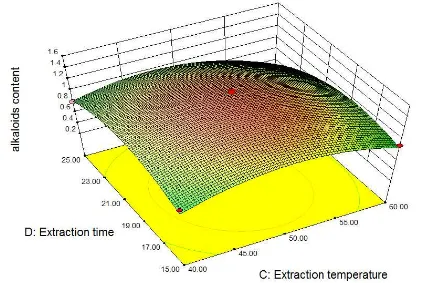
[image:5.595.108.507.391.704.2]As shown in Fig.6-11, at the given solid-liquid ratio, ethanol concentration and extraction temperature, alkaloids content increased and then decreased . The same conclusion came to the solid-liquid ratio, ethanol concentration and extraction temperature. The reason for these appearance is that the higher temperature and ethanol concentration may destroy the structure of alkaloids, the longer time of extraction and higher solid-liquid ratio will result in a waste of resources. Therefore , optimal combination factors should be identified to achieve minimal impact on the alkaloids content .
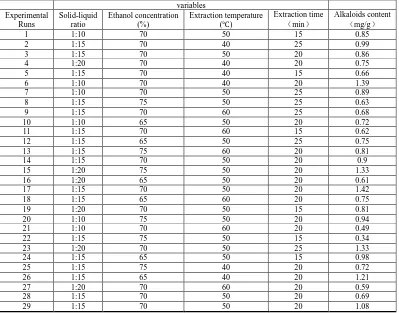
Table 2 Experimental values of response for response surface design
variables Experimental Runs Solid-liquid ratio Ethanol concentration (%) Extraction temperature (℃) Extraction time
(min)
Alkaloids content
(mg/g)
1 1:10 70 50 15 0.85
2 1:15 70 40 25 0.99
3 1:15 70 50 20 0.86
4 1:20 70 40 20 0.75
5 1:15 70 40 15 0.66
6 1:10 70 40 20 1.39
7 1:10 70 50 25 0.89
8 1:15 75 50 25 0.63
9 1:15 70 60 25 0.68
10 1:10 65 50 20 0.72
11 1:15 70 60 15 0.62
12 1:15 65 50 25 0.75
13 1:15 75 60 20 0.81
14 1:15 70 50 20 0.9
15 1:20 75 50 20 1.33
16 1:20 65 50 20 0.61
17 1:15 70 50 20 1.42
18 1:15 65 60 20 0.75
19 1:20 70 50 15 0.81
20 1:10 75 50 20 0.94
21 1:10 70 60 20 0.49
22 1:15 75 50 15 0.34
23 1:20 70 50 25 1.33
24 1:15 65 50 15 0.98
25 1:15 75 40 20 0.72
26 1:15 65 40 20 1.21
27 1:20 70 60 20 0.59
28 1:15 70 50 20 0.69
Table 3 ANVOA evaluation for response variable coefficient of models
Source Sum of
squares df
Mean
Square F-Value P-value
Model 1.96 14 0.14 15.71 < 0.0001 significant
A 0.043 1 0.043 4.85 0.0448
B 0.1 1 0.1 11.54 4.3×10⁻³
C 0.053 1 0.053 5.99 0.0282
D 0.085 1 0.085 9.55 8×10⁻³
AB 2.25×10⁻³ 1 2.25×10⁻⁴ 0.025 0.8759
AC 3.60×10⁻³ 1 3.60×10⁻³ 0.4 0.5351
AD 0.14 1 0.14 15.8 1.4×10⁻³
BC 0.027 1 2.70×10⁻² 3.06 0.1022
BD 0.06 1 6.00×10⁻² 6.74 0.0211
CD 0.024 1 0.024 2.70 0.1227
A2 0.66 1 0.66 74.66 < 0.0001
B2 0.44 1 0.44 49.77 < 0.0001
C2 0.61 1 0.61 68.95 < 0.0001
D2 0.49 1 0.49 54.65 < 0.0001
Residual 0.12 14 8.90×10⁻³
Lack of Fit 0.099 10 9.87×10⁻³ 1.52 0.3643 not significant Pure Error 0.026 4 6.48×10⁻³
Independent variables: A-solid-liquid ratio, B-ethanol concentration, C-extraction temperature, D-extraction time
[image:6.595.135.504.326.514.2]Fig. 7. Response surface and contour plots for alkaloids content at constant ethanol concentration (70%), extraction time (20 min), respectively
[image:7.595.108.501.81.302.2] [image:7.595.103.509.346.622.2]Fig. 9. Response surface and contour plots for alkaloids content at constant solid-liquid ratio (1:15), extraction time (20 min), respectively
[image:8.595.100.510.332.585.2]Fig. 11. Response surface and contour plots for alkaloids content at constant solid-liquid ratio (1:15), ethanol concentration (70%), respectively
CONCLUSION
In this study, Alkaloids of buckwheat sprouts was extracted using ultrasonic extraction, and response surface methodology design was employed to optimize the variables, including olid-liquid ratio, ethanol concentration, extraction temperature and extraction time. All these factors exhibited significantly quadratic effect on alkaloids contents. The optimum condition was identified as solid-liquid ratio 1:15, ethanol concentration 70%, extraction
temperature 45℃, extraction time 20 min, under these conditions the alkaloids content was 1.35 mg/g. This quality
and process control study provided the baseline data made a great potential for industrial usage.
Acknowledgements
The authors wish to thanks professor Tingjun Ma and the financial support of research funds for public sector (agriculture) research- activity of rice, grains and other food processing key technology and equipment research and demonstration (201403063).
REFERENCES
[1] DG Lee; IS Jang; KE Yang. J. Acta Pharm, 2016, 66(2), 297-302.
[2] LS Lee; EJ Choi; CH Kim. J. Journal of Cereal Science, 2016, 68, 181-186. [3] G Zhang; Z Xu; Y Gao. J. Journal of Food Science, 2015, 80(5), 1111-1119.
[4] Świeca; Michał. J. Food Chemistry, 2016, 192, 625-632.
[5] H Jianxiong; W Tongjiao; Li Huiying. J. Food Chemistry, 2016, 201, 87-93.
[6] T Benković; Ž Dušan; F Miha. J. Food Chemistry, 2014, 143, 432-439.
[7] Z Yiming; W Hong; C Linlin. J. Food Chemistry, 2015, 186, 244-248. [8] S Hadi; B John; Bremner. Molecules J. Molecules, 2001, 6(2),117-129. [9] W Gang; D Yun; X Xin. J. Food Control, 2016, 59,743-749.
[10]Z Qiang;Y Si-jiu;W Ting-pu. J. Acta Prataculturae Sinica,2012, 04,206-214. [11] Z Jian-guang; X Yan; L Yuan. J. Food Science, 2013, 10,11-15.