Neural Network Based System for Nondestructive Testing of
Composite Materials Using Low-Frequency Acoustic Methods
V.S. Eremenko, A.V. Pereidenko
*, E.F. Suslov
Department of Information-measuring Systems, National Aviation University, 03680, Kiev, Ukraine *Corresponding Author: [email protected]
Copyright © 2013 Horizon Research Publishing All rights reserved.
Abstract
The aim of the research was: the scientific justification and development of non-destructive testing system of products made of composite materials using low-frequency acoustic methods. During the work the following problems have been pointed and solved: 1. Analysis of the statistical characteristics of information signals and forming a set of diagnostic parameters. 2. Justification of necessity to use artificial neural networks for the technical state classification of products from composite materials. Comparative analysis of classification and decision making using of the statistical methods (based on chi-square statistics, metric distances, etc.), separating hyperplanes and neural networks. The type of neural network was defined, as a base for the neural network based classifier of composite materials defects. 3. Hardware and software development of information-diagnostic system for non-destructive testing of products from composite materials. Developed software includes three main parts: mathematical support, dataware and I/O module software. 4. Experimental investigation of developed information-diagnostic system in general.Keywords
Nondestructive Testing System, Composite Materials, Honeycomb Panel, Mechanical Impedance Analysis, Low-Velocity Impact, Neural Network1. Introduction
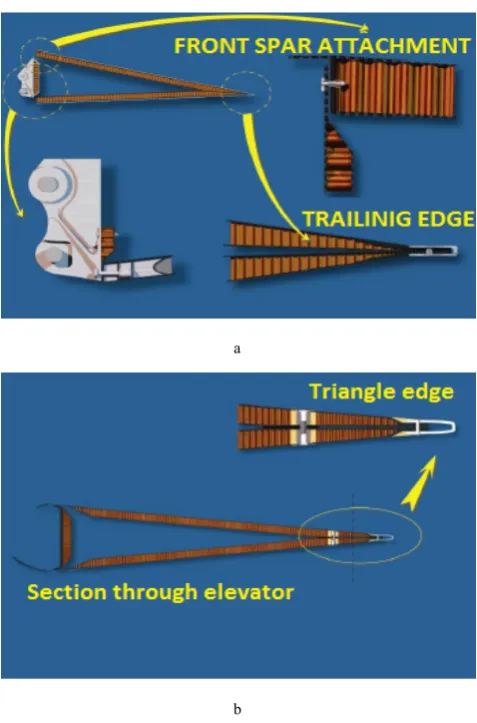
It is hard to imagine modern aircraft industry without composite materials. Nowadays the use of composites growths rapidly in aircraft design especially in manufacturing the highly loaded critical elements of the aircraft. The sandwich panels (based on the styrofoam) and honeycomb structures (which are made of aluminum fillers and cladding from composite materials take a special place in the aircraft structure. Composites are widely used in such parts of the aircraft like
Composites are widely used for external aircraft cladding, flaps, hatches, sides of the power components and floors,
rudders and elevator (Figure 1), ailerons etc. (Images taken from http://www.ndt.net/article/atandt2010/papers/18.pdf)
a
[image:1.595.313.552.282.644.2]b
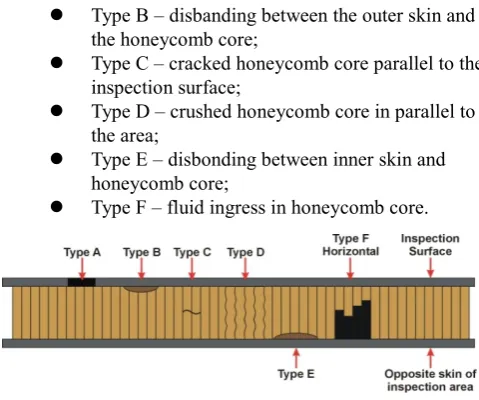
Figure 1. Honeycomb panels in rudder (a) and elevator (b) structure There is a large variety of possible defects of products from composite materials which used in modern aircraft [1]. The most widespread types of defects of products from composite materials (Figure 2, image taken fromhttp://www .ndt.net/article/atandt2010/papers/18.pdf) are the following:
Type B – disbanding between the outer skin and the honeycomb core;
Type C – cracked honeycomb core parallel to the inspection surface;
Type D – crushed honeycomb core in parallel to the area;
Type E – disbonding between inner skin and honeycomb core;
[image:2.595.53.293.75.275.2] Type F – fluid ingress in honeycomb core.
Figure 2. Typical defects of composite materials
These defects are difficult to diagnose, especially on the early stages of their development. The diagnostics of composite materials is characterized by the strong influence of random factors which caused by changes in the composites properties (caused due to the complexity of manufacturing processes), imperfect inspection techniques and flaw detection equipment, high amount of types of possible defects and other factors [2]. Non-destructive testing of composites via common methods such as x-ray and ultrasonic methods is very complex because of the high heterogeneity of the composite structure.
It is difficult to make enough standard samples for diagnostic system training that is another big problem of the non-destructive testing of products from composite materials. That’s why, the accuracy of the diagnosis of composite materials is determined not only by physical methods for obtaining experimental data but also with mathematical models and data processing methods which are used for creating the set of informative parameters and diagnostic decisions making.
2. Problem Definition
The analysis of the set of signals informative parameters, i.e. performing multi-parameter control, is the one of the possible ways to increase effectiveness and reliability of the non-destructive testing of composites [3]-[5].
The methods of spectrum analysis and pattern recognition methods (in particular separating hyperplanes) are often used in multi-parameter control for data processing and decision rules making. However, the application of these methods has a number of drawbacks [6-8]. The choice of basis for spectral transform is a challenge during spectrum analysis. A large number of spectral components, which are not always sensitive to defects in the specific material, should be processed for signal analysis. The components of higher frequencies that have low energy and are strongly distorted by noise should be analyzed too. There are additional
difficulties with the development and implementation of appropriate mathematical software for non-destructive testing system. . It is necessary to use sophisticated methods of information signals processing (based on the chi-square test or other statistical tests), which leads to the complex decision rules [9]. If multidimensional spaces of diagnostic parameters are linearly inseparable then construction of separating hyperplanes leads to the solution of complex nonlinear equations with a large number of components (the equations number is determined by the number of informative parameters which used for analysis). This is quite difficult or even impossible in some cases from the computational point of view and reduces the efficiency of the non-destructive testing system. The existing non-destructive testing systems do not allow to solve the cluster analysis task in the automatic mode. It is impossible to make changes quickly in the system memory about existing or new class of the defect, as well as enlarge system knowledge without recalculation of the all system parameters.
There are many methods and systems that perform diagnosis and technical state classification of products from composite materials [10]-[13]. However, their usage does not allow perform high quality of nondestructive testing such products because composite material have complicated structure. Nondestructive testing of composites should be performed with methods that would allow to collect the most comprehensive information about new defects, expand existed base of defects and increase diagnostics system precision without restarting (but in runtime). Since the number of dimensions of the features space (that used for decision rules making) is high it is difficult to use statistical methods for these purposes, because the analysis of high dimensional probability distribution functions should be performed. It results in significant usage of hardware and time resources.
Nowadays the developing of nondestructive testing systems for controlling the technical state of composites with complicated structure is actual problem. There are many researches devoted to problems of diagnostic systems construction and such issues as improvement of efficiency, accuracy, noise immunity, reliability, performance, and software polymorphism of these systems [14]-[16]. The solution requires systems that could use several control methods that are fast and efficient for diagnostics of composites and oriented for control wide set of possible products without large changes in the main hardware and software structure [14].
the sensors as well as to save important information about the relationship between the signal’s waveform and the technical state of the object under control [17,18]. This allows the neural network to classify new signals and possible defects that were not previously known and never met during its studies, i.e. dynamically enlarge system knowledge.
Application of neural networks in non-destructive testing of products from composite materials tasks is described very small and therefore it has a great scientific interest. And the task of developing neural network classifier forinformative-diagnostic systems of composites is actual and important.
3. Solution Description
[image:3.595.349.514.191.463.2] [image:3.595.317.551.524.663.2]Low frequency acoustic methods based on dry point contact are widely used for non-destructive testing of composites [19,20]. The most popular among them is the pulse variant of the mechanical impedance analysis (MIA) [21-22] and the low-velocity impact method [23,24]. These methods of diagnostic allows to find the biggest number of the most dangerous defects of composite materials [3,4,24,25]. The growth of composites use in aircraft requires additional researches and improvements to this class of methods.
The impedance method is based on the using of bending vibration. The method was first proposed in the 1960 year and was improved since that time. Impedance method is the one of the main nondestructive testing methods, which are used for the control of honeycomb sandwich panels and multilayer structures that made from polymeric composite materials, metals and their combinations. This is nondestructive testing method that based on the differences of mechanical impedance in defective and defect free areas of object under control. The mechanical impedance Z is a complex ratio of the force
F
which affects on surface of the mechanical system to the mean oscillatory speed of the surface in the direction of the force:Н Н
Z Z + ≅ =
К К Z
Z v F Z
(1)
К
K j 1
ZК ≅ ω – elastic resistance;
K
К– contact flexibility;Н
Z
– mechanical impedance in the contact area between the sensor and material;ω
=
2
π
f
– circular frequency.This value depends on the contact resistance and elastic flexibility in the area under control and based on change of the material stiffness in the area under control. The impulse impedance method involves the usage of two types of sensors: combined and split-combined sensors. When combined sensor is used the estimation of mechanical impedance performed in the same area as the excitation of elastic waves. In this sensor different piezoelectric elements are used for vibration receiving and excitation. The split-combined sensor (Figure 3) has two acoustically and electrically separated vibrators which are connected only
through the object under control.
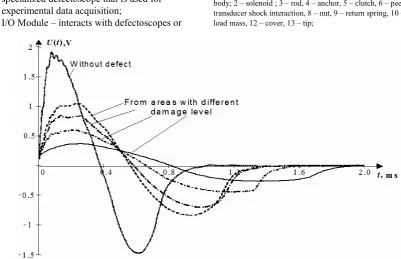
The sensor’s output signal is a sequence of damping impulses. An example of the impedance split-combined sensor output signal is shown on Figure 4. Change of impedance in the area under control affects the amplitude, frequency, phase, and waveshape of the sensor's output signal. That is why these parameters are used as informative for the classification and diagnostic decision making in case of the impedance non-destructive testing method.
Figure 3. Mechanical impedance split-combined sensor structure: 1 –
sensor case; 2 – emitting piezoelectric oscillator; 3 – receiving
piezoelectric oscillator; 4 – steal plates; 5 – piezo; 6 – contactor; 7 – testing object; 8 – defect.
Figure 4. Signals receiving from impedance split-combined sensor
During the diagnostic process the sensor consistently applies to the entire diagnostic surface a surgical strike with some energy (which does not entail the destruction of the object under control). At the moment when firing-pin with a kinetic energy A affects on the object under control an impulse of shock interaction force arises. This impulse is characterized by an amplitude, duration, waveshape and brings rich information about technical state of object under control. Oscillograms of detected impulses using low-velocity impact method are shown on Figure. As depicted on Figure 6 the damage level variation of the sample causes changing of impulse amplitude, duration and waveshape. Therefore, these characteristics were used as diagnostic parameters during the control of products from composite materials using low-velocity impact method.
The main part of information about technical state of object under control is concentrated in signal waveshape. The method of low-velocity impact is effective for diagnostics of fatigue damage, bundle defects, link breaks, defects which begin to born and also crack-like defects with millimeter size etc.
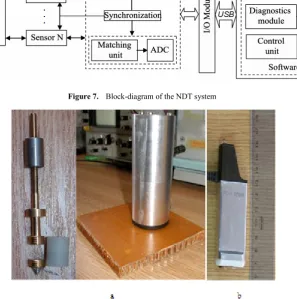
The block-diagram of the developed NDT system is depicted on Figure 7. The system’s hardware part consists the next blocks:
1) Set of sensors – force sensor and impedance sensor, transformer initial physical parameters into the electric signal (Figure 8);
2) Data acquisition unit – data acquisition platform based on the ADC and specialized modules or specialized defectoscope that is used for experimental data acquisition;
3) I/O Module – interacts with defectoscopes or
[image:4.595.340.517.101.409.2]with specialized data retrieving system and transmits data for subsequent data processing.
Figure 5. Mechanical impedance split-combined sensor structure: 1 –
body; 2 – solenoid ; 3 – rod, 4 – anchor, 5 – clutch, 6 – peen, 7 – the force transducer shock interaction, 8 – nut, 9 – return spring, 10 – washer 11 – load mass, 12 – cover, 13 – tip;
[image:4.595.97.499.432.691.2]Figure 7. Block-diagram of the NDT system
Figure 8. Impulse sensors: force sensor (a) and impedance sensor (b) The data acquisition unit in the system is based on an
analog-digital converter (ADC) Acute DS-1202. which is shown on Figure 9 (The image is taken from the website of the company Team Solutions Inc., Available at: http://www.teampctechnology.com). The Acute DS-1202 is a PC based dual channel ADC with a dynamic range of ± 10V, bandwidth of 100 MHz/channel and a sampling rate of 200 MSa/s. It is directly connected to a PC via USB 2.0 connection.
Figure 9. ADC Acute DS-1202
As shown on the block diagram (Figure 7) the sensor contacts with the object under control and forms informative signal. This informative signal carries information about the technical state of the object. Then via data acquisition unit and a special I/O module detected signal is sent to the PC. The next stage is the signal's processing and diagnostic decision making that performed via specially developed software.
A key element of system software is a classification module based on neural networks.
Application of neural networks for the experimental data processing gives the system some advantages that are absent when using statistical methods and separating hyperplanes for classification of defects [26-31]. These advantages are:
1) Solve both clustering and pattern recognition tasks; 2) Allow to work with large dimension vectors of
diagnostic parameters which increasing the reliability of control.
3) Flexibility and adaptability of the network architecture for various tasks;
4) High performance because of parallel data processing;
[image:5.595.69.287.571.735.2]mathematical models and their research;
6) No needs of a large number of standards for network training;
7) Ability to retrain and change network characteristics while modification is needed.
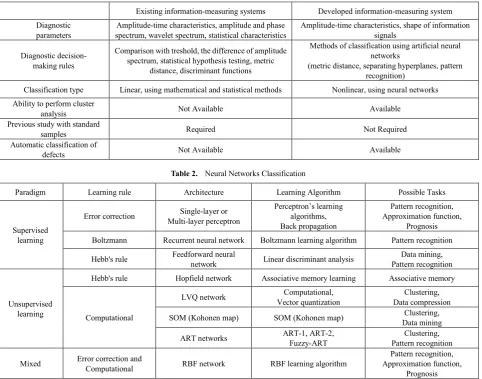
In the Table 1 is given the comparison of the characteristics of the main known NDT systems of products from composite materials with the characteristics of the developed system. Presented table shows that the developed system has several advantages which include: the ability to perform cluster analysis, non-linear classification, prior training on standard samples are not required and others.
This approach also has some disadvantages that should be considered when developing neural network based systems for data processing:
The absence of formal theory for the appropriate neural network models and architectures selection. There are no scientific based rules for setting specific
network parameters, which makes necessary to rely on empirical estimates of the analysis of such systems.
For choosing a neural network architecture that can be used for solving standardless diagnostic tasks it should satisfy the following conditions:
1) Perform unsupervised learning
2) Solve both clustering and pattern recognition tasks. Table 2 shows that among the most popular neural network architectures the basic requirements are satisfied by a set of neural networks of adaptive resonance theory (ART) [32-36]. So these types of network architecture can be used for solving tasks of nondestructive testing of composites. Also, for solving these tasks can be used combined (hybrid) neural network [11,17] based on Kohonen network (cluster analysis) [37] and multilayer perceptron [38] or RBF networks (detection and classification of defects type).
Table 1. Comparison developed system with existing systems
Existing information-measuring systems Developed information-measuring system Diagnostic
parameters spectrum, wavelet spectrum, statistical characteristics Amplitude-time characteristics, amplitude and phase Amplitude-time characteristics, shape of information signals
Diagnostic decision- making rules
Comparison with treshold, the difference of amplitude spectrum, statistical hypothesis testing, metric
distance, discriminant functions
Methods of classification using artificial neural networks
(metric distance, separating hyperplanes, pattern recognition)
Classification type Linear, using mathematical and statistical methods Nonlinear, using neural networks Ability to perform cluster
analysis Not Available Available
Previous study with standard
samples Required Not Required
Automatic classification of
[image:6.595.66.549.317.696.2]defects Not Available Available
Table 2. Neural Networks Classification
Paradigm Learning rule Architecture Learning Algorithm Possible Tasks
Supervised learning
Error correction Multi-layer perceptron Single-layer or Perceptron’s learning algorithms, Back propagation
Pattern recognition, Approximation function,
Prognosis
Boltzmann Recurrent neural network Boltzmann learning algorithm Pattern recognition
Hebb's rule Feedforward neural network Linear discriminant analysis Pattern recognition Data mining,
Unsupervised learning
Hebb's rule Hopfield network Associative memory learning Associative memory
Computational
LVQ network Vector quantization Computational, Data compression Clustering,
SOM (Kohonen map) SOM (Kohonen map) Data mining Clustering,
ART networks ART-1, ART-2, Fuzzy-ART Pattern recognition Clustering,
Figure 10 and Figure 11 shows the block diagrams and functionality algorithm, respectively, of the neural networks of adaptive resonance theory, namely ART-2 and Fuzzy-ART [31, 34-36]. ART network contains two layers of neurons:
1) Bottom-up layer or comparison layer which performs signal preprocessing
2) Top-down layer or recognition layer which performs classification and definition of matching the input signal to standard in network memory.
3) performed again but without suppressed neuron.
a
[image:7.595.61.283.119.569.2]b
Figure 10. Block diagram of ART-2 (a) and Fuzzy-ART (b) neural
networks (original works [34-36])
For comparison of the degree of difference between the input and standard signals, a special matching unit is used.
During the classification process, the input signal is processing according to the weights of the neurons in comparison layer of an ART-network. The signal is then fed to a recognition layer where the competitive search of the one single winning neuron (the neuron with an active output signal) is performed. Winner neuron is a neuron whose weight vector lies closest to the input vector (signal).
This neuron, that becomes active under the influence of the input signal, corresponds to a particular class (pattern), which was formed in the memory of neural network and could include an input signal. On the next stage a feedback
[image:7.595.320.542.175.449.2]signal from the winner neuron in the recognition layer comes back together with weights of an appropriate neuron to the comparison layer. In the comparison layer input signal is checked for compliance with the pattern in the network memory. If this pattern does not correspond to the input signal, the activity of the winner neuron in the recognition layer must be suppressed and the search phase for the new winner neuron (pattern) in the network memory should be.
Figure 11. The ART neural network algorithm
The algorithm is repeated until correct pattern is found or all neurons in the recognition layer are suppressed. If all neurons in the recognition layer are suppressed, then it means that the input signal belongs to the new pattern. This new pattern was not registered by neural network earlier and it didn’t similar to any of the previously registered patterns, stored in the network memory. In this case, the neural network will generate a new class and will provide a new neuron in the recognition layer. If during the search phase correct pattern (appropriate neuron with the corresponding weights) is found in the recognition layer, then the search phase stops and neural network generates as its output a signal that corresponds to one of the existing classes. Weights of the winning neuron in the recognition layer will be adapted according to appropriate network teaching rules. So desired signal pattern in network memory will in more general form describe the group of signals which belong to the appropriate class.
testing system. The software structure consists from the next main parts: mathematical support, dataware and I/O Module software.
There are different software packages such as MathLab [39], NeuroSolution [40], NeuroPro [41], STATISTICA [42] and others that provide the ability to work with mathematical apparatus of neural networks (NN). These packages could be used for solving the wide verity of problems. But in other hand they restrict the available NN architecture usage and do not allow performing adjustment on neuron level, creating add-ons and developing new learning and functional algorithms of NN. Some architectures of neural networks (for example some custom hybrid architectures) are absent in such software packages. Based on this fact software development of the nondestructive testing system was performed by authors in NI LabVIEW 2011 development environment [43,44]. This environment provides graphical programming language G and does not restrict the NN model implementation. NI LabVIEW allows developing new learning and functional NN algorithms, creating new types of NN or merging/joining existing nets in one functional system. Also it is possible to use existing programming modules and DLLs. LabVIEW 2011 environment performs parallel execution of algorithms which increases the performance of created nondestructive testing system software.
The nondestructive testing system software is developed by authors like a set of independent modules because of the need to solve the problem of standardless diagnostics for different object under control types with usage of only one system with possible minor changes for each specific task (difference could be in changing few existing functions or including new one for specific diagnostics tasks). It allows connecting and integrating created earlier libraries and modules (which were developed with high level languages) in the system core without its significant changes. This approach permits adding new or excluding unnecessary functionality, performing fast reconfiguration, modernization, adaptation, etc. without any complexity.
There are next main modules of system software:
1) ADC control module. This module includes units for configuring ADC parameters (sampling rate, dynamic range of input signals, number of ADC channels, synchronization source, etc.).
2) System’s regime control module. It is used for configuring such parameters of the system regime like the input data source (defectoscope, ADC or
physical/optical data storage), system regime, etc. 3) Data storages interaction control module. It allows
reading/writing data from/to data storage. It also forms array or subarray of necessary informative parameters for importing them to other diagnostics systems or for creating reports. In case when reading operation is performed this module forms the array from the stored data and represents it in required format.
4) Reporting facilities and system output control modules. These modules perform data transformation to convenient user-friendly format in case of data displaying or to required data storage format in case of data saving. Also it is possible to display or save on storage parameters of neural networks which are used in the system.
5) Control module for system database. It allows read/write set of formed classes during system work as well as their additional specific parameters. 6) Control module for neural networks. It allows user to
choose the type of neural network that will be used for data processing and classification and setup its parameters. This module contains units which perform class forming of OUC, finding new classes, anomalies, and converting the neural network output to user-friendly format.
7) Data buffer control module. This module writes retrieved data from ADC or defectoscope to array which further could be processed or saved for processing in future by current or another diagnostics system.
8) Data processing module. It allows choosing the necessary diagnostics characteristics which the most informative for current case and use them instead the full set of characteristics. In some cases the data vectors of small dimension size could be used. For efficient diagnostics system work the input data should be preprocessed to in specific way. That’s why in this module the necessary algorithms are executed.
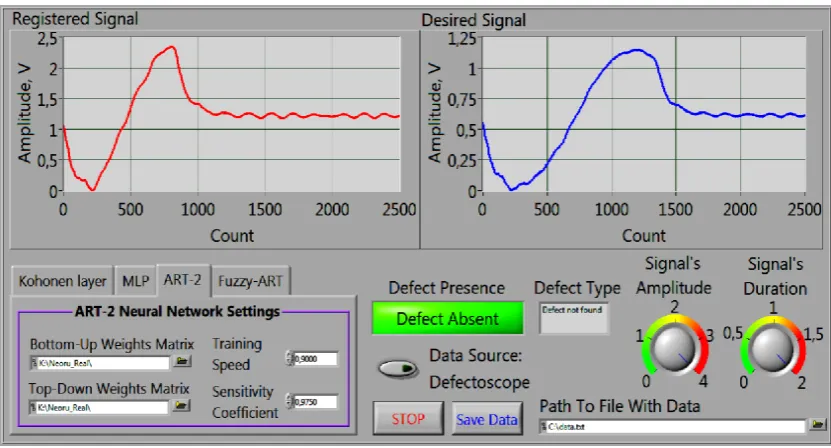
Figure 12. Nondestructive testing system software architecture
Figure 13. User interface of the NDT system based on ART-2 and Fuzzy-ART neural networks
The system can be used in both manual and automatic modes.
The system allows:
1) Input signal visualization;
2) Detecting input signals informative parameters; 3) Performing input signal preprocessing;
4) Performing input data cluster analysis;
5) Determining and building separating hyperplanes; 6) Classifying the state of OUC and displaying the
characteristics of its class;
7) Saving the values of selected informative parameters; 8) Creating decision rule;
9) Converting obtained results to user-friendly format.
4. Experimental Part
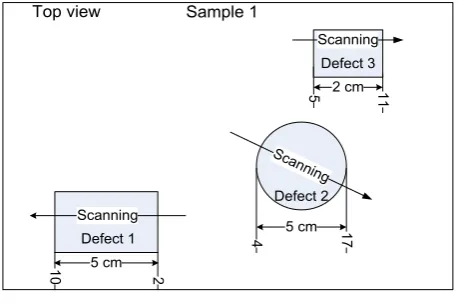
For the developed system testing were used samples of honeycomb panels which used in aircraft and presented on Figure 14. Experimental samples were provided by the State Enterprise "Antonov" and used in the "An" aircraft models manufacture. Two samples (S1 and S2) of honeycomb panels from wings of aircraft type An-70 (Figure 14a, 14b) of the material ELUR-P-0.1 and honeycomb filler PSP-1-2.5-45 with 10 mm of thickness were used. As defect models the areas with artificially formed defects were used. The following type of defects was under control: peeling skin on the inside of the filler cladding. The samples had six types of areas: one defect-free and five with different defectiveness level.
[image:9.595.97.513.315.539.2]figure). Scanning was performed with a discrete step equal 2 mm in the direction indicated in Figure 15. The numbers near the borders of areas with defects mean number of scanning points, were area with defect is begun and ended.
a
[image:10.595.318.547.74.245.2]b
Figure 14. Samples S1 (a) and S2 (b) of honeycomb panels (bottom view)
a
b
Figure 15. Location of defects in samples S1 (a) and S2 (b). Scanning was made with step 2mm
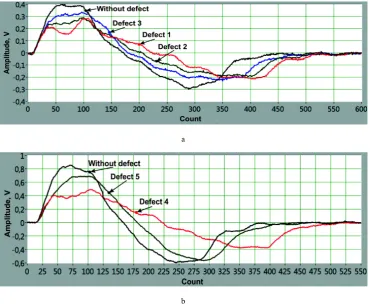
The developed software has been tested for the detection and diagnosis of defects in described samples of composite materials. Figure 16, 17 depicts examples of obtained informative signals during nondestructive testing.
The diagnosis of defects in described samples of honeycomb panels with artificial defects and signals processing was performed via three groups of methods:
1) Analyzing the amplitude and duration of the registered signals in individual and complex (by grouping these two parameters to the aggregate feature space) way, and constructing between different object states (defect – without defects) separating hyperplanes via iterative methods described in [6,30].
2) Statistical analysis of the registered signals, which includes spectral transformation of information signals and subsequent analysis of the spectral densities using chi-square distribution.
3) Analyzing the change of the registered signals shape via neural networks of adaptive resonance theory (ART-2 and Fuzzy-ART) [33,34], because changes of signals shape allow with high reliability detect defects presence in honeycomb panels and classify its type.
Defect 1 Scanning
Defect 2 Scanning
Defect 3 Scanning
Top view Sample 1
5 cm
2 cm
5 cm
10 2
17
4
11
[image:10.595.65.293.129.405.2] [image:10.595.64.294.431.585.2]a
b
Figure 16. Informative signals from S1 (a) and S2 (b) obtained using the impedance diagnostic method
a
b
[image:11.595.122.491.75.375.2] [image:11.595.121.492.400.704.2]For the nondestructive testing of described samples for each sample and each area (without defect and with different defects) 250 realizations of the informative signals were obtained. During the control process registered signals were given one by one in a casual order to the neural network entrance. After an appropriate signal was given to system, it was removed from input samples collection. This procedure was repeated until the input samples collection became empty.
After the classifier has formed its data base the verification of the nondestructive testing reliability via described software has been performed. For these purposes for each area 100 new signals were obtained and given to the neural network for classification.
Figure 18 depicts the results of investigations of the control reliability using the developed non-destructive testing system. As the physical diagnostic method the impedance method was used. For the comparison, classification of defects was performed using the chi-square statistic, separating hyperplanes and described the ART-2 and the Fuzzy-ART neural networks. Amplitude, frequency, phase, and waveshape of the sensor's output signal were used as informative parameters for the classification and diagnostic decision making in case of the impedance non-destructive testing method.
Obtained results shows that the decision rule based on statistical analysis using chi-square distribution as well as the decision rule based on separating hyperplanes constructed in the coordinate system amplitude-duration failed to detect defects with plottage less then 2 cm2 (defect 3 on the sample
1 and defect 5 on the sample 2). At the same time using the amplitude and duration of the data signals as informative parameters during control defects with plottage greater then 5 cm2 (defect 1 on the sample 1 and defect 4 on sample 2) it
was obtained reliability of the control about 80%. Using statistical analysis during control the same defects it was obtained reliability of the control about 83-85%.
Usage of ART-2 and Fuzzy-ART neural networks for the registered information signals processing during the control of honeycomb panels allows to determine bounds of defective areas 1 and 2 with plottage 5 and 2 cm2
respectively on the sample 1 and a defective area 1 with plottage 5 cm2 on the sample 2. Also, unlike the groups of
methods 1 and 2, classifier based on ART-2 and Fuzzy-ART neural networks has detected bounds of the defective areas with plottage 2 cm2 (defect 3 on the sample 1 and defect 5 on
the sample 2). So, it could be extended that usage of classifier based on ART-2 and Fuzzy-ART neural networks in nondestructive testing of honeycomb panels allows to detect defects with plottage greater then 2 cm2 which is
difficult or impossible with most currently used methods of diagnosis. The reliability of control via described classifier using impedance diagnostic method is over then 90%.
a
[image:12.595.313.552.76.405.2]b
Figure 18. The reliability of non-destructive testing of S1 (a) and S2 (b) using the impedance diagnostic method
Figure 19 depicts the results of investigations of the control reliability using the developed non-destructive testing system. As the physical diagnostic method the low-velocity impact method was used. Classification of defects was performed using the chi-square statistic, separating hyperplanes and described the ART-2 and the Fuzzy-ART neural networks. Amplitude, duration and waveshape of the sensor's output signal were used as informative parameters for the classification and diagnostic decision making in case of the low-velocity impact method.
Obtained results also shows that the decision rule based on statistical analysis using chi-square distribution and based on separating hyperplanes constructed in the coordinate system amplitude-duration failed to detect defects with plottage less then 2 cm2 (defect 3 on the sample 1 and defect 5 on the
sample 2). During control defects using low-velocity impact method with plottage greater then 5 cm2 (defect 1 on the
a
b
Figure 19. The reliability of non-destructive testing of S1 (a) and S2 (b) using the low-velocity impact diagnostic method
Usage of ART-2 and Fuzzy-ART neural networks for the registered information signals processing during the control of honeycomb panels allows to determine bounds of defective areas with plottage 5 cm2 as well as with plottage 2
cm2 on the sample 1 and on the sample 2. The reliability of
control via described classifier using low-velocity impact diagnostic method is over then 95% which is greater on 5% then using impedance method.
Based on results it could be mentioned the following. Using low-velocity method is preferably for data acquisition during nondestructive testing of honeycomb panels with defects of type: peeling skin on the inside of the filler cladding. Processing of acquired data using neural networks ART-2 and Fuzzy-ART allow increase reliability of control to 95%.
5. Conclusion
The nondestructive testing system of products from composite materials was created and investigated. Artificial neural networks are used for data processing, defects classification and making decision rules in the diagnostic system. The developed diagnostic system provides high reliability of the nondestructive testing: 90 - 95% that is better than analogous existing systems. Also there is no need for making the standard samples for its training.
The developed neural network classifier based on networks of adaptive resonance theory was used for the classification of defects of products from composite materials. This increases the reliability of technical state classification of products from composite materials compared with statistical methods and separating hyperplanes by 24%.
Developed software advantages are in its architecture flexibility, high performance and reliability of data signal processing, human-engineered interface.
The results of the research integrated to educational and research processes at the department of information-measuring systems of the National Aviation University.
REFERENCES
[1] NDT Toolbox for Honeycomb Sandwich Structures a comprehensive approach for maintenance inspections : (ATA NDT Forum 2010 Albuquerque) / Wolfgang Bisle // E-book Available:
http://www.ndt.net/article/atandt2010/papers/18.pdf [2] Eremenko V.S. Information-measuring system fordiagnostic
s of products from composite materials: PhD Thesis / V.S. Eremenko – Кiev, 2003. (In Ukrainian)
[3] Lange Y., Nikolaev S., Muzhitskiy V.F., Nefedov S.V. Spectra of low-frequency pulse signal transducers of acoustic defectoscopes. - Nondestructive Testing, 1996, № 5, P. 9-19. (In Russian)
[4] Lange Y., Nikolaev S.I., Muzhitskiy V.F., Lapshin V.C., Sidorenko A.S., Igonin M.A., Pavlyuchenkov N.F. The use of spectral analysis in the low-frequency acoustic defectoscopes. - Nondestructive Testing, 1995, № 10, P. 74-83. (In Russian) [5] Lange Y., Nefedov S.V. Correlation signal processing of
impedance defectoscope. - Control. Diagnosis, №1. 1998 P. 26-32. (In Russian)
[6] Eremenko V.S. Application of linear recognition methods in problems of nondestructive testing of composite materials / V.S. Eremenko, О.О. Gileva // «Electromagnetic and acoustic methods of nondestructive testing of materials and products LЕОТЕSТ-2009»: materials of the 14th international scientific conference, February 16-21, 2009.: proceedings − Slavskoe,2009.−P. 84-87. (In Ukrainian)
[7] Eremenko V.S. The study of defects in cellular screens low-frequency acoustic techniques / V.S. Eremenko, О.A. Gileva, V.Y.Derecha, E.F.Suslov, E.O.Pikolenko // Nauchni izvestia. – 2011. – №1. – P.49-51. (In Russian)
[8] Murashov V.V. Defects in parts of monolithic and multilayer structures made of polymer composite materials and methods for their detection / V.V. Murashov, A.F. Rumyancev // Control. Diagnostics. – 2007. – №4,5. – P. 23-32. (In Russian)
[image:13.595.59.306.75.395.2][10] Cawley P. Clayton D.L. R. A vibration technique for the measurement of contact stiffness // Mechanical systems and signal processing. - № 1. – 1987. P. 273-283.
[11] Suslov E.F. The control system of products from composite materials / E.F. Suslov, V.S. Eremenko, V.М. Mokijchuk // «Educational, scientific and engineering applications in LabVIEW and National Instruments technology»: materials of the 8th international scientific conference, November 20-21, 2009.: proceedings. – Moscow, 2009. – P. 87-90. (In Russian)
[12] Lihopoy A.A., Sysoev A.M. Devices for control with low-frequency acoustic methods. - Scientific Conference "High Technologies and Intelligent Systems 2003." Collection of scientific works. - Moscow, 2003., P. 215-218. (In Russian)
[13] Benlarbi S. and Melo W. Polymorphism Measure for Early Risk Prediction. In Proceeding of 21st ICSE 1999, Los Angeles USA.
[14] Zeeshan, A. Towards Performance Measurement and Metrics based Analysis of PLA Applications. Int. Jr. SE. & App. 2010. 1(3):66-80.
[15] Zeeshan, A. Measurement Analysis and Fault Proneness Indication in Product Line Applications (PLA). Frontiers in Artificial Intelligence and Applications 2007, IOS Press, 161: 391-400. Scientific & Academic Publishing http://www.sapub.org
[16] Victor Basili, Jens Heidrich, Mikael Lindvall, Jürgen Münch, Myrna Regardie, Dieter Rombach, Carolyn Seaman, Adam Trendowicz. Linking Software Development and Business Strategy Through Measurement. IEEE Computer 2010, 43(4): 57-65.
[17] Pereidenko A.V. Demerit rating system based on artificial neural networks / A.V. Pereidenko, Y.V.Kuts, V.S. Eremenko//”Days of nondestructive control 2010”: matetials of XXV National Conference with International participation "Defektoskopiya'10", June 13-17, 2010.: proceedings – Sophia,2010. − p.469-475. (In Russian) [18] Pereidenko A.V. The system of standardless diagnosis of
composite materials based on hybrid neural network./ A.V. Pereidenko, V.S. Eremenko, E.F. Suslov, P.A. Shegedin//” Educational, scientific and engineering applications in LabVIEW and National Instruments technology”: materials of the 9th international scientific conference, December 3-4, 2010.: proceedings − Moscow,2010.−P. 207-212. (In Russian)
[19] Adams R.D., Cawley P. A review of defect types and nondestructive techniques for composites and bonded joints // NDT International, v.21, №4, 1988. - P. 208-221.
[20] Muzhitskiy V.F. Control of multilayer structures with low-frequency acoustic defectoscopes / V.F. Mujitskiy, A.A. Lihopoy // New materials, nondestructive testing and high technology in mechanical engineering: Proceedings of the III International Scientific and Technical Conference. - Tyumen, 2005, p. 325-327. (In Russian)
[21] Cawley P. The sensitivity of the mechanical impedance method of nondestructive testing, - NDT International Vol. 20, No. 4, August 1987. p. 209-215
[22] Lange Y. Acoustic impedance method of nondestructive testing (Review) / Y. Lange // Defectoscopy. – 1990. –№8. –
P.3-19. (In Russian)
[23] Adams R.D., Cawley P. A review of defect types and nondestructive techniques for composites and bonded joints // NDT International, v.21, №4, 1988. - P. 208-221.
[24] Eremenko V.S. Detection of impact damage honeycomb panels using low-velocity impact/ V.S. Eremenko, V.M. Mokijchuk, A.M. Ovsankin// Technical diagnostics and nondestructive testing. – 2007. –№1. – P. 24-27. (In Russian) [25] Baker A., Stuart D., Kelly D, Composite Materials for
Aircraft Structures. Second Edidion / Alan Baker, Stuart Dutton, Donald Kelly. ― Reston, Virginia: American Institute of Aeronautics and Astronautics, Inc., 2004 ― 569 p. [26] Barhatov V.A. Detection of defects using artificial neural
network of a special type / V.А. Barhatov // Defectoscopy. – 2006. – №2. – P. 28-39. (In Russian)
[27] Naidenko A.G. Determining the reliability of the diamond cutters composite superhard materials by recording and analyzing acoustic emission: PhD Thesis / А.G. Naidenko. – Кiev, 2009. (In Ukrainian)
[28] Zajickiy O.V. Recognition of aircraft engines blades state via neural networks during vibroacoustic monitoring: PhD Thesis / О.V. Zajickiy. – Кiev, 2008. (In Ukrainian)
[29] Barhatov V.A. Detection of signals and their classification using pattern recognition / V.А. Barhatov // Defectoscopy. – 2006. – №4. – P. 14-27. (In Russian)
[30] Pereidenko A.V. Construction of decision rules in multiparameter NDT / A.V. Pereidenko, V.S. Eremenko, О.A. Gileva, E.F.Suslov // «Modern methods of of nondestructive testing and technical diagnosis»: materials of the 18th international scientific conference, October 5-9, 2010.: proceedings. – Yalta, 2010. – P. 78-81. (In Ukrainian). [31] Pereidenko A.V. Software of Information-Measurement
System for Standardless Diagnostic of Composite Materials / A.V. Pereidenko, V.S. Eremenko // Software Engineering. – 2012. – v.2, №3. – p. 65-76.
[32] Pereidenko A.V. Uses of the modified ART-2 neural network architecture in the nondestructive testing system of products from composite materials / A.V. Pereidenko, V.S. Eremenko, O.V. Monchenko // "Modern methods and instruments of nondestructive testing and technical diagnosis": materials of 19th International Conference, October 3-7, 2011.: proceedings – Gurzuf, 2011. – p. 81-84. (In Ukrainian) [33] Pereidenko A.V. System Of Standartless Diagnostic Of Cell
Panels Based On Fuzzy-ART Neural Network / A.V. Pereidenko, V.S. Eremenko, V.O. Rogankov // " MRRS-2011": Proceedings of the Third Microwaves, Radar and Remote Sensing Symposium, August 25-27, 2011: proceedings. – Kyiv, 2011. – p. 181-183.
[34] Carpenter G.A. ART 2: Stable self-organization of pattern recognition codes for analog input patterns / G.A. Carpenter, S. Grossberg // Applied Optics. – 1987. – №26. – Р. 4919-4930.
[35] Carpenter G.A. ART 2-A: An adaptive resonance algorithm for rapid category learning and recognition / G.A. Carpenter, S. Grossberg, D.B. Rosen // Neural Networks. – 1991. – №4. – Р. 493-504.
categorization of analog patterns by an adaptive resonance system / G.A. Carpenter, S. Grossberg, D.B. Rosen // Neural Networks. – 1991. – №4. – Р. 759-771.
[37] Pereidenko A.V. The system of cluster analysis of nondestructive testing products from composite materials/ A.V. Pereidenko, V.S. Eremenko, V.A Rogankov// Knowledge-intensive technologies. −2010. −№3. – P. 73-77. (In Ukrainian)
[38] Pereidenko A.V. The system of defects classification based on artificial neural networks / A.V. Pereidenko, V.S. Eremenko, J.O. Pavlenko // Bulletin of the National Technical University of Ukraine "Kyiv Polytechnic Institute". Series ‘Instrument Engineering’. – 2010. – №40. – p. 72-80. (In Ukrainian)
[39] Sumathi S., Surekha P. Computational Intelligence Paradigms: Theory & Applications using MATLAB. – CRC Press, Inc., 2010. – 851p.
[40] http://www.neurosolutions.com/ [41] http://neuropro.ru/
[42] Borovikov V.P. STATISTICA Neural Networks: The methodology and technology of modern data analysis. – Мoscow: Hotline Telecom, 2008. – 392p. (In Russian) [43] Fudoseev V.P. Digital Signal Processing in LabVIEW. –
Мoscow: DMK Press, 2007. – 472p. (In Russian)

![Figure 10. Block diagram of ART-2 (a) and Fuzzy-ART (b) neural networks (original works [34-36])](https://thumb-us.123doks.com/thumbv2/123dok_us/8756978.893104/7.595.61.283.119.569/figure-block-diagram-fuzzy-neural-networks-original-works.webp)