Under Voltage Load Shedding Using Trajectory
Sensitivity Analysis Considering Dynamic Loads
Ardiaty Arief
Department of Electrical Engineering, Hasanuddin University, Makassar 90245, South Sulawesi, Indonesia *Corresponding Author: [email protected]
Copyright © 2014 Horizon Research Publishing All rights reserved.
Abstract
Under voltage load shedding is a proficientcounter-measure action against voltage instability/collapse. UVLS procedure is an effective means to maintain voltage stability of a power system when the system’s voltage is just about to collapse following some disturbances. This paper proposes an advanced under voltage load shedding based on trajectory sensitivity analysis for voltage stability enhancement. Trajectory sensitivity analysis is a technique based on linearizing a system surrounding a certain trajectory and employs time domain simulations. This technique computes the sensitivity of the dynamics relating to the constraints. Trajectory sensitivities between bus voltages are calculated by using hybrid system’s trajectory sensitivities to obtain sufficient amount for load shedding. Furthermore, trajectory sensitivity index at all buses is calculated to select the most appropriate location of load shedding. Dynamic simulations are performed with the 14 bus RTS IEEE as case study.
Keywords
Under Voltage Load Shedding, DynamicLoad, Trajectory Sensitivity Analysis
1. Introduction
As the power system become more complex and heavily stressed, voltage stability problems also become more severe. During planning and operation of power system, voltage problems now have become a great concern, because of significant amount of failures which is believed that have been caused by voltage instability. Since 1920s, power system stability has been identified as a crucial prerequisite for a safe and reliable operation of electricity power system[1]. The instability of the power system has instigated disturbance expansion [2]. Specifically, transient voltage instability, which in the recent years steadily ascends following occurrence of line outage or short circuit.The importance of maintaining electric power system stability and reliability has motivated the developing of new methods to mitigate the system instability. Voltage instability can bring the whole network system to significant voltage drop
condition, therefore alleviation action is required. One of the mitigation action for voltage instability as discussed in [3, 4]is under voltage load shedding (UVLS) which is an economical way of alleviating system collapse where small load cutback between 5% and 10% can maintain the stability of the system. UVLS has been employed for a long time as the last remedy to evade major power system breakdown which is triggered by under voltage relays. UVLS is occupied by instantaneously shedding a certain amount of load to prevent voltage drop and to maintain the system equilibrium. Research and experience have provided evidence that UVLS is a powerful counter-measure action to preclude voltage instability.
Two core issues of UVLS are determining proper amount of load shedding and finding appropriate location for load shedding. Nonetheless, these problems are intricate in practical operation of UVLS. UVLS must shed adequate amount of loads to recover to a stable condition, yet not overly sensitive. Hence this paper aims to provide an advanced design of under voltage load shedding employing trajectory sensitivities methodology. Trajectory sensitivities between bus voltages are calculated by using hybrid system’s trajectory sensitivities to obtain sufficient amount for load shedding. Then trajectory sensitivity index at all buses is calculated to select the most appropriate location of load shedding. The proposed methodology is implemented on the 14-bus IEEE Reliability Test System. Dynamic simulation is performed to validate the robustness of the proposed method.
This paper is organized as follow. Section 2 explains power system under voltage load shedding. Section 3 describes about dynamic load modeling. The proposed method: trajectory sensitivity analysis based UVLS design is presented in Section 4. Section 5 gives the results and analysis and Section 6 concludes the main findings of the research. Findings of this research are expected to provide a better UVLS setting to confront the probability of voltage collapse incident.
UVLS is an economical option to maintain voltage stability while waiting for completion of new generation or transmission lines project [5]. Many utilities around the world have applied UVLS schemes. Reference [6] provides existing UVLS applications in some utilities with their specific setting. The philosophy of UVLS is that whenever the system is disrupted then lead to voltage drop condition below a certain pre-selected level for a certain pre-determined time period, then selected loads should be removed [7]. It is expected that the system voltage will retrieve to its normal limit by cutting off some loads. The objective of a UVLS is to reinstate the balance power within the system, to avert voltage collapse and to manage the voltage problems reside within a local area rather than permitting it to spread out to other areas [8]. The design of a load shedding should be “robust”. UVLS must cover enough loads as well as not overly sensitive. Therefore, there are some considerations to ensure efficient load shedding [7, 9]:
Determination of amount of load to be shed:
Shedding adequate amount of load is imperative in order to ensure UVLS can mitigate the menace of voltage instability. Shedding insufficient amount of the necessitated load will not be effective in arresting voltage collapse, on the other hand, shedding more load than required may lead to an over frequency circumstances.
Selection of location of load to be shed: Study in [10]
shows that shedding load in the correct location can arrest voltage instability. However, shedding the same amount of load in different location gives different result and may not be effective to improve the system stability.
Determination of timing and time steps of load
shedding: Load shedding is executed in steps in
order to preclude over shedding condition. The minimum time delay before a UVLS is triggered should be sufficient in preventing voltage collapse as well as avoiding unnecessary tripping during transient time where load shedding is unnecessary.
3. Dynamic Load Modeling
Load modeling is one of the most significant components in dynamic voltage stability simulation including under voltage load shedding. In this work, the load at each bus is represented as composite load which is a combination of static load and dynamic load. Figure 1 shows the equivalent circuit of a composite load model, where Z, I, P are constant impedance, constant current and constant power, respectively; Xm is magnetizing reactance; Xs is stator
leakage reactance; Xr rotor leakage resistance; Rs is stator
resistance; Rr is rotor resistance; and s is induction motor
slip.
Dynamic load model is important for UVLS design [11], because induction motors will decelerate substantially if their terminal voltage falls as a result of short circuits [12].
The generic load dynamic models are [13-16]
Figure 1. Schematic circuit of the composite load model
𝑇𝑇𝑝𝑝𝑑𝑑𝑑𝑑𝑑𝑑𝑑𝑑 + 𝑉𝑉𝑑𝑑 𝛼𝛼𝑑𝑑𝑑𝑑𝑑𝑑 = 𝑉𝑉𝛼𝛼𝑑𝑑𝑑𝑑𝑠𝑠(𝑉𝑉) + 𝛼𝛼𝑑𝑑𝑇𝑇𝑝𝑝𝑑𝑑𝑉𝑉𝑑𝑑𝑑𝑑𝑉𝑉𝑑𝑑𝑑𝑑 (1)
𝑇𝑇𝑞𝑞𝑑𝑑𝑑𝑑𝑑𝑑𝑑𝑑 + 𝑉𝑉𝑑𝑑 𝛽𝛽𝑑𝑑𝑑𝑑𝑑𝑑 = 𝑉𝑉𝛽𝛽𝑑𝑑𝑑𝑑𝑠𝑠(𝑉𝑉) + 𝛽𝛽𝑑𝑑𝑇𝑇𝑞𝑞𝑑𝑑𝑉𝑉𝑑𝑑𝑑𝑑𝑉𝑉𝑑𝑑𝑑𝑑 (2)
Where,
𝑑𝑑𝑠𝑠(𝑉𝑉)and 𝑑𝑑𝑠𝑠(𝑉𝑉) steady state load for real and reactive
power, respectively, as function of voltage;
𝑑𝑑𝑑𝑑(𝑉𝑉)and 𝑑𝑑𝑑𝑑(𝑉𝑉) transient load for real and reactive
power, respectively, as function of voltage;
𝑑𝑑𝑑𝑑and 𝑑𝑑𝑑𝑑 instantaneous real and reactive power,
respectively;
𝑇𝑇𝑝𝑝 and 𝑇𝑇𝑞𝑞 time constant for real and reactive power,
respectively;
𝑥𝑥𝑝𝑝 and 𝑥𝑥𝑞𝑞 load state variable for real and reactive
power, respectively;
𝛼𝛼𝑑𝑑, 𝛼𝛼𝑠𝑠, 𝛽𝛽𝑑𝑑, 𝛽𝛽𝑠𝑠, 𝑑𝑑1 and 𝑑𝑑1 are constants independent of
load busbar voltage 𝑉𝑉.
4. Trajectory Sensitivities Enhanced
UVLS Scheme
4.1. Trajectory Sensitivity Analysis
Trajectory sensitivity analysis is a technique based on linearizing a system surrounding a certain trajectory and employs time domain simulations [17]. This technique computes the sensitivity of the dynamics relating to the constraints [18]. Trajectory sensitivity provides a method of enumerating changes in the system variables in connection with the quick changes of system parameters and initial conditions [19]. The basic methodology of trajectory sensitivity computation of hybrid systems is illustrated in [19] as follow.
The systematical representation for voltage stability analysis of a power system is provided by the following differential-algebraic equation (DAE),
𝑥𝑥̇ = 𝑓𝑓(𝑥𝑥, 𝑦𝑦; 𝛼𝛼) (3) 0 = 𝑔𝑔(𝑥𝑥, 𝑦𝑦; 𝛼𝛼) (4)
Where 𝑥𝑥 is the vector of dynamic state variables; 𝑦𝑦 is the vector of algebraic state variables such as load bus voltage magnitudes and angles; and 𝛼𝛼 represents system parameters, such as power.
the dynamic variables 𝑥𝑥 and algebraic variables 𝑦𝑦, where flows of 𝑥𝑥 and 𝑦𝑦 can be defined, as
𝑥𝑥(𝑑𝑑) = 𝜑𝜑𝑥𝑥(𝑥𝑥0, 𝑑𝑑, 𝛼𝛼) (5)
𝑦𝑦(𝑑𝑑) = 𝜑𝜑𝑦𝑦(𝑦𝑦0, 𝑑𝑑, 𝛼𝛼) (6)
Sensitivities of the flows 𝜑𝜑𝑥𝑥 and 𝜑𝜑𝑦𝑦 to the initial
conditions and parameter variations can be acquired by forming the Taylor series expansions of above equations, hence
Δ𝑥𝑥(𝑑𝑑) = Δ𝜑𝜑𝑥𝑥(𝑥𝑥0, 𝑑𝑑, 𝛼𝛼) =𝜕𝜕𝜑𝜑𝑥𝑥(𝑥𝑥𝜕𝜕𝛼𝛼0, 𝑑𝑑, 𝛼𝛼)∆𝛼𝛼
=𝜕𝜕𝑥𝑥(𝑑𝑑)𝜕𝜕𝛼𝛼 ∆𝛼𝛼 ≅ 𝑥𝑥𝛼𝛼(𝑑𝑑)∆𝛼𝛼 (7)
Δ𝑦𝑦(𝑑𝑑) = Δ𝜑𝜑𝑦𝑦(𝑦𝑦0, 𝑑𝑑, 𝛼𝛼) =𝜕𝜕𝜑𝜑𝑦𝑦(𝑦𝑦𝜕𝜕𝛼𝛼0, 𝑑𝑑, 𝛼𝛼)∆𝛼𝛼
=𝜕𝜕𝑦𝑦(𝑑𝑑)𝜕𝜕𝛼𝛼 ∆𝛼𝛼 ≅ 𝑦𝑦𝛼𝛼(𝑑𝑑)∆𝛼𝛼 (8)
An approximation based numerical method is used to compute the sensitivities 𝑥𝑥𝛼𝛼and 𝑦𝑦𝛼𝛼, consequently,
𝑥𝑥𝛼𝛼 =𝜕𝜕𝛼𝛼𝜕𝜕𝑥𝑥=∆𝛼𝛼∆𝑥𝑥
≈𝜑𝜑𝑥𝑥(𝑥𝑥0, 𝑑𝑑, 𝛼𝛼 + ∆𝛼𝛼) − 𝜑𝜑∆𝛼𝛼 𝑥𝑥(𝑥𝑥0, 𝑑𝑑, 𝛼𝛼) (9)
𝑦𝑦𝛼𝛼 =𝜕𝜕𝑦𝑦𝜕𝜕𝛼𝛼=∆𝑦𝑦∆𝛼𝛼
≈𝜑𝜑𝑦𝑦(𝑦𝑦0, 𝑑𝑑, 𝛼𝛼 + ∆𝛼𝛼) − 𝜑𝜑∆𝛼𝛼 𝑦𝑦(𝑦𝑦0, 𝑑𝑑, 𝛼𝛼) (10)
The trajectory sensitivities from (8) and (10) are revised to meet the purpose of this study. The bus voltage magnitude and load shedding amount are both parameters represented by 𝑦𝑦 and 𝛼𝛼 correspondingly, hence sensitivities of bus voltage variation after load shedding at any specified bus are computed can be defined as
Δ𝑉𝑉(𝑑𝑑) = Δ𝜑𝜑𝑉𝑉(𝑉𝑉0, 𝑑𝑑, 𝑑𝑑) =𝜕𝜕𝜑𝜑𝑉𝑉(𝑉𝑉𝜕𝜕𝑑𝑑0, 𝑑𝑑, 𝑑𝑑)∆𝑑𝑑
=𝜕𝜕𝑉𝑉(𝑑𝑑)𝜕𝜕𝑑𝑑 ∆𝑑𝑑 ≅ 𝑉𝑉𝑑𝑑(𝑑𝑑)∆𝑑𝑑 (11)
𝜑𝜑𝑉𝑉𝑑𝑑 =𝜕𝜕𝑉𝑉𝜕𝜕𝑑𝑑=∆𝑉𝑉∆𝑑𝑑
≈𝜑𝜑𝑉𝑉(𝑉𝑉0, 𝑑𝑑, 𝑑𝑑 + ∆𝑑𝑑) − 𝜑𝜑∆𝑑𝑑 𝑉𝑉(𝑉𝑉0, 𝑑𝑑, 𝑑𝑑) (12)
4.2. Trajectory Sensitivity Factor
In addition, the trajectory sensitivities are performed to find the load shedding location. A trajectory sensitivity factor (TSF) is formulated to assess the contribution of bus j
after load shedding to the system voltage stability. The sensitivities calculated are �𝜕𝜕𝑉𝑉𝑖𝑖⁄𝜕𝜕𝑑𝑑𝑗𝑗�, which inform the rate
of change in voltage magnitude at bus i with respect to the load shedding amount variation at bus j. The TSF at bus j is computed by shedding active power at bus j by a small value then assessing its impact on voltage magnitudes at all critical buses along time domain. The TSF proposed in this work is
defined as
𝑇𝑇𝑇𝑇𝑇𝑇𝑗𝑗 = � �� �𝜕𝜕𝑉𝑉𝜕𝜕𝑑𝑑𝑖𝑖 𝑗𝑗�𝑑𝑑=𝑑𝑑𝑘𝑘 𝑑𝑑𝑠𝑠
𝑑𝑑=0
�
𝑛𝑛𝑘𝑘
𝑖𝑖=1
(13)
𝜕𝜕𝑑𝑑𝑗𝑗 = ∆𝑑𝑑𝑗𝑗 = 𝑑𝑑𝑠𝑠ℎ𝑒𝑒𝑑𝑑𝑗𝑗 Where,
𝑑𝑑𝑠𝑠ℎ𝑒𝑒𝑑𝑑𝑗𝑗 load shedding amount at bus j
𝑛𝑛𝑘𝑘 number of critical buses
𝑑𝑑𝑘𝑘 time instant
𝑑𝑑𝑠𝑠 number of time instant
The bus with the highest TSF means that this bus has the largest effect on the voltage stability improvement of the critical buses hence will be selected as a candidate bus for location of UVLS. The proposed trajectory sensitivities based UVLS can be explained as follow:
Step 1 Set load shedding amount. In this work, the load shedding amount is set at 5 MW for each iteration.
Step 2 Select an outage.
Step 3 Perform dynamic voltage stability analysis to observe the voltage behavior for all buses.
Step 4 Identify critical zones. This is a zone where buses in have similar pattern of voltage drop.
Step 5 Perform trajectory sensitivity analysis to evaluate the bus voltage trajectory sensitivities.
Step 6 Calculate TSF (13) to assess the contribution of each load bus on improving voltage stability of the buses the critical zones. The bus with the highest TSF has the most influence to improve the system voltage magnitude. The location of load shedding is determined based on the highest TSF value.
Step 7 Load shedding is applied in the selected bus. Step 8 Perform dynamic voltage stability analysis to evaluate the system performance after load shedding
Step 9 If the system is still unstable, then the network data is updated and go Step 5. This process will be reiterated until the voltage stability constraint is satisfied
Step 10 If the voltage stability requirement has been fulfilled, then write the results and stop the process.
3. Results and Discussion
TSF as in (13) is applied to determine the load shedding amount and location. As mentioned above, the bus with the highest TSF has the biggest effect on the voltage stability. The proposed method is implemented at the IEEE 14 bus Reliability Test System (Figure 2).
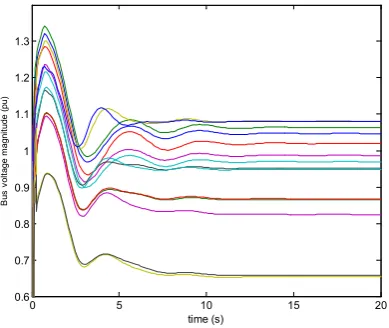
removing the transmission line between bus 6 and bus 13. Figure 3 shows the voltage drop after disturbance. There are five critical buses at which the voltage collapses below the stability limit (0.9 pu). They are buses 9, 10, 12, 13 and 14 as shown in Figure 4.
[image:4.595.82.277.308.472.2]Figure 2. The test system – IEEE 14 Bus Reliability Test System
Figure 3. Voltage drop at all buses after outage between bus 6 and bus 13
Figure 4. Voltage drop at the critical buses after outage between bus 6 and bus 13
For this simulation, the load shedding amount for each iteration is set at approximately 1% of the total system load. In this case, we round the amount to 5 MW for each step. The trajectory sensitivity analysis is performed to assess the effect of load shedding of 5 MW at each bus in the critical
zone. Figures 5 and 6 illustrate the voltage trajectory sensitivities of critical buses for the first iteration if load shedding is commenced at bus 14 and bus 6, respectively. From both of these figures, it can be concluded that the voltage trajectory sensitivities if load shedding occurs at bus 14 are better than the sensitivities at bus 6. Furthermore, TSF is calculated to provide a distinct indication for load shedding location. In computing the TSF value, we use time interval 0.5 seconds for the period 0 to 20 seconds. Table 1 illustrates the TSF calculation for load shedding at buses 14 and 6.
[image:4.595.315.549.420.576.2]Figure 5. Bus voltage trajectory sensitivities of critical buses if load shedding is 5 MW at bus 14
Figure 6. Bus voltage trajectory sensitivities of critical buses if load shedding is 5 MW at bus 6
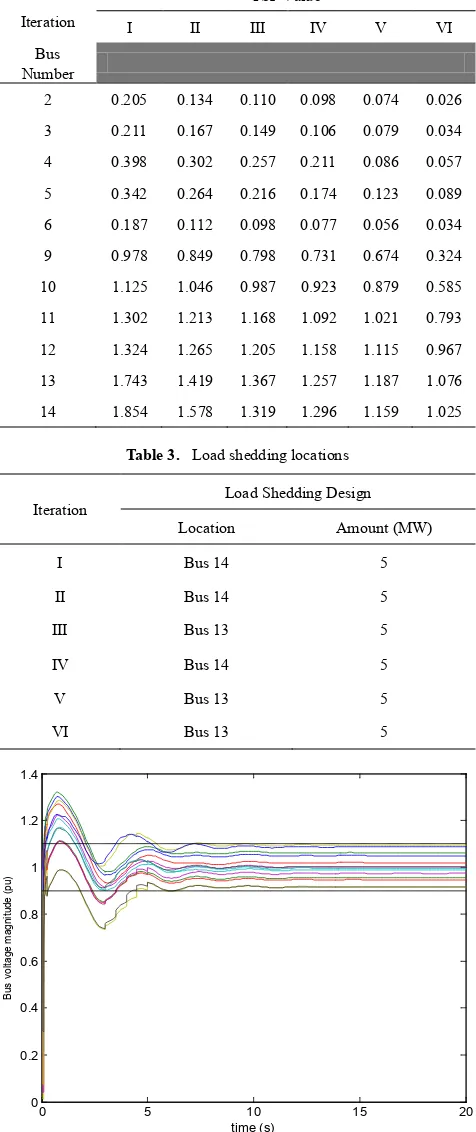
Figure 7 depicts the TSF value for each load bus at the first iteration. As indicated in the red bar, bus 14 has the highest TSF (1.854). Load shedding of 5 MW is simulated at bus 14 and the system voltage magnitude is re-evaluated. At this stage, the system is still unstable; hence, trajectory sensitivities are performed again to calculate the TSF. For this simulation, this process is repeated six times until the system voltages are stable (above 0.9 pu). The results of the TSF calculation for each iteration and load shedding location based on the highest TSF are presented in Table 2 and Table 3, respectively. Hence, the load shedding locations are bus 14 and bus 13 with a load shedding amount at each bus of 15
0 5 10 15 20
0.6 0.7 0.8 0.9 1 1.1 1.2 1.3
time (s)
B
us
v
ol
tage m
agni
tude (
pu)
0 5 10 15 20
0.6 0.65 0.7 0.75 0.8 0.85 0.9 0.95 1 1.05 1.1
time (s)
B
us
v
ol
tage m
agni
tude (
[image:4.595.79.280.497.659.2]MW. The results of the voltage improvement after load shedding of 30 MW at buses 14 and 13 can be seen in Figure 8. It clearly proves that the voltages at all buses improve significantly and that the system stability is recovered.
Table 1. TSF Calculation
� �𝜕𝜕𝑉𝑉𝜕𝜕𝑑𝑑𝑖𝑖 𝑗𝑗�𝑑𝑑=𝑑𝑑𝑘𝑘 𝑑𝑑𝑠𝑠
𝑑𝑑=0
Bus j 14 6
Bus i
9 0.271 0.037
10 0.223 -0.008
12 0.188 0.083
13 0.432 0.038
14 0.74 0.037
1.854 0.187
4. Conclusions
[image:5.595.313.551.100.666.2]This paper proposes a new design of under voltage load shedding for stabilizing the system following disturbance and ensuring the system secure limits are satisfied. The design is based on trajectory sensitivity technique that calculates the sensitivity of the dynamics relating to the constraints and provides a method of enumerating changes in the system variables in connection with the quick changes of system parameters and initial conditions. Trajectory sensitivity is employed to determine the minimum amount of load shedding and sensitivity index is used to verify location of load shedding.
Figure 7. TSF values at first iteration
The IEEE 14-bus Reliability Test System indicates that the trajectory based under voltage load shedding can effectively improve the system voltage behavior performance after outage. This proposed method can offer minimum disruption in load shedding while still ensuring post-fault voltage stability within the limits.
Table 2. TSF values
Iteration
TSF Value
I II III IV V VI
Bus Number
2 0.205 0.134 0.110 0.098 0.074 0.026
3 0.211 0.167 0.149 0.106 0.079 0.034
4 0.398 0.302 0.257 0.211 0.086 0.057
5 0.342 0.264 0.216 0.174 0.123 0.089
6 0.187 0.112 0.098 0.077 0.056 0.034
9 0.978 0.849 0.798 0.731 0.674 0.324
10 1.125 1.046 0.987 0.923 0.879 0.585
11 1.302 1.213 1.168 1.092 1.021 0.793
12 1.324 1.265 1.205 1.158 1.115 0.967
13 1.743 1.419 1.367 1.257 1.187 1.076
14 1.854 1.578 1.319 1.296 1.159 1.025
Table 3. Load shedding locations
Iteration Load Shedding Design
Location Amount (MW)
I Bus 14 5
II Bus 14 5
III Bus 13 5
IV Bus 14 5
V Bus 13 5
VI Bus 13 5
Figure 8. Voltage profile improvement after load shedding
REFERENCES
[1] Z. Y. Dong and P. Zhang, Emerging Techniques in Power
0 5 10 15 20
0 0.2 0.4 0.6 0.8 1 1.2 1.4
time (s)
Bus
v
ol
tage m
agni
tude (
[image:5.595.64.295.501.659.2]System Analysis: Springer, 2009.
[2] A. Wiszniewski, "New Criteria of Voltage Stability Margin for the Purpose of Load Shedding," IEEE Transactions on Power Delivery, vol. 22, pp. 1367-1371, 2007.
[3] P. Kundur, Power System Stability and Control. New York: McGraw-Hill, 1994.
[4] Y. Mansour and C. Canizares, "Voltage Stability," in Power System Stability and Control, L. L. Grigsby, Ed., ed Boca Raton: Taylor and Francis Group, 2007.
[5] Undervoltage Load Shedding Task Force (UVLSTF) Technical Studies Subcommittee, "Undervoltage Load Shedding Guidelines," Western Systems Coordinating Council, July 1999.
[6] S. Imai, "Undervoltage Load Shedding Improving Security as Reasonable Measure for Extreme Contingencies," in IEEE Power Engineering Society General Meeting, San Francisco, California, USA, 12-16 June, 2005, pp. 1754-1759, vol. 2. [7] M. Begovic, D. Fulton, M. R. Gonzalez, J. Goossens, E. A.
Guro, R. W. Haas, C. F. Henville, G. Manchur, G. L. Michel, R. C. Pastore, J. Postforoosh, G. L. Schmitt, J. B. Williams, K. Zimmerman, and A. A. Burzese, "Summary of "System Protection and Voltage Stability"," IEEE Transactions on Power Delivery, vol. 10, pp. 631-638, 1995.
[8] C. J. Mozina, "Undervoltage Load Shedding," in 60th Annual Conference for Protective Relay Engineers Texas, USA, 27-29 March, 2007, pp. 16-34.
[9] S. S. Ladhani and W. Rosehart, "Under Voltage Load Shedding for Voltage Stability Overview of Concepts and Principles," in IEEE Power Engineering Society General Meeting, Denver, Colorado, USA, 6-10 June, 2004, pp. 1597-1602, vol. 2.
[10] C. M. Affonso, L. C. P. da Silva, F. G. M. Lima, and S. Soares, "MW and MVar Management on Supply and Demand Side for Meeting Voltage Stability Margin Criteria," IEEE Transactions on Power System, vol. 19, pp. 1538-1545, 2004.
[11] A. Borghetti, R. Caldon, A. Mari, and C. A. Nucci, "On dynamic load models for voltage stability studies," IEEE Transactions on Power Systems, vol. 12, pp. 293-303, 1997. [12] B. Sapkota and V. Vittal, "Dynamic VAr Planning in a Large
Power System Using Trajectory Sensitivities," IEEE Transactions on Power Systems, vol. 25, pp. 461-469, 2010. [13] R. M. Rifaat, "On Composite Load Modeling for Voltage
Stability and Under Voltage Load Shedding," in IEEE Power Engineering Society General Meeting, Denver, Colorado, USA, June 7 - 10, 2004, pp. 1603-1610 Vol.2.
[14] B. Hua and V. Ajjarapu, "A Novel Online Load Shedding Strategy for Mitigating Fault-Induced Delayed Voltage Recovery," IEEE Transactions on Power Systems, vol. 26, pp. 294-304, 2011.
[15] W. Xu and Y. Mansour, "Voltage Stability Analysis Using Generic Dynamic Load Models," IEEE Transactions on Power Systems, vol. 9, pp. 479-493, 1994.
[16] R. Balanathan, N. C. Pahalawaththa, and U. D. Annakkage, "Undervoltage Load Shedding for Induction Motor Dominant Loads Considering P, Q Coupling," IEE Proceedings- Generation, Transmission and Distribution, vol. 146, pp. 337-342, 1999.
[17] K. N. Shubhanga and A. M. Kulkarni, "Determination of Effectiveness of Transient Stability Controls Using Reduced Number of Trajectory Sensitivity Computations," IEEE Transactions on Power Systems, vol. 19, pp. 473-482, 2004. [18] J. Ma, D. Han, R.-M. He, Z.-Y. Dong, and D. J. Hill,
"Reducing Identified Parameters of Measurement-Based Composite Load Model," IEEE Transactions on Power Systems, vol. 23, pp. 76-83, 2008.