Identification and Analysis of Informative Single Nucleotide
Polymorphisms in 16S rRNA Gene Sequences of the
Bacillus cereus
Group
Janetta R. Hakovirta,aSamantha Prezioso,a*David Hodge,bSegaran P. Pillai,c Linda M. Weigela
National Center for Emerging and Zoonotic Infectious Diseases, Centers for Disease Control and Prevention, Atlanta, Georgia, USAa
; Science and Technology Directorate, U.S. Department of Homeland Security, Washington, DC, USAb
; Office of Laboratory Science and Safety, U.S. Food and Drug Administration, Silver Spring, Maryland, USAc
Analysis of 16S rRNA genes is important for phylogenetic classification of known and novel bacterial genera and species and for detection of uncultivable bacteria. PCR amplification of 16S rRNA genes with universal primers produces a mixture of ampli-cons from all rRNA operons in the genome, and the sequence data generally yield a ampli-consensus sequence. Here we describe valu-able data that are missing from consensus sequences, varivalu-able effects on sequence data generated from nonidentical 16S rRNA amplicons, and the appearance of data displayed by different software programs. These effects are illustrated by analysis of 16S rRNA genes from 50 strains of theBacillus cereusgroup, i.e.,Bacillus anthracis,Bacillus cereus,Bacillus mycoides, andBacillus thuringiensis. These species have 11 to 14 rRNA operons, and sequence variability occurs among the multiple 16S rRNA genes. A single nucleotide polymorphism (SNP) previously reported to be specific toB. anthraciswas detected in someB. cereusstrains. However, a different SNP, at position 1139, was identified as being specific toB. anthracis, which is a biothreat agent with high mortality rates. Compared with visual analysis of the electropherograms, basecaller software frequently missed gene sequence variations or could not identify variant bases due to overlapping basecalls. Accurate detection of 16S rRNA gene sequences that include intragenomic variations can improve discrimination among closely related species, improve the utility of 16S rRNA da-tabases, and facilitate rapid bacterial identification by targeted DNA sequence analysis or by whole-genome sequencing per-formed by clinical or reference laboratories.
I
n 1977, Woese and his colleagues introduced the 16S rRNA genesequence for phylogenetic studies and, based on that sequence, proposed a Tree of Life composed of three domains of living
or-ganisms, i.e.,Archaea,Bacteria, andEukarya(1,2). The domain of
bacteria is by far the largest and continues to expand as diverse
environments are analyzed (3). Bacterial 16S rRNA genes are
lo-cated within the rRNA operons, which also contain genes for 23S rRNA, 5S rRNA, tRNA, and associated intergenic spacer regions. Since rRNAs are essential for survival, these operons are expected to be found on the chromosome. However, a recent report by
Anda et al. (4) described a clade within the genusAureimonasfor
which the sole rRNA operon is located on a small plasmid, which suggests that there is still more to be learned about rRNA in bac-terial species. Although the DNA sequences of various rRNA genes and intergenic spacer regions have been used for identification to the genus or species level, the 16S rRNA gene is usually preferred. In addition to being universally distributed among bacteria, this gene contains both highly conserved and hypervariable regions, and there are large and constantly expanding databases of 16S rRNA gene sequences for comparison.
Widespread use of DNA sequencing technologies in clinical, public health, and research laboratories has resulted in rapid and accurate molecular diagnostic methods. A bacterial isolate can now be identified more rapidly by 16S rRNA sequence analysis than by conventional methods. In addition to novel or uncultur-able bacteria, gene sequence analysis has been employed for iden-tification of bacteria with unusual phenotypic profiles, some of which are misidentified by automated clinical identification
sys-tems (5). In the second edition of Bergey’s manual of systematic
bacteriology (6), the definitive authority on phylogenetic
classifi-cation of bacteria, phenotypic characteristics and the laborious
task of DNA-DNA hybridization procedures have been replaced
by 16S rRNA sequence analysis (6) as the basis for taxonomic
classification, and the rationale is explained in a section titled “16S rRNA: the benchmark molecule for prokaryote systematics.” In some clinical settings, however, analyses of phenotypic character-istics such as Gram staining, cell morphology, and biochemical properties are still the first steps in species identification, and 16S rRNA sequence analysis may be performed only when the pheno-typic results are not definitive.
Differentiation between closely related species using 16S rRNA gene sequences can be difficult. For example, the 16S rRNA gene
sequences ofBurkholderia malleiandBurkholderia pseudomallei
differ by a single nucleotide, which is not located in one of the nine
hypervariable regions (7). For some species, the sequences may
appear to be identical, as has been reported for strains ofBacillus
anthracis,Bacillus cereus, andBacillus thuringiensis(8) (i.e.,
mem-bers of theB. cereusgroup). Indeed, it has been proposed that the
Received10 June 2016 Returned for modification1 July 2016
Accepted17 August 2016
Accepted manuscript posted online31 August 2016
CitationHakovirta JR, Prezioso S, Hodge D, Pillai SP, Weigel LM. 2016.
Identification and analysis of informative single nucleotide polymorphisms in 16S rRNA gene sequences of theBacillus cereusgroup. J Clin Microbiol 54:2749 –2756.
doi:10.1128/JCM.01267-16.
Editor:E. Munson, Wheaton Franciscan Laboratory
Address correspondence to Linda M. Weigel, [email protected].
*Present address: Samantha Prezioso, Department of Microbiology and Immunology, Emory University School of Medicine, Atlanta, Georgia, USA. Copyright © 2016, American Society for Microbiology. All Rights Reserved.
on May 16, 2020 by guest
http://jcm.asm.org/
B. cereusgroup should be considered one species (9). However, variations in 16S rRNA gene sequences often can be found within the genome of a single strain, due to the presence of single nucle-otide polymorphisms (SNPs) or small insertions or deletions (in-dels) among the multiple 16S rRNA copies. Such polymorphisms
have been documented in various genera and species (10–16).
Since universal PCR primers have been designed to target con-served sites, PCR amplification of all 16S rRNA genes found on the chromosome occurs simultaneously, resulting in a product that is a mixture of the amplicons. Consequently, references to the 16S rRNA gene sequence for a species or a strain actually refer to a consensus sequence representing all 16S rRNA genes encoded in that specific genome. A consensus sequence may mask useful dif-ferences between the multiple 16S rRNA genes.
Through DNA sequence analysis and comparison of the
mul-tiple 16S rRNA genes inB. anthracis,B. cereus, andB. thuringiensis,
we show that SNPs and other ambiguities among the multiple 16S rRNA genes in each species can be detected in the mixtures of PCR amplicons that are generated with universal 16S rRNA gene prim-ers. Visual inspection of basecaller data, such as the electrophero-grams generated by Sanger sequencing instruments, is necessary, however, because analyses that rely on the sequences generated by the software may miss key differences. Careful analysis of SNPs and indels is important for detection and correction of errors be-fore they are entered into reference databases.
MATERIALS AND METHODS
The strains used in this study are listed inTable 1. All procedures involving virulent strains ofB. anthraciswere performed in a class II type A2 bio-logical safety cabinet located in a select agent-registered, biosafety level 3 (BSL3) laboratory. Additional BSL-3 precautions included the use of powered air-purifying respirators and other personal protective labora-tory clothing. PCR amplicons of 16S rRNA gene sequences were generated from either purified genomic DNA or DNA in whole-cell lysates. Heat
lysis was performed as described by Hoffmaster et al. (17), with the fol-lowing modification: the cell lysates were cleared of cellular debris, possi-ble spores, and any remaining intact cells by centrifugation through a 0.1-m Durapore filter (EMD Millipore, Billerica, MA). Genomic DNA was isolated using the Qiagen DNeasy Blood and Tissue kit (Qiagen, Va-lencia, CA), following the manufacturer’s recommended protocol.
The 16S rRNA genes were amplified using universal oligonucleotide primers E8F and E1541R, which produced amplicons of approximately 1,500 bp (18). The amplification was performed in 50l (final volume) of reaction mixture containing 2.5 units of PlatinumTaqDNA polymerase, 1⫻Mg-free PCR buffer, 1.5 mM MgCl2, 200M each deoxynucleoside
triphosphate, 0.2M each primer, and 8 to 10 ng of purified genomic DNA or 10l of whole-cell lysate. PCR parameters were 94°C for 2 min, 30 cycles of 94°C for 30 s, 55°C for 30 s, and 72°C for 90 s, and a final extension at 72°C for 10 min.
Bidirectional 16S rRNA gene sequence data were acquired by using the published oligonucleotide primers E8F, E341F, E786F, E1115R, and E1541R (18), with one modification. The primer designated E341F was modified by substituting adenosines for inosines, and a guanosine was added to the 3=end (5=-CCTACGGGAGGAGCAG-3=). PCR primers remaining in the amplicon mixture were hydrolyzed with ExoSAP-IT reagent (USB) prior to DNA cycle sequencing reactions, which were performed with the BigDye Terminator v3.1 cycle sequencing kit (ThermoFisher, Pittsburgh PA). The manufacturer’s recommended pro-tocol was modified to use a 10-l reaction mixture consisting of 1.6 pmol sequencing oligonucleotide primer, 8 to 10 ng PCR-generated template DNA, and 1l of Terminator Ready Reaction mix. This modification decreased the final volume by one-half and was incorporated to conserve the sequencing reaction mix. No differences in sequence quality between the 10-l and 20-l reaction mixtures were detected. The cycle sequenc-ing reaction products were treated with the BigDye XTerminator purifi-cation kit, and DNA sequences were determined using an Applied Biosys-tems 3130xl genetic analyzer, with Sequencing Analysis v5.3.1 software and KB Basecaller v1.4 software.
DNA sequence analyses such as contig assembly, alignment of multi-ple contigs, and gene sequence comparisons were performed with Se-quencher v4.8 software. The 16S rRNA gene sequences of all strains in the study were compared with rRNA sequences in the Ribosomal Database Project (RDP) (http://rdp.cme.msu.edu) and NCBI GenBank databases by using the Basic Local Alignment Search Tool (BLAST) (19). The rRNA operon copy number for each species was determined from therrnDB database (https://rrndb.umms.med.umich.edu) (20,21). For sequence comparisons and analyses, the multiple 16S rRNA gene sequences within a single genome were downloaded from GenBank when the whole ge-nome sequence was available (Table 1). Following in-house DNA se-quence generation, basecaller data, in the form of an electropherogram for each 16S rRNA gene sequence, were visually inspected to identify posi-tions at which more than one peak was recorded at a single nucleotide position (indicating the presence of a SNP). Unless otherwise indicated, numbering of the nucleotide position of each SNP was assigned on the basis of the consensus sequence for the 13 known 16S rRNA genes in the genome of reference strainB. cereusATCC 14579 (GenBank accession no.
NC_004722). The presence or absence of all identified SNPs that were used to differentiateB. anthracisfromB. cereusandB. thuringiensiswas confirmed by repeat DNA sequence analysis using independent PCR products from primers E786F and E1541R.
RESULTS
Sequence variations among multiple rRNA operons.The 16S
rRNA gene sequences of 50 strains ofBacillusspp., includingB.
anthracis(n⫽14),B. cereus(n⫽18),B. thuringiensis(n⫽16),
Bacillus mycoides(n⫽1), andBacillus licheniformis(n⫽1), were determined. The ability of basecaller software to detect sequence variations was investigated by comparing computer-generated se-quences with visually inspected electropherograms. Visual
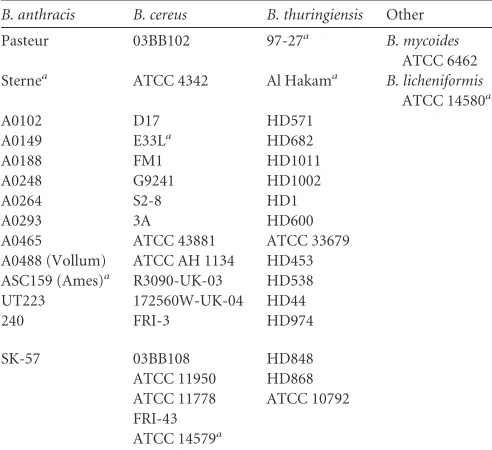
exam-TABLE 1B. cereusgroup species and strains of each species from which 16S rRNA gene sequences were analyzed and compared in this study
B. anthracis B. cereus B. thuringiensis Other
Pasteur 03BB102 97-27a B. mycoides
ATCC 6462 Sternea ATCC 4342 Al Hakama B. licheniformis
ATCC 14580a
A0102 D17 HD571
A0149 E33La HD682
A0188 FM1 HD1011
A0248 G9241 HD1002
A0264 S2-8 HD1
A0293 3A HD600
A0465 ATCC 43881 ATCC 33679 A0488 (Vollum) ATCC AH 1134 HD453 ASC159 (Ames)a R3090-UK-03 HD538
UT223 172560W-UK-04 HD44
240 FRI-3 HD974
SK-57 03BB108 HD848 ATCC 11950 HD868 ATCC 11778 ATCC 10792 FRI-43
ATCC 14579a
a16S rRNA gene sequences from each rRNA operon within the genome were
downloaded from GenBank database.
Hakovirta et al.
on May 16, 2020 by guest
http://jcm.asm.org/
[image:2.585.40.286.87.312.2]ination of electropherograms generated by sequencing of 16S rRNA gene PCR products that were a mixture of amplicons from 16S rRNA genes encoded in a single genome revealed multiple peaks at single nucleotide positions, indicating that one or more of
the 16S rRNA genes contained a SNP (Fig. 1AandB). Based on a
comparison of individual 16S rRNA gene sequences within a whole genome sequence, the height of each of the multiple peaks at one nucleotide position was proportional to the number of gene copies that contained the SNP. As an example, in a strain that contained thirteen 16S rRNA genes and only one copy with a SNP at a specific nucleotide position, the minor peak generated by that base was proportionately smaller than the peak representing the base present at that position in the other 12 copies. In some cases, a minor peak was difficult to differentiate from background noise,
as observed forB. cereusstrain E33L at nucleotide position 1143, at
which only one of the 16S rRNA gene copies had C instead of T (Fig. 1A). When more than one copy of the multiple genes con-tained the SNP, however, the resulting peak was more prominent
and was easier to detect. At nucleotide position 1148 ofB. cereus
strain E33L, A was present in four copies of the gene and T was
present in the other nine copies of the gene (Fig. 1A). Also, we
found that a single nucleotide position might have more than two peaks present; however, the maximum number of peaks at a single position is, of course, limited to four (A, C, T, and G). An example of more than two peaks at one nucleotide position was seen for
position 204 ofBacillus mycoides ATCC 6462; the various 16S
rRNA gene copies contained G, A, or T (Fig. 1B), producing three
overlapping peaks. Since the multiple 16S rRNA gene sequences of this strain have not been individually analyzed, however, the exact nucleotide ratios cannot be determined, although the electro-pherogram indicates that G is the prominent nucleotide at this position.
In addition to SNPs, indels were identified among the multiple
16S rRNA gene copies in a genome (Fig. 2). When an indel occurs
in one or more of the 16S rRNA genes in a genome, the DNA sequences of the 16S rRNA genes are no longer synchronized
downstream from that position in the electropherogram. The sequence reported by the basecaller software then appears as a mixed or “dirty” sequence, indicated by N throughout the quence. In comparison with the individual rRNA gene
se-quences from the completed genome ofB. licheniformisATCC
14580, the start of the shift was located at position 194 (indicated
by the arrow inFig. 2), with respect to the consensus sequence of
the 16S rRNA genes for the same strain (GenBank accession no.
CP000002). Indels were also observed in electropherograms
gen-erated with the E1541R primer for 13 strains ofB. anthracis, 8
strains ofB. cereus, and 9 strains ofB. thuringiensisin this study
(data not shown).
Comparison of DNA sequence basecaller software.The 16S rRNA gene sequences generated with the ABI 3130xl genetic ana-lyzer and viewed with Applied Biosystems DNA Sequence Analy-sis Software v5.3.1 were compared with those viewed with Chro-mas Lite v2.01, DNASTAR Lasergene 8, and Sequencher v4.8
software (Fig. 3). Electropherograms displayed using Chromas
Lite (Fig. 3A), ABI Sequencing Analysis (Fig. 3B), and DNASTAR
Lasergene 8 (Fig. 3C) software were similar in appearance. SNPs
represented by multiple peaks at a single nucleotide position were usually pronounced and not difficult to detect visually. However, small multiple peaks were sometimes difficult to dis-tinguish from background noise. Sequencher provided more clearly defined peaks, with almost no background noise, but the software also reduced the peak heights of the bases called, and multiple peaks at one base position were more difficult to
de-tect by visual examination (Fig. 3D).
Species discrimination by visual analysis of electrophero-grams for SNPs.BLAST and RDP databases were used to analyze
the consensus sequences of 16S rRNA genes from 14B. anthracis
strains, 18B. cereusstrains, and 16B. thuringiensisstrains. These
databases were capable of confirming the sequences to the genus level but not to the species level; this was because the sequences
wereⱖ98.7% identical, which is considered the species
identifica-tion standard (22). However, when the electropherograms were
FIG 1Representative electropherograms of 16S rRNA gene sequences with multiple peaks at a single nucleotide position due to SNPs in one or more of the multiple 16S rRNA genes within the genome. Arrows, positions of double peaks inB. cereusE33L (A) and triple peaks inB. mycoidesATCC 6462 (B). The size of each peak at these positions is dependent on the number of operons with the SNP. Nucleotide position numbers are relative to those in theB. cereusATCC 14579 gene sequence.
on May 16, 2020 by guest
http://jcm.asm.org/
visually inspected for SNPs, allB. anthracisstrains had a double peak (G and A) at nucleotide position 1139 (based on sequences
generated with both the E786F and E1541R primers), while theB.
cereusandB. thuringiensisstrains had a single peak (G) at this
position (Table 2). In addition, sequence data from the automated
basecaller analysis indicated that 4 of the 14 strains ofB. anthracis
were assigned G as the only peak at this position (Table 2). As a
consequence, this nucleotide position would not have been
iden-tified as a SNP that could be used to differentiateB. anthracisfrom
B. cereusandB. thuringiensiswithout visual inspection of the se-quence data. Additional data from bioinformatic analyses of 54 publicly available, assembled, closed circular genome sequences
revealed that all 54 strains ofB. anthracishad 16S rRNA genes with
the mixed G/A variation at position 1139 and none of the available
B. cereusorB. thuringiensisgenomes had this combination of nu-cleotides at that position (data not shown).
Although a previous publication reported that dual peaks (A
and T) at nucleotide position 1148 were unique toB. anthracis
(16), 6 of 18 strains ofB. cereusand 4 of 16 strains ofB.
thurin-giensisin the current study also had dual peaks (A and T) at this
position (Table 2), based on our visual inspection of the
electro-pherograms. Automated basecaller software data indicated only
one strain ofB. cereusand one strain ofB. thuringiensiswith an
ambiguity at position 1148; for all other strains, a single peak (either A or T) was detected.
DISCUSSION
For decades, 16S rRNA gene sequencing has been a widely used method for the accurate identification of bacterial isolates in
clin-ical microbiology laboratories (5). In some instances, 16S rRNA
gene sequencing continues to outperform traditional culture-based methods or non-16S molecular methods for identification
of clinically relevant bacterial pathogens (23). Recently, a clinically
validated next-generation sequencing-based approach that uses targeted 16S rRNA gene sequencing for the diagnostic identifica-tion of bacterial species directly from clinical samples was
de-scribed (24).
Since the introduction of high-throughput DNA sequencing technologies and their applications to metagenomics, the impor-tance of 16S rRNA sequence analysis for bacterial identification has not diminished but increased. Next-generation sequencing is used in large-scale metagenomic studies of microbial
communi-ties for culture-independent taxonomic classification (25) and for
whole-genome sequence characterization of isolates. Metag-enomic sequence analysis relies on operational taxonomic units (OTUs), i.e., the clustering of similar 16S rRNA gene sequences of closely related organisms, to characterize microbial communities. These OTUs are employed to determine microbial diversity, which was defined by the Human Microbiome Project Consor-tium as the number and abundance distribution of bacteria within
a microbiome (26). For pure cultures of a single species,
whole-FIG 2Electropherogram illustrating the loss of synchronicity that occurs when there is a nucleotide deletion or insertion within one or more of the 16S rRNA genes among the multiple rRNA operons in the genome.B. licheniformisATCC 14580 has seven rRNA operons, and the individual gene sequences are available from GenBank (GenBank accession no.CP000002). These sequence data were generated from a DNA template amplified with 16S rRNA universal primers. Arrow, position of the indel.
Hakovirta et al.
on May 16, 2020 by guest
http://jcm.asm.org/
[image:4.585.76.513.67.369.2]genome sequences generated by platforms that produce short
reads (⬍250 bp) are insufficient for assembly of the multiple
in-dividual copies of the 16S rRNA genes, which are about 1,500 bp in length. A combination of the short reads and longer reads from other platforms is needed to assemble the individual genes and to identify any SNPs that may be present in the various copies. Sanger sequencing of the 16S rRNA gene is more commonly used
for rapid identification of unknown isolates from clinical speci-mens and environmental samples and for confirmation of variant sequence data that might have been generated by the higher-throughput methods. Although interpretative criteria for bacte-rial identification by 16S rRNA gene sequence analysis are avail-able, they do not provide sufficient detail regarding the intragenomic complexities of the rRNA operons of a species, and
[image:5.585.47.540.67.438.2]FIG 3Relative peak sizes on a computer screen when a sequence data file is displayed by four different software programs, i.e., Chromas Lite v2.01 (A), ABI Sequencing Analysis software v5.3.1 (B), DNASTAR Lasergene 8 (C), and Sequencher v4.8 (D). The sequence presented is the 16S rRNA gene sequence fromB. mycoidesATCC 6462 generated with the universal oligonucleotide primer E8F.
TABLE 2Results from basecaller software and from base identification by visual inspection of electropherograms
Species
No. of strains
No. of strains with resulta
At nucleotide position 1139 At nucleotide position 1148
Basecaller
Visual
inspection Basecaller Visual inspection
G N G R T A N T A W
B. anthracis 14 4 10 0 14 0 0 14 0 0 14
B. cereus 18 18 0 18 0 6 11 1 3 9 6
B. thuringiensis 16 16 0 16 0 7 8 1 5 7 4
a
Results represent data from two independent sequencing reactions using primer E786F. N, any nucleotide (basecaller assignment was not consistent from run to run for independent sequencing reactions); R, IUPAC code for A or G; W, IUPAC code for T or A.
on May 16, 2020 by guest
http://jcm.asm.org/
[image:5.585.41.544.603.708.2]there is no emphasis on the importance of visual evaluation and interpretation of gene sequence data presented by basecaller
soft-ware (27). Also, many of the 16S rRNA gene sequences in the
databases are incomplete, covering only areas of the genes that are designated hypervariable regions. Partial 16S rRNA gene se-quences are limited in their utility for genus or species
identifica-tion (28).
Reference sequences for 16S rRNA genes are available in pub-licly accessible databases such as the International Nucleotide Se-quence Database Collaboration (INSDC) (i.e., DDBJ, EMBL, and GenBank) and RDP databases. Between 1992 and 2015, the num-ber of 16S rRNA gene sequences in the RDP database increased from approximately 500 to more than 3.2 million. However, the quality of the sequences submitted to these databases is highly variable, due to the lack of universal DNA sequence quality
stan-dards (29–31). In 2008, according to the RDP, approximately 10%
of the archeal and bacterial sequences in the database were
sus-pected to be of poor quality (32). Since then, all sequences pass
through a quality control program prior to addition to the RDP database, to minimize the impact of low-quality data. Even though some quality controls are now in place, many DNA se-quences in public databases still contain ambiguities (N) and un-corrected sequencing errors.
The number of rRNA operons, and thus the number of 16S rRNA genes, varies across species and even among different strains within a given species. The rRNA operon copy number is generally correlated with the growth characteristics of a microbe, based on various environmental conditions. When exposed to a favorable environment and plentiful nutrients, microbial species with nu-merous rRNA operons grow more rapidly than species with few
rRNA operons (20). TherrnDB database indicates that 16S rRNA
gene copy numbers within a genome vary from 1 to 15 copies
across species of bacteria (20,21).Borrelia burgdorferi, Coxiella
burnetii, and various species ofMycobacteriaandRickettsiaare known to have a single chromosomal rRNA operon. Examples of species known to contain 10 or more 16S rRNA operons include
Bacillusspp. such asB. anthracis(11 copies),B. cereus(11 to 14
copies),Bacillus subtilis(10 copies),B. thuringiensis(13 or 14
cop-ies), andBacillus weihenstephanensis(14 copies) andClostridium
spp. such asClostridium paradoxum(15 copies),Clostridium
bei-jerinckii(14 copies),Clostridium perfringens(13 copies), and Clos-tridium botulinum(11 copies). The number of 16S rRNA operons
may also vary within a species, as indicated above forB. cereusand
B. thuringiensis.
When 16S rRNA gene variations such as SNPs or indels are present in a genome, multiple peaks (two or more) are displayed at a single nucleotide position in the electropherogram or the se-quence loses synchronicity. As a result, the DNA sese-quence makes an abrupt change following an indel (from “clean” to “dirty”), as
we have shown. Pettersson et al. (12,33) and Reischl et al. (11)
observed in the 1990s that such data suggested intragenomic
vari-ations among the 16S rRNA gene sequences of theMycoplasma
mycoidescluster andMycobacterium celatum, respectively. Since that time, reliance on automated analysis by basecaller software has become routine. It is understandable that automated methods are necessary with the rapid proliferation of benchtop sequencing platforms, but it should be recognized that there is the possibility that potentially important information available in a DNA se-quence electropherogram may be lost with reliance solely on data from automated basecaller software. As our findings show,
base-caller software does not consistently detect and report all of the SNPs present in a sequence and does not have the ability to rec-ognize when an insertion or deletion is responsible for what ap-pears to be mixed or overlapping DNA sequences. Visual inspec-tion of the electropherogram can locate the posiinspec-tion of a sequence shift that results when a deletion or insertion among the multiple 16S rRNA genes within a genome interrupts the previously syn-chronized sequence data.
There are numerous commercial software programs available for automated Sanger DNA sequence analysis. All of the software programs present the sequence data in an electropherogram, with software-specific characteristics that may assist or impair the abil-ity to visually detect SNPs. Chromas Lite v2.01 and DNASTAR Lasergene 8 were comparable to the ABI Sequencing Analysis v5.3.1 software of the ABI 3130xl genetic analyzer. However, elec-tropherograms observed with Sequencher had relatively lower peak heights overall, which resulted in some loss of detail. Some characteristics can be adjusted by the operator when setting pref-erences for the software. Sequencher presents an electrophero-gram as multiple rows on the computer screen, which compresses the peak height, while the other software programs open an elec-tropherogram as a single row on the screen. It is important to be aware of the possible impact of different software programs on the appearance of electropherograms when performing visual analy-ses to detect SNPs and indels.
TheBacillus cereusgroup poses a serious challenge to the use of 16S rRNA gene sequence data for discrimination between the
highly related species. Previously, Sacchi et al. reported thatB.
anthraciscan be rapidly differentiated fromB. cereusandB. thu-ringiensisby 16S rRNA gene sequencing, through analysis of
se-quence differences among the 16S rRNA genes (16). According to
their basecaller software, nucleotide position 1146 (correspond-ing to our position 1148) was always reported as a mixture of A
and T for 32B. anthracisstrains, while this was not the case for 10
B. cereusstrains and 11B. thuringiensisstrains. Our results concur
with their results forB. anthracisstrains; the basecaller software
indicated an ambiguity character (N) at this position, and visual inspection of the electropherograms confirmed dual peaks (A and
T) at this position. ForB. cereusE33L andB. thuringiensis97-27,
however, the basecaller software reported possible multiple peaks at this position and, when electropherograms for all strains were
visually inspected, fiveB. cereusstrains and threeB. thuringiensis
strains also had A and T peaks. Therefore, dual peaks of A and T at nucleotide position 1148 are not necessarily reliable for identify-ingB. anthracis. In contrast, in visual analyses of the
electrophero-grams for the numerous strains in this study,B. anthracishad dual
G and A peaks at position 1139 whileB. cereusandB. thuringiensis
had only G, and this position appears to be more reliable for
iden-tifyingB. anthracis. This result was supported by bioinformatic
analysis of the publicly available genome sequences for these spe-cies.
The 16S rRNA consensus gene sequence cannot always defin-itively classify an organism to the species level or discriminate between two closely related species. As demonstrated in this study, 16S rRNA gene SNPs within a genome can facilitate this discrim-ination. High-quality sequences that include SNPs would improve the existing public databases if SNP locations were included and the appropriate bases were designated by using IUPAC nucleotide notations (e.g., W, R, and Y). Unfortunately, many sequences in the databases still contain N characters, which suggests that many
Hakovirta et al.
on May 16, 2020 by guest
http://jcm.asm.org/
investigators have not visually examined the electropherograms. It is difficult to know exactly why this is not done, but some of the reasons might include the additional time required, the percep-tion that it is too laborious a task, a lack of proficiency in analytical
skills required for data analysis (30), and a lack of guidelines and
quality standards for DNA sequence data (29). With the fast pace
at which sequence data are currently being generated, data analy-sis has become the rate-limiting step in DNA sequence analyanaly-sis. It has been proposed that automatic basecalling analysis is needed to eliminate human error or subjectivity, with the assumption that
computer software would provide more reliable sequences (29–
31). It is understood that an automated analysis approach may be
sufficient when multiple gene sequences are analyzed for species identification. However, if the 16S rRNA gene sequence alone is being used for identification or if the 16S rRNA gene sequence data are to be submitted to a public database, N characters should be resolved and any ambiguous bases should be confirmed with additional data from the complementary strand. In the case of
closely related species such as theBacillus cereusgroup, the
auto-mated basecalling that results in a consensus sequence for the 16S rRNA genes may lack potentially important information that is available in the electropherograms. High-quality DNA sequences with SNP analysis could increase the power of databases to facili-tate bacterial identification and discrimination between closely related species.
ACKNOWLEDGMENTS
We thank James Gathany for assisting with the electropherogram figures, David Sue and Andrew Conley for bioinformatics support, and Stephan A. Morse for critical review of the manuscript.
An appointment to the Research Participation Program at the Centers for Disease Control and Prevention, administered by the Oak Ridge In-stitute for Science and Education, for J.R.H., was provided through an interagency agreement between the U.S. Department of Energy and the Centers for Disease Control and Prevention.
We declare no competing financial interests.
J.R.H. and S.P. performed sequence determinations and analysis, D.H. and S.P.P. contributed to study design and the acquisition of DNA sam-ples, L.M.W. contributed to sequence analysis, and J.R.H. and L.M.W. wrote the manuscript.
The findings and conclusions in this report are those of the authors and do not necessarily represent the views of the Centers for Disease Control and Prevention or the U.S. Department of Homeland Security. The use of trade names and commercial sources is for identification pur-poses only and does not imply endorsement by the U.S. Public Health Service, the U.S. Department of Health and Human Services, or the U.S. Department of Homeland Security.
FUNDING INFORMATION
This work was funded by Department of Homeland Security USA (HSHQDC-09-X-00240).
REFERENCES
1.Woese CR, Fox GE. 1977. Phylogenetic structure of the prokaryotic domain: the primary kingdoms. Proc Natl Acad Sci U S A74:5088 –5090.
http://dx.doi.org/10.1073/pnas.74.11.5088.
2.Woese CR, Kandler O, Wheelis ML.1990. Towards a natural system of organisms: proposal for the domains Archaea, Bacteria, and Eucarya. Proc Natl Acad Sci U S A87:4576 – 4579.http://dx.doi.org/10.1073/pnas.87.12 .4576.
3.Hug LA, Baker BJ, Anantharaman K, Brown CT, Probst AJ, Castelle CJ, Butterfield CN, Hernsdorf AW, Amano Y, Ise K, Suzuki Y, Dudek N, Relman DA, Finstad KM, Amundson R, Thomas BC, Banfield JF.2016.
A new view of the tree of life. Nat Microbiol1:16048.http://dx.doi.org/10 .1038/nmicrobiol.2016.48.
4.Anda M, Ohtsubo Y, Okubo T, Sugawara M, Nagata Y, Tsuda M, Minamisawa K, Mitsui H.2015. Bacterial clade with the ribosomal RNA operon on a small plasmid rather than the chromosome. Proc Natl Acad Sci U S A112:14343–14347.http://dx.doi.org/10.1073/pnas.1514326112. 5.Woo PCY, Lau SKP, Teng JLL, Tse H, Yuen KY.2008. Then and now: use of 16S rDNA gene sequencing for bacterial identification and discov-ery of novel bacteria in clinical microbiology laboratories. Clin Microbiol Infect14:908 –934.http://dx.doi.org/10.1111/j.1469-0691.2008.02070.x. 6.Ludwig W, Klenk H-P.2001. Overview: a phylogenetic backbone and
taxonomic framework of prokaryotic systematics, p 49 – 65.InBoone DR, Castenholz RW, Garrity GM (ed), Bergey’s manual of systematic bacteri-ology, 2nd ed. Springer, New York, NY.
7.Gee JE, Sacchi CT, Glass MB, De BK, Weyant RS, Levett PN, Whitney AM, Hoffmaster AR, Popovic T.2003. Use of 16S rRNA gene sequencing for rapid identification and differentiation ofBurkholderia pseudomallei
andB. mallei. J Clin Microbiol41:4647– 4654.http://dx.doi.org/10.1128 /JCM.41.10.4647-4654.2003.
8.Ash C, Farrow JAE, Dorsch M, Stackebrandt E, Collins MD. 1991. Comparative analysis ofBacillus anthracis,Bacillus cereus, and related spe-cies on the basis of reverse transcriptase sequencing of 16S ribosomal RNA. Int J Syst Bacteriol41:343–346.http://dx.doi.org/10.1099/00207713 -41-3-343.
9.Helgason E, Okstad OA, Caugant DA, Johansen HA, Fouet A, Mock M, Hegna I, Kolsto AB.2000.Bacillus anthracis,Bacillus cereus, andBacillus thuringiensis: one species on the basis of genetic evidence. Appl Environ Microbiol66:2627–2630.http://dx.doi.org/10.1128/AEM.66.6.2627-2630 .2000.
10. Acinas SG, Marcelino LA, Klepac-Ceraj V, Polz MF.2004. Divergence and redundancy of 16S rRNA sequences in genomes with multiplerrn
operons. J Bacteriol186:2629 –2635.http://dx.doi.org/10.1128/JB.186.9 .2629-2635.2004.
11. Reischl U, Feldmann K, Naumann L, Gaugler BJ, Ninet B, Hirschel B, Emler S.1998. 16S rRNA sequence diversity inMycobacterium celatum
strains caused by presence of two different copies of 16S rRNA gene. J Clin Microbiol36:1761–1764.
12. Pettersson B, Leitner T, Ronaghi M, Bolske G, Uhlen M, Johansson KE.
1996. Phylogeny of theMycoplasma mycoidescluster as determined by sequence analysis of the 16S rRNA genes from the two rRNA operons. J Bacteriol178:4131– 4142.
13. Moreno C, Romero J, Espejo RT.2002. Polymorphism in repeated 16S rRNA genes is a common property of type strains and environmental isolates of the genusVibrio. Microbiology148:1233–1239.http://dx.doi .org/10.1099/00221287-148-4-1233.
14. Pei AY, Oberdorf WE, Nossa CW, Agarwal A, Chokshi P, Gerz EA, Jin ZD, Lee P, Yang LY, Poles M, Brown SM, Sotero S, DeSantis T, Brodie E, Nelson K, Pei ZH.2010. Diversity of 16S rRNA genes within individual prokaryotic genomes. Appl Environ Microbiol76:3886 –3897.http://dx .doi.org/10.1128/AEM.02953-09.
15. Candelon B, Guilloux K, Ehrlich SD, Sorokin A.2004. Two distinct types of rRNA operons in theBacillus cereusgroup. Microbiology150:
601– 611.http://dx.doi.org/10.1099/mic.0.26870-0.
16. Sacchi CT, Whitney AM, Mayer LW, Morey R, Steigerwalt A, Boras A, Weyant RS, Popovic T.2002. Sequencing of 16S rRNA gene: a rapid tool for identification ofBacillus anthracis. Emerg Infect Dis8:1117–1123.
http://dx.doi.org/10.3201/eid0810.020391.
17. Hoffmaster AR, Meyer RF, Bowen MP, Marston CK, Weyant RS, Barnett GA, Sejvar JJ, Jernigan JA, Perkins BA, Popovic T. 2002. Evaluation and validation of a real time polymerase chain reaction assay for rapid identification ofBacillus anthracis. Emerg Infect Dis8:1178 – 1182.http://dx.doi.org/10.3201/eid0810.020393.
18. Baker GC, Smith JJ, Cowan DA.2003. Review and re-analysis of domain-specific 16S primers. J Microbiol Methods55:541–555.http://dx.doi.org /10.1016/j.mimet.2003.08.009.
19. Altschul SF, Gish W, Miller W, Myers EW, Lipman DJ.1990. Basic local alignment search tool. J Mol Biol215:403– 410.http://dx.doi.org/10.1016 /S0022-2836(05)80360-2.
20. Klappenbach JA, Dunbar JM, Schmidt TM.2000. rRNA operon copy number reflects ecological strategies of bacteria. Appl Environ Microbiol
66:1328 –1333.http://dx.doi.org/10.1128/AEM.66.4.1328-1333.2000. 21. Lee ZMP, Bussema C, Schmidt TM. 2009. rrnDB: documenting the
on May 16, 2020 by guest
http://jcm.asm.org/
number of rRNA and tRNA genes in bacteria and archaea. Nucleic Acids Res37:D489 –D493.http://dx.doi.org/10.1093/nar/gkn689.
22. Stackebrandt E, Ebers J. 2006. Taxonomic parameters revisited: tar-nished gold standards. Microbiol Today33:152–155.
23. Srinivasan R, Karaoz U, Volegova M, MacKichan J, Kato-Maeda M, Miller S, Nadarajan R, Brodie E, Lynch S.2015. Use of 16S rRNA gene for identi-fication of a broad range of clinically relevant bacterial pathogens. PLoS One
10:e0117617.http://dx.doi.org/10.1371/journal.pone.0117617.
24. Salipante SJ, Sengupta DJ, Rosenthal C, Costa G, Spangler J, Sims EH, Jacobs MA, Miller SI, Hoogestraat DR, Cookson BT, McCoy C, Matsen FA, Shendure J, Lee CC, Harkins TT, Hoffman NG.2013. Rapid 16S rRNA next-generation sequencing of polymicrobial clinical samples for diagnosis of complex bacterial infections. PLoS One8:e65226.http://dx .doi.org/10.1371/journal.pone.0065226.
25. Armougom F, Raoult D.2009. Exploring microbial diversity using 16S rRNA high-throughput methods. J Comput Sci Syst Biol2:74 –92. 26. Human Microbiome Project Consortium.2012. Structure, function and
diversity of the healthy human microbiome. Nature486:207–214.http: //dx.doi.org/10.1038/nature11234.
27. Clinical and Laboratory Standards Institute.2008. Interpretive criteria for identification of bacteria and fungi by DNA target sequencing; ap-proved guideline. CLSI document MM18-A. Clinical and Laboratory Standards Institute, Wayne, PA.
28. Vinje H, Almoy T, Liland KH, Snipen L.2014. A systematic search for discriminating sites in the 16S ribosomal RNA gene. Microb Inform Exp
4:2.http://dx.doi.org/10.1186/2042-5783-4-2.
29. Underwood A, Green J.2011. Call for a quality standard for sequence-based assays in clinical microbiology: necessity for quality assessment of sequences used in microbial identification and typing. J Clin Microbiol
49:23–26.http://dx.doi.org/10.1128/JCM.01918-10.
30. Ahmad-Nejad P, Dorn-Beineke A, Pfeiffer U, Brade J, Geilenkeuser WJ, Ramsden S, Pazzagli M, Neumaier M.2006. Methodologic European ex-ternal quality assurance for DNA sequencing: the EQUALseq program. Clin Chem52:716 –727.http://dx.doi.org/10.1373/clinchem.2005.061572. 31. Patton SJ, Wallace AJ, Elles R.2006. Benchmark for evaluating the
quality of DNA sequencing: Proposal from an international external qual-ity assessment scheme. Clin Chem52:728 –736.http://dx.doi.org/10.1373 /clinchem.2005.061887.
32. Cole JR, Wang Q, Cardenas E, Fish J, Chai B, Farris RJ, Kulam-Syed-Mohideen AS, McGarrell DM, Marsh T, Garrity GM, Tiedje JM.2009. The Ribosomal Database Project: improved alignments and new tools for rRNA analysis. Nucleic Acids Res37:D141–D145.http://dx.doi.org/10 .1093/nar/gkn879.
33. Pettersson B, Johansson KE, Uhlen M.1994. Sequence analysis of 16S rRNA from mycoplasmas by direct solid-phase DNA sequencing. Appl Environ Microbiol60:2456 –2461.
Hakovirta et al.