Probabilistic Graphical Modeling for Software Product Lines
A Framework for Modeling and Reasoning under Uncertainty
by
Anas Almharat
A thesis submitted in partial satisfaction of the
requirements for the degree of
Doctor of Philosophy
Department of Computer Science and Informatics
In
School of Architecture, Computing and Engineering
of the
University of East London
Supervisory team
Dr. Rabih Bashroush
Dr. Usman Naeem
Probabilistic Graphical Modeling in Software Product Lines
A Framework for Modelling and Reasoning under uncertainty
Copyright 2016 by
1
Abstract
This work provides a holistic investigation into the realm of feature modeling within software product lines. The work presented identifies limitations and challenges within the current feature modeling approaches. Those limitations include, but not limited to, the dearth of satisfactory cognitive presentation, inconveniency in scalable systems, inflexibility in adapting changes, nonexistence of predictability of models behavior, as well as the lack of probabilistic quantification of model’s implications and decision support for reasoning under uncertainty. The work in this thesis addresses these challenges by proposing a series of solutions. The first solution is the construction of a Bayesian Belief Feature Model, which is a novel modeling approach capable of quantifying the uncertainty measures in model parameters by a means of incorporating probabilistic modeling with a conventional modeling approach. The Bayesian Belief feature model presents a new enhanced feature modeling approach in terms of truth quantification and visual expressiveness. The second solution takes into consideration the unclear support for the reasoning under the uncertainty process, and the challenging constraint satisfaction problem in software product lines. This has been done through the development of a mathematical reasoner, which was designed to satisfy the model constraints by considering probability weight for all involved parameters and quantify the actual implications of the problem constraints. The developed Uncertain Constraint Satisfaction Problem approach has been tested and validated through a set of designated experiments.
Profoundly stating, the main contributions of this thesis include the following:
• Develop a framework for probabilistic graphical modeling to build the purported Bayesian belief feature model.
• Extend the model to enhance visual expressiveness throughout the integration of colour degree variation; in which the colour varies with respect to the predefined probabilistic weights.
• Enhance the constraints satisfaction problem by the uncertainty measuring of the parameters truth assumption.
i
ii
Contents
Contents ii
List Of Figures v
List Of Tables
vi
List Of Abbreviations x
Part I Motivation 1
1
Introduction 2
1.1. “DISCONTENT IS THE FIRST NECESSITY OF PROGRESS” ... 2
1.2. CHAOS ISN’T JUST A THEORY; IT IS LIKEWISE A LADDER ... 2
1.3. PROBLEM STATEMENT ... 3
1.4. DESIGNATED APPROACH ... 4
1.5. GOALS AND CONTRIBUTIONS ... 6
iii
PART II Introduction
9
2
Background 10
2.1. SOFTWARE PRODUCT LINES: PITFALL OF ECONOMY AND RISE OF PRODUCT LINES ... 11
2.1.1. The Pitfall of Economics ... 11
2.1.2. Mass Customization Notion ... 12
2.1.3. Mass Customization and Mass Production ... 13
2.1.4. Mass customization Essentials Kit ... 14
2.2. THE PROMINENCE OF SOFTWARE PRODUCT LINES ... 15
2.2.1. SPL: Why and Wherefores ... 15
2.2.2. Myth versus Reality: SPLE as Lego construction ... 21
2.2.3. Drawbacks of SPLE ... 22
PART III Literature Review
23
3
Managing Variabilities 24
3.1. SPLE: A TALE OF VARIABILITIES ... 24
3.1.1. Domain engineering ... 25
3.1.2. Application engineering ... 25
3.1.3. Management ... 26
3.2. COMMONALITIES AND VARIABILITIES ... 27
3.3. MODELING SOFTWARE PRODUCT LINES’VARIABLES ... 29
3.3.1. Feature Modeling ... 30
3.3.2. Decision Modeling ... 31
3.3.3. Orthogonal Variability Modeling ... 32
3.3.4. Other Modeling Approaches ... 33
4
Feature Modeling in Depth 34
4.1.FEATURE MODELING:AN EXPLICATION ... 35
4.1.1. Review method ... 35
iv
4.1.3. Inclusion and exclusion criteria ... 36
4.1.4. Data basis and selection criteria ... 36
4.1.5. Data Hunt and assessment ... 38
4.1.6. Review Outcome ... 40
4.2.FEATURE MODELING EXPLORATION ... 44
4.2.1. Feature modeling notations ... 45
4.3. EVOLUTION AND EVALUATION OF FMS ... 50
4.3.1. Feature Oriented Domain Analysis ... 53
4.3.2. Feature-Oriented Reuse Method ... 54
4.3.3. FeatuRSEB ... 55
4.3.4. Generative programming ... 57
4.3.5. Van Gurp and Bosch Feature Model ... 58
4.4. DRAWBACKS OF FEATURE MODELING ... 59
4.4.1. Assessment criteria ... 59
4.4.2. Appraisal and results ... 61
4.5. AUTOMATED ANALYSIS OF FEATURE MODELS ... 66
4.5.1. Constraint Satisfaction Problem solver ... 67
4.5.2. SAT solvers ... 70
4.5.3. Binary Decision Diagram solvers ... 71
4.6. CONCLUDING REMARKS ... 71
PART IV Modeling
73
5
Modeling Under Uncertainties 74
5.1THE NOTION OF FEATURE MODEL SEMANTIC ... 76
5.1.1. Feature Model Prominence ... 76
5.1.2. Relationships in Feature Model ... 77
5.2. THE NEED FOR NEW MODEL ... 80
5.3BAYESIAN MODELING ... 82
5.3.1. Bayesian Belief Feature Model BBFM ... 85
5.4.MEASURING THE UNCERTAINTY LEVEL ... 94
v
5.5. EXTENDED BBFM AND BELIEF INTENSIFICATION ... 114
5.5.1. Physics of Visual Expressiveness in BBFM ... 115
5.5.2. Use of “colour variation” to project the “belief variation” ... 117
5.6. FURTHER DISCUSSION AND APPLICABILITY ... ERROR!BOOKMARK NOT DEFINED. 5.7. SUMMARY ... ERROR!BOOKMARK NOT DEFINED.
PART V Reasoning
128
6
Reasoning Under Uncertainties 129
6.1.INTRODUCTION ... 129
6.1.1. Further Highlights ... 132
6.2.UNCERTAIN CONSTRAINTS SATISFACTION PROBLEM ... 133
6.3.PROBLEM EXTRACTION AND CONSTRAINTS FACTORIZATION ... 137
6.4.OPTIMIZING UNDER UNCERTAINTY ... 148
6.5. SEARCHING FOR OPTIMAL DECISION ... 151
6.6. EXPERIMENTAL RESULTS ... 157
6.7. DISCUSSION ... 170
6.5. SUMMARY AND DISCUSSION ... 173
PART VI Conclusion
174
7
Conclusion 175
7.1.FUTURE WORK ... 177
vi
List of Figures
2. 1 Customized 3D printed vases ... 12
2. 2 Mass production versus Mass customization dialogues ... 14
2. 3 Transition from conventional production to product lines ... 15
2. 4 Percentage of defects per number of reviews and testing ... 18
2. 5 Costs of SPL vs cost of single production system ... 19
2. 6 Time to market for SPL vs single production system ... 20
2. 7 Productivity of SPL vs productivity of single system ... 20
2. 8 SPL Lego myth ... 21
3. 1 Scheme of Software Product Lines Engineering ... 26
3. 2 Domain engineering versus Application engineering ... 29
3. 3 High heterogeneity of variability modeling notations ... 29
3. 4 Suggested Feature model for 3D Printer ... 30
3. 5 Examples of Decision modeling for 3D printers ... 31
3. 6 Suggested Orthogonal variability model for 3D printer ... 32
3. 7 Simplified UML Use case diagram for the 3D printer ... 33
4. 1 Review Data assessment ... 38
4. 2 Data classification matrix ... 39
4. 3 Feature's definition classification ... 41
vii
4. 5 Feature diagram graphical notations ... 45
4. 6 Mandatory relationship ... 46
4. 7 Optional relationship ... 46
4. 8 Or relationship ... 47
4. 9 Alternative relationship ... 48
4. 10 Extended feature model notation (Benavides et al., 2009) ... 50
4. 11 Feature models evolution ... 52
4. 12 FODA modeling notation of 3D printer ... 53
4. 13 FORM modeling notation of 3D printer ... 55
4. 14 FeatuRSEB modeling notation of 3D printer ... 56
4. 15 GP modeling notation of 3D printer ... 57
4. 16 Van Gurp and Bosch feature modeling notation of 3D printer ... 58
4. 17 CSP mapping of feature model ... 67
4. 18 CSP mapping of 3D printer feature model ... 69
4. 19 PL mapping of feature model ... 70
5. 2 Graphical Representation of Bayesian Conjunction ... 87
5. 3 Truth Assumption change in Bayesian Conjunction ... 90
5. 4 Graphical Representation of Bayesian Disjunction ... 91
5. 5 Truth Assumption change in Bayesian Disjunction ... 92
5. 6 Graphical Representation of Bayesian Exclusive Disjunction ... 93
5. 7 Truth Assumption change in Bayesian Exclusive Disjunction ... 95
5. 8 Graphical Representation of Bayesian Tautology ... 96
5. 9 Truth Assumption value in Bayesian Tautology ... 97
5. 10 Translation from 3D Printer FM into 3D Printer BBFM ... 93
5. 11 probability of obtaining s number of features in valid Bayesian disjunction ... 106
5. 12 Translation from 3D Printer FM into BBFM 1. ... 113
5. 13 Translation from 3D Printer FM into BBFM 2. ... 116
5. 14 Graphical representation of Bayesian Belief Feature Model. ... 117
5. 15 Graphical anticipation with “use of colour” ... 118
5. 16 Colour use in BBFM ... 119
viii
5. 18 Colour change 2 ... 122
5. 19 Colour change 3 ... 123
6. 1 Measure difference between weight and satweight ... 144
6. 2 Satweight response vs change in number of variables and constraints ... 144
6. 3 Measure difference between weight and satweight ... 150
6. 4 Satweight response versus change in number of variables and constraints ... 151
6. 5 Difference between satweight and weight & Satweight behavior in entry 6.2 ... 160
6. 6 Difference between satweight and weight & Satweight behavior in entry 6.3 ... 161
6. 7 Difference between satweight and weight & Satweight behavior in entry 6.4 ... 162
6. 8 Difference between satweight and weight & Satweight behavior in entry 6.5 ... 163
6. 9 Difference between satweight and weight & Satweight behavior in entry 6.6 ... 164
6. 10 Difference between satweight and weight & Satweight behavior in entry 6.7 ... 165
6. 11 Difference between satweight and weight & Satweight behavior in entry 6.8 ... 166
6. 12 Difference between satweight and weight &Satweight behavior in entry 6.9 ... 167
6. 13 Difference between satweight and weight & Satweight behavior in entry 6.10 .... 168
6. 14 Difference between satweight and weight & Satweight behavior in entry 6.11 ... 169
6. 15 Difference between satweight and weight & Satweight behavior in entry 6.12 .... 169
ix
List of Tables
2. 1 Organizational and Business Advantages of PLs ... 17
2. 2 Drawbacks of SPLE ... 22
4. 1 Feature’s definition in literature ... 40
4. 2 Feature model's definition in literature ... 42
4. 3 Feature modeling notations timeline ... 51
4. 4 FODA notation specifications ... 53
4. 5 FORM notation specifications ... 55
4. 6 FeatuRSEB notation specifications ... 56
4. 7 GP notation specifications ... 57
4. 8 VBFM notation specifications ... 58
6. 1 Dependency Contexts and Constraints Truth Domain ... 141
6. 2 The obtained sat weight value for different Worlds ... 144
6. 4 Obtained success ratio of example 6.1 ... 146
6. 5 Dependency contexts truth domains ... 149
6. 6 Constraints truth domain ... 149
6. 7 Obtained results after the reasoning about all possible worlds ... 150
x
List of Abbreviations
xi
Acknowledgments
There are so many people to whom I owe credit for this thesis. This thesis, and the work it documents, would not have seen the light without the support and the encouragement from those who always had a faith in me.
During my PhD journey, I was blessed to meet new friends from all over the world. Those, who always were there for me and became my family; family to have, and friends to keep for lifetime.
If I may begin by acknowledging my director of study, Dr. Rabih Bashroush, who was always a great inspiration, and would always receive admiration for his hard work, leadership, bright ideas, dedication and encouragement, which he had been continuously providing during my studies. It has become clear to me that having him, as my first supervisor was invaluable bless.
I also would like to thank Dr. Usman Naeem for his incisive feedback during my research.
I would also extend my acknowledgements to Dr. Ameer Al-Nemrat, who was always a great support and pushed me to run the extra miles.
“We can’t solve problems by using the same thinking we used to create them”
Albert Einstein
-1
Part I
2
Chapter 1
Introduction
1.1.
“Discontent is the first necessity of progress”
Thomas Alva Edison (1913-1947), a great influencer and inventor once said: “Restlessness is discontent and discontent is the first necessity of progress. Show me a thoroughly satisfied man and I'll show you a failure”.
This lone quotation ignited the vital spark of my thesis, the same way discontent ignited revolutions, forward thinking and innovation as testified throughout history. Those words of sage ought to be consciously noted, for in them I find the spur of what is starting to take place in the realm of Software Product Line Engineering.
Linking this line of wisdom with Software Product Lines, the discontent with current feature modeling approaches and satisfiability techniques in software product lines, which are coupled withnumerous problems, shaped the backbone in writing this thesis. The necessity to have more optimized feature models with better satisfiability techniques provided eagerness to writing this thesis.
1.2.
Chaos isn’t just a theory; it is likewise a ladder
3
might produce significant and weighty differences at the end. In terms of software product lines ‘SPL’ and Feature Modeling ‘FM’, any trivial error in the process can lead to vast complications and untraceable failures. Then again, every system is subjected to chaos. There’s a reasonable probability and potential for any system, no matter how well designed, to fall into chaos.
Chaos is largely thought to be a drawback, obstacle and negativity. It is often related to mislead, vagueness and disorder. In this dissertation, the term ‘Chaos’ doesn’t merely relate to the chaos theory, instead chaos takes after the lack of precision and the high level of complexity in terms of Data Modeling and automated analysis in software product lines. This Chaos ought to be terminated and advancements must be provided in view of software product lines. In terms of FM techniques, it implies that complexity must cease to exist; the upheavals present in feature modelling discussed in this dissertation are put under the lenses of study aiming to answer some questions and to find more suitable solutions.
1.3.
Problem Statement
As stressed out beforehand, the province of feature modelling, and its automated analysis traverses great challenges and has considerable shortcomings.
In favor of tackling those shortcomings, this dissertation probes four questions scarcely taken into consideration by related literature.
Those questions are researched in depth in the following chapters:
• Probe question 1: What are the modeling techniques used to capture variability in Software product lines engineering?
• Probe question 2: How to quantify the occurrence uncertainty in model parameters, while maintaining the existing semantics?
4
• Probe question 4: How to improve the reasoning efficiency of constraints satisfaction problem, by taking into consideration the degree of uncertainty of model parameters?
1.4.
Designated Approach
A concise view of the methods delivered in our dissertation is presented upon considering the following steps:
Step one:
ExplorationThe first step lays in launching and establishing a meticulous groundwork to the dissertation. This is pertained by means of extensive literature review, in which a state of art of software product lines is presented, with an emphasize on feature modeling to create a roadmap for the succeeding steps and derive queries to be systematically dealt with accordingly:
• An overview to understand software product lines and feature modeling techniques is targeted by investigating current approaches of feature modeling for Software product Lines ‘SPL’ from previous literature work.
• After providing a clear background, setting out definitions, and identifying the significance and substantiality of our addressed subject; an evaluation of feature models in software product lines is undertaken.
• This evaluation emerges into an in-depth study of feature modeling approaches by dismantling and analyzing them in practice, presentation and notations. Throughout this study, a real life exemplar developed by the author as an illustration and case to work on, is employed; which is the example of 3D Printer. The evaluation is undertaken according to designated criteria taking into consideration the existent glitches in selected feature modeling notations. The evaluation covers a selection of criterions: scalability, traceability, articulacy, comprehensiveness and visual presentation suitability.
5
of probabilistic feature models, absence of frameworks to capture uncertainties in feature models of software product lines, and the lack of reasoning techniques. • The overall review derives and leads to dealing with the research questions
answered using methods elaborated in the following steps.
Step two:
ConstructionThe second step takes place as an attempt to find solutions to the glitches present in current feature models, address the knowledge gap, and answer the research questions resourcefully. This step show casts the opportunity of probabilistic modeling and the potentials for evolving the current feature models by addition of probabilistic weighting to quantify the existing uncertainty.
• An exploration of other relevant domains (machine learning, Data modeling, and Bayesian belief networks) to investigate potential techniques that can fill up the knowledge gap is undertaken.
• This leads to find inspiration and identify adequate techniques to employ in solving problems and build up the evolved feature model.
• Bayesian belief network tends to be compatible; consequently it is set as the approach to probabilistic modeling and the creation of Bayesian Belief Feature Model (BBFM).
• Mathematical studies are commenced to capture semantics of the feature model and reason about it.
• The proposed solution manages to exploit the problem, capture uncertainties and quantify them. Consequently, semantic mapping is observed to capture the notion of the feature model which facilitates the development of the BBFM.
• Subsequently, we form an approach for weighting parameters, features and dependency flows among features. This approach studies various scenarios in which mathematical analysis is applied to prove each theorem and validate it.
Step three:
Substantiation6
• This step addresses and show casts the findings, in terms of solving the bridges and providing an enhanced evolved feature model, in which the feasibility and practicality of the solutions are pointed out.
• In order to demonstrate the outcomes, we provide a graphical presentation of our feature model, which augments present feature models graphical presentation in terms of visualization.
• We use gray scale mapping to better visualize the probabilistic value assigned to each feature. Accordingly, shades of gray based on different weighting schemes are assigned, such that the distinct weighting value is translated by the intensity of the shade of gray.
• According to the assigned values in the weighting theorem, our work is extended and developed to reason about uncertainties. Besides, the efficiency; our proposed technique is scrutinized in terms of reducing problem size and reasoning time. • This step finds closure by discussing the obtained results and forecasting any
future work or improvements.
1.5.
Goals and Contributions
The dissertation intends to provide insightful exploration of the existing feature modeling techniques in software product line engineering ‘SPLE’. Throughout a systematic review, we were able to define, identify and analyze the current approaches used to manage the variability in SPLE. After examining the current practices of SPLE data modeling and reasoning, we were able to identify the knowledge gap as follow; “To the best of our research we argue that; SPLE lacks to:
1. Probabilistic quantification of the data model parameters. 2. Actual quantification of features implications.
3. Framework to anticipate the degree of uncertainty of the satisfaction problem. 4. Mathematical approach to tackle the uncertainty problem and reason about it.” To overcome the aforementioned gap of knowledge, this thesis was designed to:
7
A probabilistic modeling approach was developed to capture the dependency semantic among model features, while assigning probability weight for all features and dependency functions.
2. Employ the predefined probabilistic weights to enhance the visual expressiveness the developed notation, by a sensible integration of the colour use.
3. Utilize the predefined probabilistic weights to improve the constraint satisfaction process, by emphasizing the uncertainty measure of the problem space. Subsequently, develop an algorithm to satisfy the model constraints under uncertainty, and to anticipate the probability of obtaining a satisfiable configuration amongst the problem space.
4. Experimentally validate the aforementioned findings. Moreover, we were able to exploit the satisfaction problem behavior, allowing better understanding of the constraints actual implications, and enlighten the possible techniques to improve the reasoning process during the early stages of the model design.
1.6.
Reader’s Guide Map
In this section, we establish and provide a guide map to the thesis for the ease of readers. We start our dissertation by presenting a state of art for the variability modeling in software product lines, the advances, knowledge gaps, and challenges discussed in previous work. The Literature review will put an emphasize on feature modeling notations of SPLE and its glitches to give a roadmap for the contribution. The research questions proposed above are to be systematically dealt with throughout the review. The subjects covered are systematized as follows:
• Chapter 2 “Background” gives a preface to the notion of Product Line Engineering ‘PLE’. It provides a background on the emergence of SPL, and the motives of its emergence. It discusses SPLE in depth, provides a concise chronicle on the attempts to advance in SPL development through software modeling, and offers an insight to its benefits and limitations.
8
• Chapter 4 “Feature Modeling in Depth” includes a critical review on features and feature modeling notation and investigates the previous approaches to FM using a scenario of 3D printer. This followed by a summary of the limitations and challenges within feature modelling.
• Chapter 5 “Modeling under Uncertaint” will provide a comprehensive framework for quantifying the uncertainty measure in SPL. The obtained measurements are later used to structure Bayesian Belief Feature Model, with emphasis on the visual expressiveness of the developed model, throughout “use of colour”.
• Chapter 6 “Reasoning under Uncertaint” will present the designed method to tackle the Constraint Satisfaction Problem while taking into account the recomputed uncertainty measures. To validate the developed algorithm, experiments were conducted in order to validate the functionality of the proposed approach. This is then followed by an extensive discussion of the results.
“Learning is more than absorbing facts, it is acquiring understanding”
9
Part II
10
Chapter 2
Background
Software Product Lines ’SPL’ is a favorable and providential paradigm for the progression and prosperity of creating methodical and intensive software systems (Clements, 2002). It aims to provide an organized SPL, in which it furnishes a collection of products that shares lots of commonality rather than variability (Benavides, Segura, & Ruiz-Cortés, 2009). In other words, SPLE brings about the commonalities and variabilities in a set of reusable assets to provide a flexible efficient system with an ease of use, management, configuration, and customization (Bachmann & Clements, 2005; Van Gurp, Bosch, & Svahnberg, 2001). FM is a notation that illustrates the SPL; it represents the Software products as set of features. It is an information model displaying all core assets and variables that a customized software product can require (Rincón, Giraldo, Mazo, Salinesi, & Diaz, 2015).
Because of the high complexity of feature models, it was proven that those models are vulnerable and open to errors, complications and faults (Czarnecki & Wasowski, 2007; Lee, Kang, & Lee, 2002; Thüm et al., 2012; Thüm, Batory, & Kästner, 2009; White et al., 2010; White, Dougherty, Schmidt, & Benavides, 2009). Consequently, the automated analysis of feature models derived as a support to cope with the challenges of FM.
11
However, only few of these tenders are able to support a rigid account on dealing with defects and complexities.
This part of the dissertation provides an in-depth literature review on the software product lines followed by an insight on feature modeling. It scans through the work of previous pioneers in the province of feature modeling to assemble all the approaches mentioned in order of bestowing a solid starting point for this dissertation and ridding bias and misperception.
2.1.
Software product lines: pitfall of economy and the rise of PL
2.1.1.
The Pitfall of Economics
According to Oxford dictionary, Economics is defined as the area of knowledge concerned about the production, distribution and consumption of products and services and the supply of money. It is the deliberation of the way choices are made under circumstances of scarceness and resource limitations, and the results of those choices on society. These definitions are to be very broad and generic.
When talking about the scale of economics, economics can be discussed on the basis of two ranging: Wide and narrow ranging (Boehm, 1981).
12
there’s always deficiency in time, money and feature selection. Moreover, critical limitation in resources can be present in terms of computing capabilities such that the software product features gets affected.
2.1.2.
Mass Customization Notion
Mass customization in a broad-spectrum, is related to the capability to deliver customized products or services through flexible and dynamic procedures in high capacities coupled with cost efficiency (Da Silveira et al., 2001). The Notion arose in the late 80's and was considered as a natural and expected trail to the procedures that became high in flexibility and enhancements as regards the quality, quantity and costs (Lau, 1995). Besides, mass customization appears as a mean for companies to step out in a time of challenges and competitiveness (Kotler, 1989). Furthermore, Mass Customization was termed as the capability to supply exclusive and individually- tailored products or services through optimal time, integration and manageability (Davis, 1989; Eastwood, 1996). Figure 2. 1 presents an example of mass customized vases that varies from one another, and is tailored each exclusively.
Mass customization in a narrower spectrum, is a flexible process that organizes and manages information technology and assets to bestow an extensive choice of products or services in accordance to specific and precise requests of individual customers, at a cost proximate to the one of items that aren’t specified according to personal needs (in other words, mass produced products without individualization) (Hart, 1995; Joneja & Lee, 1998; Kay, 1993; Kotha, 1995; Ross, 1996).
13
The intent of mass customization is based on numerous ideas some of them are listed as follows:
• Deliver high diversity of products at the minimal cost by means of flexibility in production and information technologies (Åhlström & Westbrook, 1999).
• Response to the Growth in demand for product diversity and individualization by customers (Kotler, 1989).
• Provide products which are more personal and meaningful, more appreciated by customers.
• Present products that are feasible and practical in terms of planning, design, production, distribution, and facilitating (Hart, 1995).
2.1.3.
Mass Customization and Mass Production
Going through the literature, the topic of the correlation between mass production and mass customization was always stressed out. The debate laid emphasis on whether mass production and mass customization belonged to the same continuum or they were independent of each other, taking into account, their functional and conceptual differences and the likelihood of using both mass production and mass customization at the same time.
On one hand, Authors including Lau (1995) sees that mass customization and mass production belongs to the same continuum. They suggest that in order the mass customization approaches to be effective, it must have a background on mass production systems.
14
2.1.4.
Mass customization Essentials Kit
• Technology must be accessible and manageable; the employment of advanced production machineries, technologies and tools is essential to enable to hand out mass customized systems (Adamides, 1996; Hirsch, Thoben, & Hoheisel, 1998; Kotha, 1996; Lau, 1995). Flexible and well managed Information technologies process is a vital part for the customization of products.
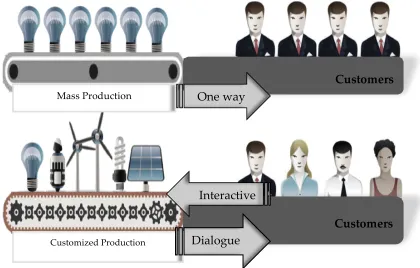
• Products should be adaptable to alteration. Effective mass customization products must be modularized, flexible, and constantly improved. Moreover, mass customization processes need prompt product development and innovation competences (Pine, Victor, & Boyton, 1993).
• Mass Customization system must have the ability to interpret new demands into innovative products. This necessitates the development of flexible networks (Pine et al., 1993), besides the production engineering knowledge and expertise, and process technologies (Kotha, 1995).
Customers
Mass Production
Customized Production Dialogue
Interactive
[image:30.612.112.532.97.365.2]Customers One way
15
2.2.
The Prominence of Software Product Lines
Software Product Lines gained attention after the emergence of software reuse succeeding the blooming of mass customization. The idea of SPL, in other words, reusing software for creating bespoke products (Kang, Cohen, Hess, Novak, & Peterson, 1990; K. Pohl, Böckle, & van Der Linden, 2005), was an innovative and pioneering idea which arose as an alternative to the conventional method of production (Eriksson & Hagglunds, 2003; Kotler, 1989). The conventional method of software production was based on individual system development (Åhlström & Westbrook, 1999). Contrariwise, SPL transit production to another broader level; it is based on families sharing common functionalities (Bosch & Bosch-Sijtsema, 2010; L. M. Northrop, et al. ). As a matter of fact, Grouping those systems with common functionalities and producing SPL instead of developing each system from beginning; prove to be more appealing and desired for the industry (Clements, 2002; Gomaa, 2005; Van der Linden, Schmid, & Rommes, 2007). Figure 2. 3 demonstrates the transition from conventional production to customized product lines which provided a broader range of alternatives.
Figure 2. 3 Transition from conventional production to product lines
2.2.1.
SPL: Why and Wherefores
16
2.2.1.1.
Advantages of software product lines: Epigrammatic list
Organizational advantages of Product Lines
Tangible Advantages
Profitability
Further market agility and market shares are reached due to product line approach. Moreover, Market presence is maintained and competent growth is sustained (L. M. Northrop, et al. ).
Quality
Product defect density is highly reduced in Product lines. Also resolving those defects and redundancies is mostly unproblematic (Van der Linden et al., 2007)
Performance
Performance is significantly improved through prompter dealing with algorithms and variation and circumventing timing problems (Clements et al., 2001).
Time to Market
Time to field and to launch is reduced, because of the reuse of assets and diminution of replicated mistakes and deficiencies in the system (Heymans et al., 2008).
Productivity
More flexibility in meeting customer’s demands and more ease in amendments and modifications. Product line Assets are meant to be easily implemented, and thus regarded as commercial off-the-shelf products (Thao, 2012).
Code Volume
Source code size and the quantity of design objects for subsystems in product line systems are lessened in comparison to that of the traditional single systems (Bosch et al., 2001).
Intangible Advantages Software
Developer acceptance
The product lines tends to expect satisfaction and certitude from the developer for the system as groundwork as well as the approach itself (Clements, 2002; L. M. Northrop, et al. ).
Professional satisfaction
17
challenging, mission-specific requirements or on performance adjusting and perfecting. Henceforth, professionals are more contented (L. M. Northrop, et al. ) .
Attrition rate
Staff resignation, turnover and renewal rate of staff is assumed to be lower whilst adapting product lines systems, in comparison to the conventional systems (Clements et al., 2001).
Customer satisfaction
Customers develop more sense of attachment; content and comfort since product lines offers a more predictable approach with less redundancies rates and better quality products (Heymans et al., 2008).
Businesswise Advantages of software product lines
Production and maintenance
costs
Using same approach, process, tools and techniques and with less redundancies and complications production and maintenance costs are relatively reduced. Compatibility of objective system and products with evolving capabilities is ensured. Wider interoperability and flexibility, before executing subsystem and device production, are guaranteed (Ardito et al., 2011).
efficiency in the processes
Product lines promote improving the consistency and reliability of the user interface. In addition, it offers more efficient integration of the products by the use of common standards and products to meet training, and test requirements (Clements et al., 2001).
budget and time planning
Product lines implementation provides a permanent integrated and interoperable infrastructure, and thus it causes decrease in risks, costs and schedule time for planning and preparations (Heymans et al., 2008).
18
2.2.1.2.
Advantages of software product lines: profound list
• Upturn of Quality
The common assets of the production line craft the core of the entire software family. Those common assets are subjected to review, checking and testing in various products to prove their optimal performance (Ebert & Smouts, 2003). The manifold and extensive testing of common assets in the SPL leads to detecting faults, oversights and defects (Figure 2. 4).
Consequently, all products of the software line are of a better quality (Lang, 2015; K. Pohl et al., 2005). Figure 2. 4 evidences the upturn of quality in SPL, as a result of the decrease in defects.
Figure 2. 4 Percentage of defects per number of reviews and testing (Ebert & Smouts, 2003)
• Ease of upgrades
The addition of new features, Alteration of existing features, amendment and upgrading of assets in the product line provides an undemanding opportunity to upgrade the software product line and its whole derived products.
19
• Cost Efficiency
Figure 2. 5 Costs of SPL vs cost of single production system (Ebert and Smout, 2003)
To a large extent, cost efficiency is one of the foremost motives for commencing software product line engineering, as it allows creating solutions with fewer expenses and more profits. The reuse of assets for multi production through a single software product line system implies a significant cost reduction (Mazo & Salinesi, 2008).
Although SPL requires an upfront investment for planning and setting strategies, in the long run the reuse of assets gives Software product line advantage over single production systems in such a way that it has lower cost as the number of products increase (Figure 2. 5).
• Time Saving
20
Figure 2. 6 Time to market for SPL vs single production system (Ebert & Smouts, 2003)
• Leadership Supremacy
SPL unlock cutting-edge opportunity gateway in competitiveness, innovation, productivity and profitability (Ardito et al., 2011).
[image:36.612.141.478.108.316.2]It opens up new possibilities that don’t exist in conventional single production systems. Accordingly, Leadership supremacy is achieved by the mean of SPL that promotes delivering large number of customizable products in less time and effort, and higher qualities (Figure 2. 7).
21
2.2.2.
Myth versus Reality: SPLE as Lego construction
2.2.2.1.
The myth
“And then we’ll be able to construct software systems by picking out parts and plugging them together, just like Legos…” (Shaw, 1998). The myth states that the archetype model of reusability and the best resemblance to software product lines is as simple as “Lego” (Crnkovic & Larsson, 2002).
2.2.2.2.
The Fact
[image:37.612.85.532.366.681.2]It’s much more complicated and contains lots of incompatibility and bugs. It is consisted of a complex system with specific function and characteristic specific compatibility (L. M. Northrop, 2006). Figure 2. 8 iluustrate the difference between the myth and the reality of SPL modeling, in terms of complexity.
22
2.2.3.
Drawbacks of SPLE
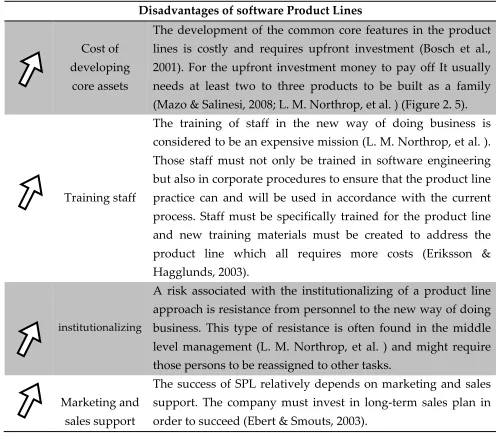
After noting that software product lines isn’t an easy fix-all solution or as easy as a Lego plugging game, it’s important to mention the costs and draw backs of SPLE. The table below (Table 2. 2) points out some of the common disadvantages of SPLE:
Disadvantages of software Product Lines
Cost of developing
core assets
The development of the common core features in the product lines is costly and requires upfront investment (Bosch et al., 2001). For the upfront investment money to pay off It usually needs at least two to three products to be built as a family (Mazo & Salinesi, 2008; L. M. Northrop, et al. ) (Figure 2. 5).
Training staff
The training of staff in the new way of doing business is considered to be an expensive mission (L. M. Northrop, et al. ). Those staff must not only be trained in software engineering but also in corporate procedures to ensure that the product line practice can and will be used in accordance with the current process. Staff must be specifically trained for the product line and new training materials must be created to address the product line which all requires more costs (Eriksson & Hagglunds, 2003).
institutionalizing
A risk associated with the institutionalizing of a product line approach is resistance from personnel to the new way of doing business. This type of resistance is often found in the middle level management (L. M. Northrop, et al. ) and might require those persons to be reassigned to other tasks.
Marketing and sales support
[image:38.612.62.558.214.653.2]The success of SPL relatively depends on marketing and sales support. The company must invest in long-term sales plan in order to succeed (Ebert & Smouts, 2003).
“Employ your time in improving yourself by other men's writings, so that you shall gain easily what others have labored hard for.”
23
Part III
24
Chapter 3
Managing Variabilities
It is essential to unseal the paradigm of software product lines in sequence of breaking it down into segments, to promote better comprehension of all its facets. This chapter will approach variability modeling, the focal facet of software product lines, in all its associations, foundations and applications.
3.1.
SPLE: a tale of Variabilities
Software requires to be tailored to changeable requirements, since the customer demands, markets, and hardware are changing and expanding (Muschevici, Proença, & Clarke, 2015). If each and every altered product is handled individually, the overhead of dealing with all the alternatives drastically converts to an infeasible option (K. Pohl et al., 2005). As a solution for this dilemma, Software Produce Line Engineering is present (Apel, Batory, Kästner, & Saake; Czarnecki & Eisenecker; K. Pohl et al.).
25 products holding mutual set of features that comply with the requirements of a specific domain. SPL’s outcomes are delimited and implemented as a combination of common and variable features subsequently bringing out the final software products (Muschevici et al., 2015). A feature consequently is a property or functionality used to capture commonalities or discriminate among systems in SPL (Czarnecki & Eisenecker, 2000). Variability modeling is an important method to present and represent common and variable features, and to decide which features to be supported in a product line and which ones to be deserted (Glück & Lowry, 2005). SPL are practically multifarious systems formulated from a treble process(Clements et al., 2001; K. Pohl et al., 2005), Listed as follows:
3.1.1.
Domain engineering
Also known as family engineering or core asset development (Heuser & Pernul, 2009), the domain engineering phase is responsible for the production of software core assets to be used in different products of the SPL. As mentioned by Pohl et al. (2005), and Clements and Northrop (2001), the domain engineering goals lays as follows:
• Identifying the commonality and variability among the whole elements of the SPL.
• Defining flexible architecture that addresses the commonalities and variabilities.
• Establishing the set of application that the SPL is planned for. • Modeling and defining the scope of the SPL.
• Constructing and implementing the reusable assets that leads to the desired variability in application engineering.
3.1.2.
Application engineering
26 • Attaining a high reuse of the domain assets.
• Utilizing the commonalities and variabilities.
• Adjusting variabilities in consistent with the needs of the application.
• Producing individual systems from core assets in accordance to individual needs.
3.1.3.
Management
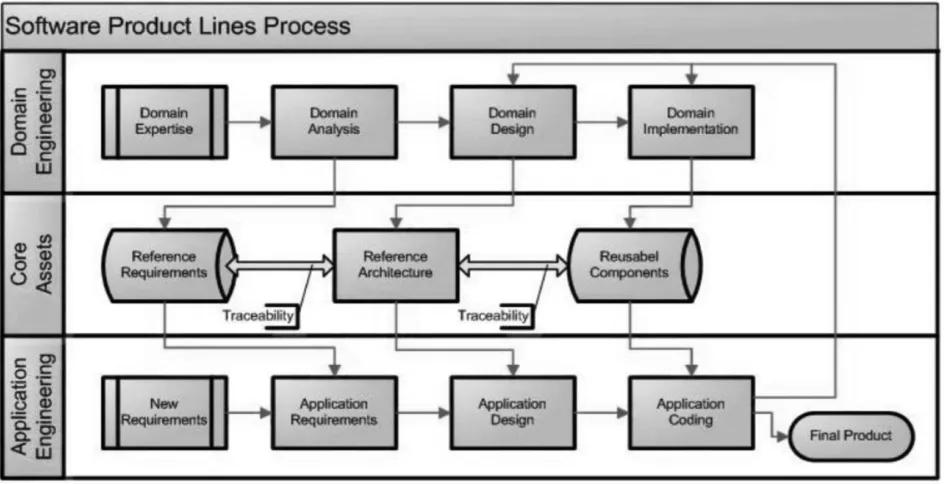
[image:43.612.74.546.382.624.2]Imperative to both processes (domain and application engineering), is the management of variability across the product line (Halmans & Pohl, 2003), in which resources are given, coordination is assured and supervision on both domain, and application engineering process is ensured (Benavides, Segura, Trinidad, & Cortés, 2007).
Figure 3. 1 clarifies and sheds the light on the process of SPLE as demonstrated below:
27
3.2.
Commonalities and variabilities
As stressed out earlier, domain engineering and application engineering set the foundation and groundwork for the software product line engineering. SPLE is in charge of the variability management, in other words the process of identifying and sorting out commonalities and systematizing the variabilities of software artifacts and models (Berg, Bishop, & Muthig, 2005; L. Northrop & Clements, 2001).
Specialists in the province of SPLE, such as (Knauber, Muthig, Schmid, & Widen, 2000); (Macala, Stuckey Jr, & Gross, 1996); (Coplien, Hoffman, & Weiss, 1998); (Ahmed & Capretz, 2011) lay emphasis on the essential role for the SPL in terms of taking in hand the commonality and variability in the development of products. The scrutiny of commonalities and variabilities provides the software engineers with an organized methodical tactic of conceptualizing and pinpointing the product family they are generating (Coplien et al., 1998).
Albeit a unique perception, characterization or meaning of variability is not distinguishable, Literature points out several definitions of commonalities and variabilities. This section will highlight abridged notions of them:
For instance, Coplien et al. (1998) consider the variability in SPL is the supposition of how assets in product families can differ from one another. Henceforth, in their standpoint, variability postulates the distinctiveness of a product line system in accordance to certain expectancies of a customer. On the other hand, commonality deals with the suppositions that are constantly existent in each product of the software product line.
28 According to Bosch et al. (2001), there are two different approaches to variability, first approach as a subject, and the second as an object.
Variability as a subject is an assorted entity or a diverse property of this entity. However, variability object is a precise illustration of a variability subject. The variability object is managed to identify the different approaches in which the variability subject can diverge.
For an instance, given the example in section 3.3, when considering 3D printers (see Figure 3. 4), the variability subject may well be the model making, and a variability object might be the diverse varieties of model making such as material, resolution and volume.
Not only does the literature point out different definitions of commonalities and variabilities, it also speaks about different categories of them;
Svahnberg et al. (2005) consider variabilities are made of five different stages, Bachmann et al. (2005) suggest another distinct categories of variabilities. in addition other researches categorizes variabilities by the notion of time and space (K. Pohl et al., 2005; Van der Linden et al., 2007), or according to essential and technical categories (Halmans & Pohl, 2003), externality and internality (K. Pohl et al., 2005), and finally according to Software product line engineering (Metzger, Pohl, Heymans, Schobbens, & Saval,2007).
29
3.3.
Modeling Software Product Lines’ Variables
In SPLE, it is evident that the domain engineering process is responsible of identifying the commonalities and variabilities of the product line, developing the core reusable assets, as well as modeling the variabilities of the SPL (K. Pohl et al., 2005), and thus requires more effort (see Figure 3. 2).
[image:46.612.187.419.366.475.2]Variability modeling is a significant mean that allows interpretation and perceiving commonalities and variabilities in SPL, in addition to sustaining product customization and derivation. Amongst the numerous approaches of variability modeling identified in literature, Feature modeling ‘FM’ and decision modeling ‘DM’ are considered to be the most important approaches, in addition to Orthogonal variability modeling and others (see Figure 3. 3).
Figure 3. 2 Domain engineering versus Application engineering (Deelstra et al., 2004)
To outline our approach, in this section a suggested motivating exemplar of 3D printer product line is proposed and presented throughout the review. Based on this exemplar, different types of variability modeling are explained.
[image:46.612.82.513.581.697.2]30
3.3.1.
Feature Modeling
Feature modeling is the most famous approach to modeling variability present in literature (Czarnecki & Kim, 2005; Griss, Favaro, & Alessandro, 1998; Kang et al., 1998; Männistö & Bosch, 2004; Riebisch, 2003; Schobbens, Heymans, & Trigaux, 2006). Chapter “Feature Modeling in Depth” in this dissertation is dedicated to the enlightenment of feature modeling in depth.
In brief, feature model presents the whole possible facets of a product, and thus represents a diverse product line system. In other words, feature model aims to identify all possible features and their possible relationships and constraints (Benavides et al., 2010).
Figure 3. 4 is a proposed exemplar that portrays a suggested simplified feature model driven from the inspiration of the 3D Printers. The model illustrates the approach of feature model for modeling the variabilities of 3D printers and listing the common features.
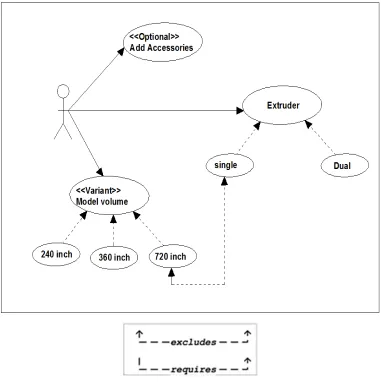
Based on the proposed model, all 3D printers include a software, body, model making abilities and connectivity tools. However, accessories are optional and their presence varies on demand. Moreover software in the printer can vary as there is a number of software to choose from, and include or exclude.
31
3.3.2.
Decision Modeling
Alongside the Feature modeling approach, exist the Decision modeling approach, which is also widely used to model variabilities. A decision model is a support outlining the decisions needed to be done in order to identify an element in a specific domain (Bézivin, 2001). Decision models are documents presenting decisions, their attributes, and dependencies (Atkinson, Bayer, & Muthig, 2000). Consequently, decision models brings about the diverse products by putting values to the decisions through setting out questions and relating them with possible answers; as a response of the arrangement of decisions dependencies.
Figure 3. 5 depicts a proposed decision model for the exemplar of the 3D printer, in a textual and a tabular representation.
32
3.3.3.
Orthogonal Variability Modeling
In addition to the Feature modeling and decision modeling, there’s also the orthogonal variability model that is used to model variability descriptions. The orthogonal variability model is presented by a graphical notation which describes the variability points, variants and their dependencies (K. Pohl et al., 2005).
[image:49.612.145.479.314.645.2]Figure 3. 6 presents a simplified orthogonal variability model approach of the proposed exemplar of the 3D printer.
33
3.3.4.
Other Modeling Approaches
[image:50.612.111.492.290.672.2]Variability model approaches are not limited to the feature, decision and orthogonal variability model, instead it extends to include approaches such as UML based variability model, and ADL based variability models, Constraints variability languages CVL, COVAMOF, and ConIPF (Haugen, Moller-Pedersen, Oldev, Olse, & Svendsen, 2008; Sinnema & Deelstra, 2008).
Figure 3. 7 presents a simplified UML Use Case diagram for the suggested 3D printer variabilities.
34
Chapter 4
Feature Modeling in Depth
35
4.1. Feature Modeling: An Explication
Granting the frequent usage of the term “feature” in regards to the SPL, there is a scarcity of clear understanding of the term. The systematic literature review is carried out to firstly explore the varied definitions and potential utility of the term “feature” and “feature models” in SPL researches. This is tracked down by detailed exploration of feature modeling notations, approaches, specification to be shadowed by an evaluation of selected FM notations.
4.1.1. Review method
The systematic literature review is carried out to set an in depth study of feature modeling, starting with terming features, reaching a thorough investigation of FMs. In accordance to a coordinated and systematic method, as per Keele (2007) guidelines and Kitchenham et al. (2009), 152 reference records dated from 1990 to 2015 in previous literature were identified as relevant with the research objectives. Those identified records are then subjected to thorough inspection, via systematic literature screening. Collected records are screened according to inclusion and exclusion criteria and the screened records are subjected to further filtering which leads finally to a selection of data records apt for synthesis in the literature review. Then narrative syntheses of various definitions are conducted, followed by the identification of their potential value for this examination.
4.1.2. Review goal
36
4.1.3. Inclusion and exclusion criteria
The starting point for the adoption of the studies is the inclusion and exclusion criteria.
We review studies from selected sources (listed in subsection 0) according to the following inclusion criterion:
• IC1. Peer reviewed papers are included from year 1990 to 2015.
In this manner, papers from the dawn of FM until their most recent appearance are considered.
• IC2. Full studies including literature reviews related to our topic and research goals are included.
• IC3. Articles and papers in light of feature modeling notations in SPL.
These materials are precisely dedicated to our focus and abide to our review goals. The studies that were included in our review were directly related to our topic with clear defined structure founded on previous accurate studies or theoretical studies. However our exclusion criterion is based as follows:
• EC1. Sketchy and superficial studies that lacks in-depth and exhaustive studies. Like so, trivial and inconsequential considerations are avoided and eliminated. • EC2. Incomplete studies, that ranges within extended abstracts, tutorials or
presentations.
These are disregarded as they provide curtailed and limited support as well as lack in depth.
• EC3. Papers and studies that are published before the year 1990 and after the year 2015.
As been rationalized in the inclusion criteria, the review takes an exclusive interest in the published papers from the emergence of FM till the most recent work. • EC4. Articles outside the subject discussed.
Those articles are omitted as they don’t fulfil our review goals and are irrelevant of the theme of study.
• EC5. Studies that presents subjectivity in which the author presents a subjective point of view or biased information.
37 • EC6. Papers that doesn’t relate to SPL specifically.
As per example, papers only relating to computer science or artificial intelligence are excluded, since they are not specific to our domain of study.
4.1.4. Data basis and selection criteria
According to Keele (2007), Primary data records are identified and screened in a manner that the records provides distinct and direct connection to feature modeling in SPL.
Subsequently, duplicates are removed and records are subjected to further refinements which lead to further exclusion of records with bias and records with insufficient information. Thus, the assessment provided reliable records proceeded by clear interpretation of outcome.
The following sources of information are used as data basis and sources:
• Designated Noticeable and prominent conferences concerned of features and feature modeling in SPL, which include:
International Software Product Line Conference (SPLC), IEEE International Conference, , Requirements Engineering Conference (RE), International Conference on Software Reuse, International Software Product Line Conference, Conference in Computing Science, and International Conference on Software Engineering (ICSE).
• Various leading journals and reports related to feature and feature modeling in SPL, such as:
IEEE Transactions on Software Engineering1, ACM on Software Engineering2, Journal of Systems and Software, Software Quality Journal, Journal of Theoretical and Applied Information Technology, International Journal of Advanced Manufacturing Technology, International Journal of Technology Management, Overload Journal 78 and Software Quality Journal
38 • Workshops in the aforementioned prominence, namely:
International Workshop on Domain Engineering, International Workshop on Requirements Engineering for product lines, Workshop on Variability Modeling of Software-Intensive Systems, International Workshop on Satisfiability Modulo Theories, International Workshop on Requirements Reuse in System Family Engineering, International Workshop on Software Factories, Workshop on Software Variability Management for Product Derivation.
• Book Chapters and other significant sources are also considered in the review. • References extracted from the preliminary journals are included in the
synthesis in order to incorporate former data sources.
4.1.5. Data Hunt and assessment
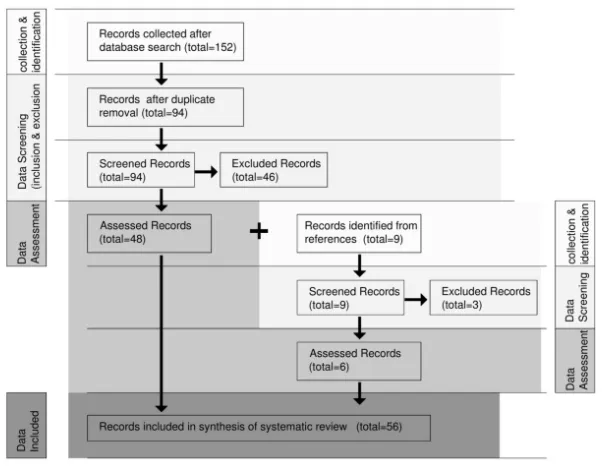
Figure 4. 1 illustrates the data hunt and further assessment of records, which are undertaken according to the following criteria:
[image:55.612.151.452.351.585.2]• Data are firstly collected and identified from the aforementioned journals, conferences, book chapters, reports, workshops and other materials.
39 • The Data hunt is initiated on the basis of titles and search words (key words)
related to feature modeling in SPL. The initial records identified formed 152 papers.
• Abstracts are then examined to figure out relevant sources and narrow down the search (thorough examination for some sources is undertaken when necessary). As a result, Duplicates are excluded.
• The final stage included examining the selected records judiciously to determine if they fit the purpose of the review.
• In consequence, irrelevant materials are eliminated to narrow down the search to 48 potential sources.
• References relevant to our search purpose (11 in total) are then identified and screened to be narrowed down to 6 sources to be added to the assessed records. • The total number of records involved in the review formed 56 records at the
[image:56.612.22.584.402.595.2]end.
Figure 4. 2 shows a detailed classification matrix of the records used in the systematic literature review in accordance to the year of publications, ranging from 1990 to 2015, and the record type.
40 the 56 records includes 3 technical reports, 26 journal papers, 11 conference papers, 3 workshop papers, 8 book chapter and 5 from other materials.
4.1.6. Review Outcome
• Terming “Feature”
In regards to the term feature, 15 records of the 56 records used the term feature as an increment to function, 10 records referred to it as a specification in modeling in SPL, Whereas, 9 papers identified feature as a property, behavior or quality of software system. Table 4. 1 Feature’s definition in literature and Figure 4. 3 Feature's definition classification illustrate the findings.
Feature definition in literature
Increment to function Specification Behavior or Quality of Software System
(Cuevas, 2007) (Benavides, Ruiz-Cortés, Corchuelo, & Martín-Díaz, 2004)
(Kang et al., 1990) (Benavides, Cortés, Trinidad, &
Segura, 2006) (Batory, Benavides, &
Ruiz-Cortes, 2006)
(Dubslaff, Klüppeholz, & Baier, 2014)
(White et al., 2009) (Metzger et al., 2007)
(White et al., 2014) (White, Schmidt, Benavides, Trinidad, & Ruiz-Cortés, 2008)
(Siegmund et al., 2012) (Gomaa, 2005)
(Batory, 2005) (Zave & Jackson, 1997)
(Gibson, 1997)
(Benavides et al., 2007) (Benavides, Cortés, et al., 2006) (Czarnecki & Eisenecker, 2000)
(Bailin, 1993) (Svahnberg et al., 2005) (K. Chen, Zhang, Zhao, & Mei,
2005) (Batory, 2005)
(Classen, Heymans, & Schobbens, 2008)
(Apel et al., 2013b) (Beuche & Dalgarno, 2007)
(Kang et al., 1990) (Lee et al., 2002) (Griss et al., 1998) (Kang et al., 1998) (John & Muthig, 2002) (Wang, Li, Sun, Zhang, &
Pan, 2005) (Bosch et al., 2001) (Rincón et al., 2015) (Van Gurp et al., 2001)
41
15
4
9 0
5 10 15 20
Specification
Increment to function
Other Definitions behaviour
Feature
Figure 4. 3 Feature's definition classification
• A selection of Notable definitions
It is important to point out notable terminologies for feature in SPL.
As per the systematic literature review, features are approached in accordance to three main definitions which are;
features as an increment to function, features as specification for modeling in SPL, and features as a behaviour or quality in software systems.
Other definitions identified in literature are also worthy to point out.
Starting with feature as increment to function, Kang et al. (1990) first defined Features as distinguishable functional abstractions that must be incremented, established, delivered, and maintained. Moreover, feature is defined as an increment in product functionality in software systems according to Cuevas (2007).
Siegmund et al. (2012) , Zave and Jackson (1997) and Batory (2005) stresses out the same definition of features as an increment to function which satisfies and fulfills functional requirements.
Features are also referred as a specification, as per Benavides et al. (2007) software systems are specified in terms of features. In addition, according to Kang et al. (1990 ), a product of a product line is specified by a valid feature selection.
42 feature as “a logical unit of behavior that is specified by a set of functional and quality requirements“.
• Terming “Feature modeling”
Mainly, features in software product lines are expressed in feature models, which bring out the importance of clearly defining feature models.
This part introduces various definitions and perceptions of feature models extracted from previous literature.
Feature models definitions
Info representation Commonalities and variability
tool
Specification member in product lines (Benavides et al., 2009)
(Benavides et al., 2004)
(Mendonca, Wąsowski, &
Czarnecki, 2009) (Benavides, Cortés, et al., 2006)
(Batory, 2005) (Benavides, Segura, Trinidad, &
Ruiz-Cortés, 2006a) (Mendonca, Branco, & Cowan,
2009)
(Benavides, Segura, Trinidad, & Ruiz-Cortés, 2006b) (John & Muthig, 2002) (Mazo & Salinesi, 2008)
(Czarnecki, Grünbacher,
Rabiser, Schmid, & Wąsowski,
2012)
(Rincón et al., 2015) (Arcaini et al., 2015) (Heymans et al., 2008)
(Harman et al., 2014) (Beuche & Dalgarno, 2007)
(Bak, 2013)
(Benavides et al., 2007) (Czarnecki & Eisenecker,
2000)
(Batory et al., 2006)
(Mendonca, Wąsowski, et al.,
2009) (Lee et al., 2002) (Kang et al., 1998) (White et al., 2009) (White et al., 2014)
(Mendonça, 2009) (Czarnecki & Wasowski, 2007)
(R. Pohl, Lauenroth, & Pohl, 2011)
(Thüm et al., 2009) (Czarnecki, Helsen, &
Eisenecker, 2004) (Sun, Zhang, Fang, & Wang,
2005) (Wang et al., 2005) (Mazo & Salinesi, 2008) (Beuche & Dalgarno, 2007)
(Mendonca, Wąsowski,
et al., 2009) (Benavides, Cortés, et al.,
2006)
(Batory, 2005) (Czarnecki & Eisenecker,
2000) (Lee et al., 2002) (Thüm et al., 2009) (Thiel & Hein, 2002)
(Riebisch, 2003) (Pleuss, Botterweck, Dhungana, Polzer, & Kowalewski, 2010) (Arcaini et al., 2015)
43 Figure 4. 4 and Table 4. 2 Feature model's definition in literature point out various definitions and perceptions of feature modeling in SPL. According to the systematic literature review, Feature modeling is regarded as information presentation for SPL in 17 records of the 56 records assessed. Whereas, the term feature modeling is referred as a commonality and variability identification technique in 19 records. However, FMs are also referred as specification member in SPL according to 10 records.
• A selection of Notable definitions
A feature model can be used to represent the similarities and differences within a family of software systems (Mendonca, Branco, et al., 2009). The combination of features represents all variability, thus forms FM (John & Muthig, 2002).
Czarnecki and Wasowski (2007), however, defines Feature modeling as a notation and an approach for modeling commonality and variability in product families.
Furthermore, Lee at al. (2002) adopts a comprehensive approach in which he defines FM as the activity of identifying externally visible characteristics of products in a domain and organizing them into a model called a feature model.
• Concluding Remarks
It is apparent that clear common definitions for feature and feature modeling have not been agreed on, in which features are considered as function, property and specification (Classen et al., 2008). However, Tracking down a consensus on their definition and clarifying the terminologies of “Feature” and “feature modeling” is an essential step for more thoroughly investigating of its mechanisms. Although it seems
0 5 10 15 20
info representation