Effect of Substrate Surface Topography on Forensic Development of Latent
Fingerprints with Iron Oxide Powder Suspension
BJ Jones1*, R Downham2, VG Sears2
1. Experimental Techniques Centre, Brunel University, Uxbridge, Middlesex, UB8 3PH, UK 2. Fingerprint & Footwear Forensic Group, Home Office Scientific Development Branch, St Albans, Hertfordshire, AL4 9HQ, UK
* corresponding author ([email protected])
Abstract
Latent fingerprint deposition and effectiveness of detection are strongly affected by the surface on which prints are deposited. Material properties, surface roughness, morphology, chemistry and hydrophobicity can affect the usefulness or efficacy of forensic print
development techniques. Established protocols outline appropriate techniques and
sequences of processes for broad categories of operational surfaces. This work uses atomic force microscopy and scanning electron microscopy to investigate a series of surfaces classified as smooth, non-porous plastic. Latent prints developed with iron oxide powder suspension are analysed on a range of scales from macro to nano to help elucidate the interaction mechanisms between the latent fingerprint, development agent and underlying surface. Differences between surfaces have a strong effect, even within this single category. We show that both average roughness and topographical feature shape, characterized by skew, kurtosis and lay, are important factors to consider for the processing of latent fingerprints.
1. Introduction
Forensic casework and research laboratory studies show that latent fingerprint
development efficiency can be affected by characteristics of the deposition surfaces as well as by the donor attributes [1-12].
Protocol tables have been developed that apply broad classification to surfaces and outline appropriate development techniques such as dry powder, small particle reagent,
cyanoacrylate fuming (CA) or vacuum metal deposition (VMD) [1,2]. Powder suspensions, fine particles suspended in a surfactant, are increasingly used in development of latent fingerprints [1-4]. Powders may be based on titanium dioxide, aluminium, iron oxide or a range of carbon based materials, allowing choice of technique that is optimum for a
particular sample. However, development of fingerprints utilising routine techniques may in some cases be sub-optimal or impossible. Azoury [7] shows a case where routine
developed with VMD. Research groups also show latent print chemistry and development effectiveness is related to donor and time from deposition [11,12].
Protocol tables are continually evolving as technology develops. Advances in nanotechnological techniques enable the use of new methodologies for making and
augmenting crime scene identifications [13-15]. Research into nanostructured particles [4, 16,17] has helped develop techniques with improved latent fingerprint development, though the efficacy remains surface dependent [4,17]. Development efficacy of powders and suspensions is related to lack of development agent adhering to deposited print as well as excess background staining; different powders and powder suspension formulations have been shown to have optimum efficacy depending on the surface on which the print is
deposited [4,5,8,18]. This demonstrates that an understanding of the substrate surface properties, beyond a broad classification, is important in forensic development of latent fingerprints.
This work studies latent prints developed with iron oxide based powder suspension. The study analyses the development powder and thoroughly characterises a series of three representative surfaces, studying both clean surfaces prior to print deposition and effect of the surface characteristics on the development of latent prints. The morphology of the sample surfaces is studied and the deposition and distribution of deposited powders on the latent prints and background areas is investigated.
2. Experimental
Three materials relevant to crime scene investigations, with surface type classified as smooth, non-porous plastic, were identified as formica, polyethylene (PE) and unplasticised polyvinyl chloride (uPVC). Sample surfaces were sponged with warm water and detergent, cleaned with ethanol and were subsequently left to dry in air.
Natural latent fingerprints were collected at the Home Office Scientific Development Branch (HOSDB) from two donors. To produce a natural print, donors were requested not to wash their hands for the 30 mins prior to deposition, and no grooming or loading with sebaceous or eccrine material was conducted. Donors lightly rubbed their fingertips together to minimize variability and deposited prints from individual fingers on to two samples of each of the three surfaces. The process was repeated twice to provide a total of six fingerprint samples per surface per donor.
Deposited prints were left exposed to the indoor environment for 18 hours and subsequently developed with a powder suspension based on magnetic iron oxide [19] prepared as described in HOSDB guidelines [2]. Subsequent examination of the powder by X-ray fluorescence and X-ray photoelectron spectrometry shows the formulation also contains levels of Al, Ca, Na, Ti, Cr, Mn, Cu and Zn. Developed prints and samples of clean surfaces were examined to investigate the print-surface-powder interactions.
probe with a resonant frequency of approximately 160kHz. Scans were conducted over a range of area from 300nm to 100 µm square; data was taken after first order plane subtraction, from analysis of at least five separate areas. The uncertainty range quoted is indicative of variation in the surface between areas studied.
A Zeiss Supra 35VP field emission scanning electron microscope (SEM) operating in high vacuum mode was utilised for subsequent analysis of the samples of developed prints on each surface. To enable valid comparisons between materials all images shown are from prints collected from a single donor. Samples were sputter-coated with a thin, conductive layer of gold prior to examination and images were collected at various magnifications. Qualitative elemental evaluation was conducted with an Oxford Instruments INCA energy dispersive X-ray analysis (EDX) system fitted to this microscope. A low accelerating voltage was used to maximize surface sensitivity for imaging; increased accelerating voltage was utilised to facilitate elemental analysis.
3. Results and Discussion
3.1 Substrate Surfaces
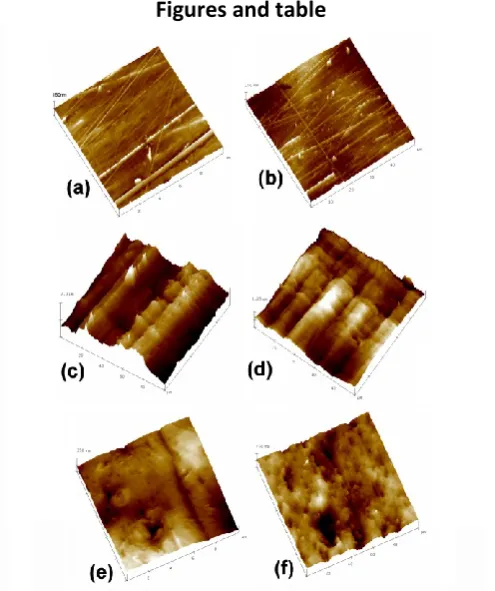
Figure 1 shows atomic force microscopy (AFM) images of the three surfaces, and the extracted surface parameters are given in table 1. The sample surfaces cannot be accurately characterised with a single parameter such as the commonly used roughness measurement, Ra. Figures from average over 50µm square areas are shown in table 1 and
comprise sample roughness Ra (average deviation from mean line), Rmax (maximum height
variation), skewness (symmetry) and kurtosis (peak sharpness).
Figure 1 (a,b) show AFM images of the formica surface over 10µm square and 50µm square, respectively. The measurements highlight a flat, smooth surface, with a low level waviness amplitude ~100nm and lateral scale ~30µm. The main features are sharp ridges of height approximately 100nm, a few larger, up to approximately 0.5 µm with side-troughs, perhaps formed as impressions of grooves in a contact surface during production. The general lay direction is constrained within about 20o. The sharp ridges contribute to the high kurtosis value and positive skew given in table 1.
Predominant features of the polyethylene (PE) surface are ridges from 2µm to over 5µm in height, and ~50µm wide, as shown in AFM images figure 1 (c). These major ridges are formed in some cases by ‘minor’ ridges perpendicular to the general lay, which are 3-10µm wide with a depth of up to 1µm, as shown in figure 1 (d). Minor ridge features are not ubiquitous and there are some much flatter areas between major ridges.
3.2 Developed Fingerprints
3.2.1 Developed print on formica
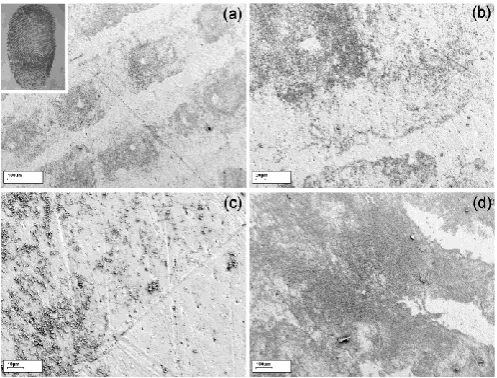
Figure 2 shows a latent print on formica developed with iron-oxide based powder suspension. Figure 2 (a) shows a low magnification SEM imaged of the developed print, indicating generally good development contrast. Figure 2 (b) shows a boundary of a print ridge showing primarily good definition and contrast to the background coverage. However, powder coverage on the background shows levels of adhesion to the substrate ridge
structure; smearing from the fingerprint ridge boundary at the top of the image follows the general direction of lay. Figures 2 (c and d) show SEM images of print ridge boundaries with good and poor definition respectively. Here the particle size range and uniformity can be seen; the particles acting in the development process include the majority of range of particle sizes in the powder, up to approximately 1µm, but exclude any aggregations that may be observed in the dry powder. There is no obvious difference in particle size or
morphology on print or adhering to background. In figure 2 (c) the surface direction of lay is parallel to the print ridge boundary. For the poorly defined boundary in figure 2 (d), the direction of lay is approximately 45o to the ridge edge. It can be hypothesised that in this sample, surface linear features parallel to latent print ridges act to reinforce the
demarcation, whereas substrate ridges at a greater angle to the boundary act to degrade print quality and promote smearing. This is also shown in figure 2 (a), which although showing generally good contrast, does also exhibit some disruption of ridge boundary detail by powder adhering along lay direction of substrate, as well as some light smearing
disregarding directional substrate structure.
3.2.2 Developed print on PE
Scanning electron microscope images of the developed print on PE are shown in figure 3. An SEM image showing the general overview of the developed print is shown in figure 3 (a) with an insert showing the light microscopy image of the full print. The substrate surface outlined earlier dominates the SEM image; developed print ridge are just visible. A higher magnification SEM image is shown in figure 3 (b). This highlights a boundary of the latent print ridge and shows that development is unaffected by the major substrate variations that dominate the surface, leading to development contrast shown in figure 3 (a, insert).
However, where the substrate is formed of minor ridges perpendicular to the primary direction, these have a strong affect on the print development. This is shown clearly in figures 3 (c and d) that show surface on and off latent fingerprint ridge, respectively. Figure 3 (c) shows even powder coverage on fingerprint ridge; interrupted only by the few highest peaks. Figure3 (d), away from the print ridge, shows powder adhering to the surface in the ‘minor ridge’ furrows. The minor furrows trap the powder away from the print, but are almost evenly covered under a well developed latent print ridge. The major ridges have little effect on the development process.
3.2.3 Developed print on uPVC
around pores, showing preferential development of eccrine deposit. This is further shown in figure 4 (b), demonstrating different levels of powder coverage around a pore. Figure 4 (c) shows a fingerprint ridge boundary, highlighting that the pits and holes in the substrate have little effect on latent print development, but the linear score marks in this surface have some effect on reinforcing parallel ridge edges, and disrupting transverse ridge edges, but this is a less prominent effect than the sharp ridges on the formica surface. Figure 4 (d) shows some smearing of ridges along predominant direction of substrate lay.
4. Conclusions
Three types of solid plastic surfaces were examined to investigate how the surface structure affects latent fingerprint development with iron oxide based powder suspension. The powder adhering to the fingerprint consists primarily of cubic magnetite crystals formed into clusters of a range of sizes from a few hundreds of nanometres to approximately one micron in diameter. There is no significant difference in particle size adhering to fingerprint ridge or background areas; larger particle aggregates seen in the raw powder are not observed on the developed print.
Sharp, ~100nm high ridges in the formica surface strongly affect print development, despite overall smoothness of surface. The angle of the substrate feature to the fingerprint ridge edge acts to control boundary disruption, with substrate ridges parallel to a print ridge boundary acting to contain the print, but when at an increased angle to latent print ridge edge contribute to degradation of the ridge-background contrast. uPVC, with furrows rather than sharp ridges, shows a similar tendency but to a significantly reduced extent. Pits in uPVC are the dominant surface characteristic, but seem to have little effect on fingerprint ridge development. The PE sample studied has significant directionality, with parallel surface ridges exceeding 5µm in height, and periodicity about 50µm. These ridges
contribute substantially to perceived roughness and roughness figures, but have little effect on the print development. Some substrate ridges are formed of minor ridges perpendicular to the general lay, with furrows 1-10 µm in width these trap development powder,
significantly degrading print quality by reducing background-ridge contrast.
In summary, surface structures are not adequately described by a single roughness
parameter for classification of relevance to fingerprint development. Figures for roughness, Ra, Rmax have been calculated, and surface morphology is further characterised by skewness
(symmetry) and kurtosis (sharpness of peaks / troughs) and dominant direction of surface structure (lay). Lay and lateral scale are important, with linear features acting as boundaries or channels. Scratch lines (or other linear features) influence print development even when not the dominant characteristic. Sharpness of features and whether features stand proud of the substrate or are recessed are of importance, and can be characterised by parameters such as skew and kurtosis, in conjunction with traditional roughness measurements.
Acknowledgements
References
[1] C Champod, C Lennard, P Margot, M Stoilovic, “Fingerprints and other Ridge Skin Impressions” CRC press, Boca Raton, FL USA 2004
[2] HOSDB Fingerprint Development and Imaging March 2006, publication no. 23/06 [3] A J Reynolds, B J Jones, V Sears and V Bowman J. Phys.: Conf. Ser. 2008,126, 012069 [4] B.J. Jones, A.J. Reynolds, M. Richardson V.G. Sears Science and Justice 2009;
DOI:10.1016/j.scijus.2009.08.001
[5] J. Brzozowski, I. Białek, P. Subik, Visualisation of fingerprints on sticky side of adhesive tapes, Problems of Forensic Sciences2005; 64, 333
[6] M Tahtouh, P Despland, R Shimmon, J.R. Kalman, BJ Reedy J. Forensic Sci. 2007; 52, 1089
[7] M Azoury, D Cohen, K Himberg, P Qvintus-Leino, T Saari, J Almog J. Forensic Sci.
2004; 49, 1015
[8] M Trapecar, MK Vinkovic, Science and Justice 2008; 48, 192
[9] N Jones, D Mansour, M Stoilovic, C Lennard, C Roux Forensic Sci. Int. 2001; 124, 167 [10] X.J. Dai, M. Stoilovic , C. Lennard, N. Speers Forensic Sci. Int. 2007; 168, 219
[11] R.S. Croxton, M.G. Baron, D. Butler, T. Kent, VG Sears J. Forensic Sci. 2006; 51, 1329 [12] N.E. Archer, Y Charles, J.A. Elliott, S Jickells Forensic Sci. Int. 2005; 154, 224
[13] G. Williams, H.N. McMurray, D.A.Worsley, J. Forensic Sci. 2001; 46, 1085 [14] B.J. Jones and A.J. Kenyon Forensic Sci. Int.2008; 177, 42
[15] N.J. Crane, E.G. Bartick, R.S. Perlman, S Huffman J. Forensic Sci. 2007; 52, 48 [16] K.H. Cheng, J Ajimo, W Chen, J. Nanosci. Nanotech.2008; 8, 1170
[17] L Liu, SK Gill, Y.P. Gao, LJ Hope-Weeks, KH Cheng Forensic Sci. Int. 2008; 176, 163 [18] M Trapecar, J Balazic, Science and Justice 2007; 47, 136
[19] Fisher Scientific product code I/1100/53; MSDS available at
Figures and table
[image:7.595.159.407.75.371.2]Figure 1: AFM images showing surface structure of (a,b) formica (c,d) PE and (e,f) uPVC samples
Figure 3: SEM images showing developed fingerprint on PEsurface (a) general overview with light microscopy image of whole print, insert. (b,c,d) selected details outlined in the text
Figure 4: SEM images showing developed fingerprint on uPVC surface (a) general overview with light microscopy image of whole print, insert. (b,c,d) selected details outlined in the text
Ra / nm Rmax / µm Kurtosis Skew
Formica 22.8±3.5 0.49±0.1 6.8±1.6 1.0±0.4
PE 319±90 2.8±1.4 3.3±1.0 0.1±0.4
uPVC 83±6 0.89±0.12 3.7±0.3 -0.5±0.2
[image:8.595.156.405.311.500.2]