Tecelão Diogo (Orcid ID: 0000-0003-2911-8929)
The effect of psychosis associated CACNA1C, and its epistasis with ZNF804A, on brain function
Short title: The effect of CACNA1C on brain function Diogo Tecelão1
, BSc, Ana Mendes2
, MSc, Daniel Martins3
, MD, Cynthia Fu4
, PhD, Christopher A Chaddock5
, PhD, Marco M Picchioni5, 6
, PhD, Colm McDonald7
, PhD, Sridevi Kalidindi5
, PhD, Robin Murray5
, PhD, Diana P Prata3, 8 § , PhD
1
Departamento de Física, Faculdade de Ciências e Tecnologia da Universidade Nova de Lisboa
2
No affiliation
3
Department of Neuroimaging, Institute of Psychiatry, Psychology & Neuroscience, King’s College London, London, UK
4
School of Psychology, The University of East London, London, UK
5
Department of Psychosis Studies, Institute of Psychiatry, Psychology & Neuroscience, King’s College London, London, UK
6
St. Andrew’s Academic Department, St Andrew’s Healthcare, Cliftonville, Northampton, UK
7
Centre for Neuroimaging and Cognitive Genomics (NICOG) & NCBES Galway Neuroscience Centre, College of Medicine, Nursing and Health Sciences, National University of Ireland Galway, H91 TK33, Galway, Ireland
8
§
corresponding author ([email protected], +351 966595936)
Keywords: CACNA1C, ZNF804A, verbal fluency, genome-wide association, schizophrenia, bipolar disorder, psychosis, functional magnetic resonance imaging, imaging genetics, functional connectivity, psychophysiological interaction.
Date of submission 22/02/2018
Abstract
CACNA1C-rs1006737 and ZNF804A-rs1344706 polymorphisms are amongst the most robustly associated with schizophrenia (SCZ) and bipolar disorder (BD), and recently with brain phenotypes. As these patients show abnormal verbal fluency (VF) and related brain activation, we asked whether the latter was affected by these polymorphisms (alone and in interaction) – to better understand how they might induce risk. We recently reported effects on functional VF-related (for ZNF804A-rs1344706) and structural (for both) connectivity. We genotyped and fMRI-scanned 54 SCZ, 40 BD and 80 controls during VF. With SPM, we assessed the main effect of CACNA1C-rs1006737, and its interaction with ZNF804A-rs1344706, and their interaction with diagnosis, on regional brain activation and functional connectivity (psychophysiological interactions - PPI). Using public data, we reported effects of CACNA1C-rs1006737 and diagnosis on brain expression.
Our results support evidence implicating CACNA1C and ZNF804A in BD and SCZ, adding novel imaging evidence in clinical populations, and of epistasis – which needs further replication. Further scrutiny of the inherent neurobiological mechanisms may disclose their potential as putative drug targets.
1.Introduction
Schizophrenia (SCZ) and bipolar disorder (BD) are severe psychiatric diseases with a strong genetic component (a heritability of up to 80% in SCZ (Cardno et al. 1999) and 93% in BD (Kieseppä et al. 2004)). Recently, genome-wide association studies (GWAS) have identified CACNA1C and ZNF804A as significant risk genes for both SCZ and BD susceptibility (Gurung & Prata 2015). Nevertheless, how they induce risk for psychiatric illness remains relatively unknown.
suggest that either an increase or decrease of calcium influx in excitable cells might be associated with SCZ or BD, as both could lead to changes in monoamine neurotransmitter synthesis and release (Gershon et al. 2014) - which has, indeed, been associated with other psychiatric disorders (Booij et al. 2003).
In terms of anatomy, the same CACNA1C rs1006737 risk allele, has been associated with increased total and fronto-limbic white matter volume (Frazier et al. 2014), albeit only after a few earlier negative findings (Kempton et al. 2009; Franke et al. 2010). Regarding white matter, after a reported association with reduced microstructural integrity in the right hippocampal formation in healthy Caucasians (Dietsche et al. 2014), we have published, for the first time using whole-brain tract-based spatial statistics, an association with reduced microstructural integrity. This effect was found within SCZ subjects (but not controls or BD), in portions of the left middle occipital and para-hippocampal gyri, right cerebellum, left optic radiation and left inferior and superior temporal gyri (Mallas et al. 2016a) - consistent with previous voxel-based findings (Woon et al. 2014). We also found the first evidence of an additive interaction of the CACNA1C and ZNF804A genotype on white matter microstructure (Mallas et al. 2016a). Both risk alleles’ concomitant presence in BD was associated with decreased integrity in the body of the corpus callosum, the right superior and left anterior corona radiata, comparatively more than in healthy controls. This finding is consistent with the hypothesis that both these polymorphisms increase risk for psychosis.
for, could be interpreted as lower efficiency – which is also found in SCZ relatively to controls (Gurung & Prata 2015). However, the latter was contested by another study that surprisingly found the reverse effect in healthy subjects: the risk allele homozygous showing less activity vs. G-allele carriers in the right dorsolateral prefrontal cortex (Paulus et al. 2014). Increased functional connectivity between that region and the bilateral hippocampal formations (dose-dependently) was also found, which, interestingly, mimics some ZNF804A rs1344706 risk allele’s findings, suggesting a common downstream pathway for both risk variants (Gurung & Prata 2015). As replication is key to clarify cause-effect assumptions in correlational approaches, we asked whether we could re-produce the above pattern of findings for CACNA1C’s role on brain function – and help clarify inconsistencies.
expression (i.e. were expression quantitative trait loci; eQTLs) in each of 10 post-mortem human brain areas. With a second database, we tested diagnosis-wise differences in these genes’ expression in several brain areas (comparing SCZ, BP and healthy subjects).
2. Materials and Methods 2.1.Sample
Our sample consisted of 174 English native speakers, the majority (93%) Caucasian, including a control group comprised of 80 healthy volunteers (34 males, 39±13 y.o.) with no history, or first degree family history, of a psychotic spectrum disorder, 54 patients with established SCZ (42 males, 37±11 y.o.) and 40 with BD (16 males, 40±12 y.o., 75% of which with a history of psychosis). Patients were recruited from the South London and Maudsley (SLaM) NHS Trust. Diagnosis, according to the criteria of the Diagnostic and Statistical Manual of Mental Disorders (DSM) 4th
Edition (American Psychiatric Association 1994), was ascertained by an experienced psychiatrist using a structured diagnostic interview with instruments detailed elsewhere (Prata et al. 2009b). All SCZ and BD patients were in a stable clinical state. Exclusion criteria applied to all participants were a history of significant head injury and current (last 12 months) substance dependency according to DSM-IV diagnostic criteria. The study was approved by the National Health Service (NHS) South East London Research Ethics Committee, UK (Project “Genetics and Psychosis (GAP)” reference number 047/04). All subjects gave written informed consent.
adenine-adenine), heterozygous (AG, adenine-guanine) and G homozygous (GG, guanine-guanine), and for ZNF804A were A homozygous (AA, adenine-adenine), heterozygous (AC, adenine-cytosine) or C homozygous (CC, cytosine-cytosine). Given the unbalanced frequency of allele counts in the Caucasian population (very low frequency of the allele A for the CACNA1C genotype and the allele C for the ZNF804A genotype), we grouped the CACNA1C risk allele A homozygotes with the CACNA1C heterozygotes (AA+AG) and the ZNF804A non-risk allele C homozygotes with the ZNF804A heterozygotes (AC+CC). Quality control-wise, the distribution of Caucasian genotype frequencies for the CACNA1C (0.18 AA, 0.42 AG, 0.40 GG) and the ZNF804A (0.46 AA, 0.39 AC, 0.15 CC) was consistent with Hardy-Weinberg Equilibrium, in patients (Ç2 (ZNF804A/CACNA1C)=1.60/1.69, df=1, p-value=0.21/0.19 and controls (Ç2 (ZNF804A/CACNA1C)=1.07/0.84, df=1, p-value=0.30/0.36). Sample size, in each diagnostic group, and for a ZNF804A and CACNA1C genotype-genotype combination were, respectively: 1) in healthy controls: 26 AA-[AA+AG], 14 AA-GG, 23 [AC+CC]-[AA+AG], and 17 GG; 2) in BD patients: 11 AA-[AA+AG], 6 AA-GG, 14 [AC+CC]-[AA+AG], and 9 [AC+CC]-GG; and 3) in SCZ patients: 16 AA-[AC+CC]-[AA+AG], 11 AA-GG, 16 [AC+CC]-[AA+AG], and 11 [AC+CC]-GG. The sample’s demographics are described in detail in Supplementary Table 1.
groups of diagnosis, genotypes or genotypes in each diagnosis. As expected, IQ significantly differed (p<0.001) between diagnoses, being significantly lower in SCZ compared to controls (or BD) – but there were no significant differences in IQ between genotype groups (of either gene). Diagnoses also significantly (p<0.001) differed in gender with more males in SCZ than in BD and more females in controls than in SCZ. The patient groups differed in chlorpromazine (CPZ) equivalents in medication (p<0.001) with SCZ having a higher load than BD, as expected given current treatment strategies.
2.2.Verbal Fluency Task and Image Acquisition
The verbal fluency task and image acquisition was performed as previously described elsewhere (Fu et al. 2002) (see Supplement 2 for details). Briefly, subjects were required to overtly generate a word starting with a visually displayed letter; or overtly read the word “rest” (control or “repetition” condition). Task difficulty, although not factored in the group analysis, was manipulated by presenting separate, and counterbalanced, sets of “easy” and “hard” letters (Fu et al. 2002).
2.3. Neuroimaging Analysis
was then performed using a voxel size of 2x2x2mm and trilinear interpolation. Spatial smoothing was carried out with an 8 mm FWHM isotropic Gaussian kernel. The remaining realignment, unwarping, normalization and smoothing parameters corresponded to the default choices.
effect of ZNF804A genotype is not reported herein, as it has already been reported in a previous study using the same sample (Tecelão et al. 2018), and the effect of task has also been described in a highly overlapping sample (Prata et al. 2009a). The main effect of diagnosis is reported as supplementary material, as it has been discussed using a subset of the present sample earlier (Prata et al. 2009a).
In addition to a whole-brain approach, we ran one additional analysis with selected regions-of-interest (ROIs) reported in two previous studies finding an effect of CACNA1C rs1006737 in semantic verbal fluency (Krug et al. 2010) and working memory (Bigos et al. 2010). These ROIs were derived from the automated anatomical atlas (AAL) (Tzourio-Mazoyer et al. 2002) and the Talairach Daemon database in Wake Forest University PickAtlas (Lancaster et al. 1997, 2000; Maldjian et al. 2003) (version 3.0.5). From the former (Krug et al. 2010) we derived a mask formed by the left precuneus and inferior frontal gyrus, and from the latter (Bigos et al. 2010), one comprising the Brodmann areas 9, 10 and 46. Additionally, the selected ROI masks were also defined using 10 mm spheres centred in their respective peak coordinates (obtained from the given studies). These post-hoc analyses allowed us to further clarify inconsistences in the published literature.
Significant findings are reported as so, if they survive voxel-wise familywise rate error (FWE) correction for multiple comparisons at p<0.05 across the whole brain (or within the ROI, for the ROI analyses), and at a cluster size e5. All other results are considered ‘trends’. In order to assess how much of the inter-individual (+ error) variance in blood oxygen level-dependent activation on the voxel of peak effect of each reported effect was explained by
genotype, we calculated the Ȟp 2
(partial eta squared) measure of effect size using R software
noise to our imaging results, extra analyses were performed as described in supplementary material 2.
2.4. Gene expression analyses
To test whether the CACNA1C rs1006737 risk variant (or other variants tagged by it in the same linkage disequilibrium block) affected any genes’ mRNA expression level (i.e. was an eQTL), we used the publicly available Braineac database - which includes genotypic and microarray profiling of 10 brain regions of 134 neuropathologically normal individuals with European descent (Ramasamy et al. 2014) (cerebellar cortex, frontal cortex, hippocampus, medulla oblongata, occipital cortex, putamen, substantia nigra, temporal cortex, thalamus, and intralobular white matter). Expression levels from exon-specific probes and total transcripts (Winsorised mean over exon-specific levels) were used to determine the association between this SNP and the expression of mRNA of all genes distant less than 1MB (cis-eQTL analysis), considering its transcription initiation site. We focused on cis-eQTL associations as these are more likely to truly reflect direct effects of a genomic variant on gene expression (Bryois et al. 2014). More detailed information is described in the Braineac database (Ramasamy et al. 2014). The same approach was followed for ZNF804A rs1344706 in our recent paper regarding that gene (Tecelão et al. 2018).
structures available. Mean-normalized z-scores were then calculated. Enriched areas were defined for a threshold of Z-score >1.
3. Results
3.1. Regional activation
Effect of genotype
3.1.1. Main effect of CACNA1C
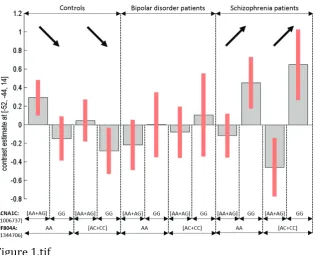
Irrespective of diagnosis, the CACNA1C rs1006737 risk allele A was significantly associated (voxel-level FWE p<0.05) with greater activation in the right (R) thalamus (Z=4.44, ·p2=2.95%), and the left (L) middle frontal gyrus (Z=4.32; Figure 1; Table 1). At a trend level (i.e. with a cluster less than 5 voxels, k<5), the same effect was found in the L thalamus (Z=4.27, ·p2
=3.02%).
When inspecting each diagnostic group separately, we found that in the BD group alone, the above effect was also significant (whole-brain voxel-level FWE p<0.05) in some of the above areas, plus others: the R thalamus (Z=4.89, ·p2=17.7%), the L middle (Z=4.71 and Z=4.21) and superior (Z=4.56) frontal gyrus, the R superior (Z=4.53) and middle (Z=4.47 and Z=4.25) temporal gyri and, as a trend, in the L calcarine sulcus (occipital gyrus; Z=4.28 and Z=4.22). The same genotype had an effect in another region of the R middle temporal gyrus (Z=4.25) but associated with decreased deactivation. No other diagnostic group alone showed significant effects of CACNA1C genotype.
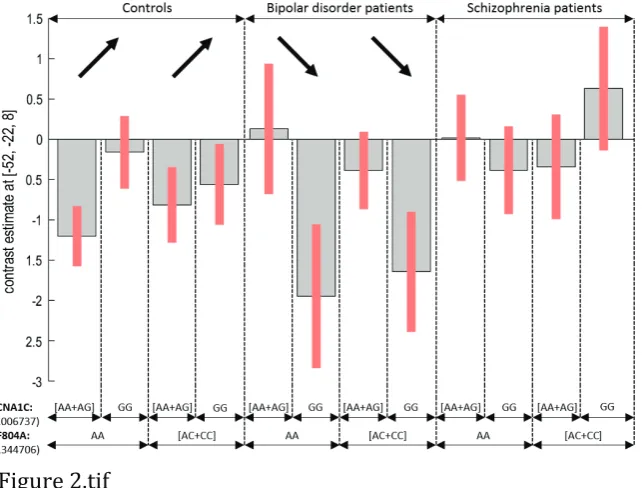
3.1.2. CACNA1C by diagnosis interaction
The effect of increased activation associated with risk allele A was significantly (voxel-level FWE p<0.05) higher in BD than in healthy volunteers in the superior temporal gyrus bilaterally (Z=4.72, ·p2=7.35% and Z=4.29, ·p2=6.52%; Figure 2) and R middle temporal gyrus (Z=4.53). The same effect was found in the L occipital gyrus (Z=4.67), the L calcarine sulcus (occipital gyrus; Z=4.34 and Z=4.30) and L lingual gyrus (Z=4.21). Furthermore, this effect was found as a trend in the R angular gyrus (Z=4.36; in which it signified lower deactivation), and in the L middle frontal gyrus (Z=4.24). The same genotype effect was also higher as a trend in SCZ patients than in controls in the R inferior frontal gyrus, pars opercularis (Z=4.31, ·p2=7.41%). No significant interaction effects were found when contrasting BD and SCZ.
The effect of increased activation associated with the risk allele A mentioned above in the L calcarine sulcus (occipital gyrus; Z=4.69, ·p2
=7.32%) and in the L middle frontal gyrus (Z=4.30), but not in the other regions, was significantly higher in psychotic patients as a whole than in healthy volunteers (voxel-level FWE p<0.05).
3.1.3. CACNA1C by ZNF804A genotype epistasis
When inspecting the healthy volunteers group alone, a significant 2-way genotype (at whole-brain voxel-level FWE p<0.05) interaction was found (Table 1): CACNA1C risk allele carriers activated less than non-risk allele homozygotes, within the ZNF804A risk allele homozygotes group, but the reverse was seen for ZNF804A non-risk allele carriers. This effect was found bilaterally in the precuneus (Z=5.05, ·p2
=15.39% and Z=4.73), posterior cingulate gyrus (Z=5.05 and Z=4.42), calcarine sulcus (occipital gyrus; Z=4.42 and Z=4.31) and thalamus (Z=4.75, 4.64 and Z=4.40). This same effect was found as a trend (k<5) in the L lingual gyrus (Z=4.26), R middle cingulate gyrus (Z=4.24) and R superior temporal gyrus (Z=4.21). (Note that, bilaterally in the precuneus and posterior cingulate gyrus and in the R calcarine sulcus (occipital gyrus) and superior temporal gyrus, the effect signified increased deactivation).
No other significant interactions between the ZNF804A and CACNA1C genotypes were found when inspecting the BD, SCZ alone or all patients with a history of psychosis groups as a whole.
3.1.4. ZNF804A by CACNA1C by diagnosis interaction
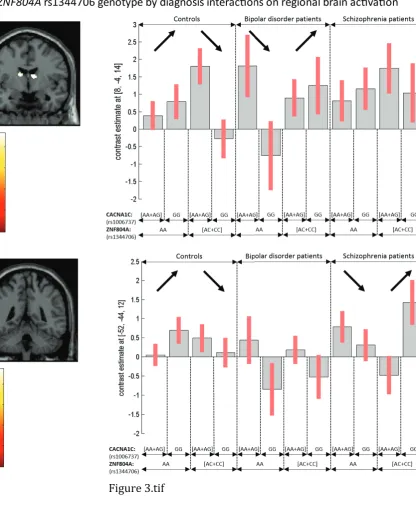
There were significant 3-way interactions between the ZNF804A genotype, CACNA1C genotype and diagnosis (at voxel-level FWE p<0.05; Table 1). The above genotype interaction effect significant in healthy subjects, was reversed in BD in the anterior cerebellum (vermis; Z=4.56, ·p2
=13.90%), the R thalamus (Z=4.55 and Z=4.37; Figure 3) and both hemisphere caudate nucleus (Z=4.52 and Z=4.46); and in SCZ in the L superior (Z=4.65, ·p2
non-risk allele homozygotes, in the ZNF804A non-risk allele homozygotes group, but the reverse was seen for ZNF804A non-risk allele carriers.
When comparing both patient groups, this genotype interaction effect was found, as trend (k<5), to be more pronounced in BD than in SCZ in the R medial caudate nucleus (Z=4.20, ·p2
=10.24%).
The previous genotype interaction was also found, at trend level, to be more pronounced in patients with a history of psychosis than in controls in the R anterior thalamus (Z=4.20, ·p2=8.87%).
3.2. Psycho-physiological interaction connectivity
For the CACNA1C SNP, there was a significant (voxel-level FWE p<0.05) genotype by diagnosis interaction in condition-specific connectivity between the seed region (L precentral gyrus/inferior frontal gyrus) and the L superior temporal gyrus (Z=5.07; Figure 1), L middle temporal gyrus (Z=4.80), whereby the risk allele carriers showed decreased connectivity versus non-risk allele homozygotes in SCZ, but not in controls (Table 1). In addition, this same interaction effect was found, as trend, in the L supramarginal gyrus (Z=4.29), and, in the SCZ alone, in the L superior temporal gyrus (Z=4.36). Inspecting the control group alone, we found increased connectivity between the seed region and the R precuneus (Z=4.51). No significant epistatic effects, or of diagnosis, were found.
No significant genotype effects were found at voxel-level FWE p<0.05 when using either a mask using the pre-selected Brodmann areas or spheres to restrict the analysis to previously implicated brain areas in the published literature.
3.4. Potentially confounding factors
We found no variable to have an effect (at p<0.01, uncorrected) on brain activation in areas that we report as being under a genotype effect. We also found no relevant change in effect size or foci of activation of genotype effects when these variables were introduced in the SPM ANOVA. Thirdly, no variable correlated with the peak activations values retrieved from our genotype effect analyses.
3.5. Gene expression
Using the Allen Brain Atlas, we found CACNA1C rs1006737 risk allele A to be associated with reduced mRNA levels of CACNA1C in total transcript levels (p>0.05, FDR-corrected) in the cerebellum and trends for exon-specific probes in the cerebellum and white matter (Supplementary Table 6). CACNA1C enriched areas were identified in the thalamic nuclei, denteate gyrus, frontal and occipital poles. Detailed information is presented in supplementary material 6.
4. Discussion
were altered in SCZ and BD groups - in regional brain activation and functional connectivity during verbal fluency – a task which engages brain regions and cognitive processes impaired in the two disorders. We found the CACNA1C genotype to modulate both brain activation and task-dependent effective connectivity – as assessed with PPI. We also found some of the genotype effect in some brain areas to be particularly pronounced in SCZ, BD or compared to health. In addition, we found an interaction effect of CACNA1C and ZNF804A genotypes on regional brain activation.
We found CACNA1C rs1006737 SNP to be associated with inefficient activation (i.e. increased activation when only correct trials were analysed, as we did) in prefrontal regions, which are typically implicated in SZ and BD. The superior temporal gyri bilaterally, the R middle temporal gyrus, the L occipital gyrus (whether or not within the calcarine sulcus area), and the L lingual gyrus were under a significant genotype x diagnosis interaction, whereby the presence of the risk allele increased inefficient activation in BD patients much more than in controls. Furthermore, this same effect was present, as trend, in the L middle frontal gyrus and R angular gyrus. In fact, in most of these areas, the genotype effect was significant in BD alone. The same interaction effect was also found as trend when considering SCZ versus controls, in the adjacent R inferior frontal gyrus, pars opercularis. When all psychotic patients were grouped together against controls, the interaction effects survived in the L middle frontal gyrus and in the L occipital gyrus within the calcarine sulcus area.
stronger in BD and SCZ, for the first time. As mentioned, given that task performance has been controlled for, increased activation in the risk genotype group could be interpreted as lower neuronal efficiency. This is compatible with the same observation of inefficiency, in an ill group, being found (as well as lower performance), for verbal fluency, in SCZ and, albeit less severely, of BD (Curtis et al. 2001, 2007; Costafreda et al. 2011; Gurung & Prata 2015). The rationale is that once there is impaired prefrontal capacity (provided by a risk genotype or illness), additional activation of local neuronal resources may be needed in order to maintain a good-enough task performance. No areas showed the opposite effect, i.e., over-activation in the protective genotype group.
Sub-cortically, the thalamus showed greater activation, bilaterally (albeit as a trend in the L thalamus), in risk allele carriers, irrespective of diagnosis (with the effect in the R thalamus also being significant in BD patients on their own). The thalamus plays a critical role in the coordination of information as it passes between several brain regions (Kruger 1986). A disruption of that information flow may give rise to some of the cardinal symptoms of SCZ and BD (Cronenwett & Csernansky 2010), as suggested by previous studies showing: 1) altered thalamic volumes in BD and SCZ patients (Radenbach et al. 2010; Smith et al. 2011); 2) reduced neuronal density in post-mortem thalamic samples of SCZ patients (Blennow et al. 1996); 3) altered thalamic glutamate receptor expression and elevated dopamine in thalamic sub-regions (Meador-Woodruff et al. 2003); 4) emergence of SCZ-like syndromes when illnesses, such as stroke, selectively damage the thalamus while sparing the rest of the brain (Crail-Melendez et al. 2013).
additive manner, with the most inefficient activation occurring when both risk alleles were present (compared to just one or the other being present). This interaction effect was also significantly stronger in the SCZ and BD groups when contrasted individually against the control group. In SCZ, this was seen in the L superior and middle temporal gyrus and in BD, in the anterior cerebellum (vermis), the R thalamus and the caudate nucleus (an area specifically implicated in psychosis (Hannan et al. 2010)). When the psychotic patients were contrasted against controls, the epistatic effect was stronger, at trend level, in the R anterior thalamus.
The abnormal thalamic responses above are quite consistent with thalamus-based explanations for the ‘cognitive dysmetria’ of SCZ that has been proposed to underlie cognitive and fluency effects in the illness (Andreasen et al. 1998); cognitive dysmetria being a special case of functional dysconnection. On a more general note, our results speak to the disconnection hypothesis of SCZ (Friston et al. 2016) at a number of levels. First, the polymorphisms we have shown to affect condition-specific connectivity affect the regulation of synaptic efficacy (and plasticity) thought to underlie the dysfunctional integration in syndromes like SCZ. In brief, these aberrant (usually inefficient, disinhibited) responses to (cognitive) task-induced processes are thought to reflect a failure of gain control, synaptic excitation inhibition balance or, in the context of predictive coding, precision control in hierarchical message passing in the brain.
striatum, which has been repeatedly implicated in the positive (i.e. psychotic) symptoms of SCZ (Laruelle & Abi-Dargham 1999; Kirschner et al. 2018) and with abnormal dopamine levels (Laruelle & Abi-Dargham 1999; Breier et al. 1997; Abi-Dargham et al. 1998; Laruelle et al. 1999). These findings are consistent with the hypothesis that both these polymorphisms increase risk for psychosis. The two-SNP additive interaction was not seen independently of diagnosis, nor was the opposite direction of effect seen anywhere in the brain. The former suggests that the existence of other factors specific to SCZ, BD or psychosis make subjects more susceptible to the potential detrimental effects on brain function of the simultaneous presence of both the risk variants of these genome-wide associated polymorphisms.
associated with amygdalar functional connectivity with the L fronto-temporal areas (Wang et al. 2011).
Importantly, the above effects on functional and structural connectivity are further consistent with our gene expression findings: a novel association of the CACNA1C rs1006737 risk allele with reduced mRNA levels of CACNA1C in white matter. This has also been independently found in the superior temporal gyrus (Eckart et al. 2016), an area typically affected in BD and SCZ (Ratnanather et al. 2013). Nevertheless, other studies with the dorsolateral prefrontal cortex (Bigos et al. 2010) and human induced-neurons (Yoshimizu et al. 2015), suggest the risk allele may also increase CACNA1C transcription at least in other areas - which may reflect a very finely tuned regulation of this gene in the brain.
The risk allele association with reduced gene expression was also found in the cerebellum – which is a direct replication of a previous independent work (Gershon et al. 2014). Indeed, we found this area to be recruited in ‘verbal fluency’ compared to ‘repetition’ (control) trials (Tecelão et al. 2018), as has been implicated by others using this task (Peterburs et al. 2010). Further studies using specific cerebellum-recruiting paradigms (i.e. sensorimotor tasks) will allow a clearer examination of this polymorphism’s impact on cerebellar function.
the fact that if positive findings could be achieved it is more likely that they appear in areas where the channel is most expressed and presumably more important from a functional point of view.
As a limitation of our ANOVA interaction tests, we note that the size in each of the smallest homogeneous groups (or “cells” in the parametric design matrix) which combine the diagnostic group, the ZNF804A rs1344706 and the CACNA1C rs1006737 genotype, is modest, albeit the vast majority (10 in 12 groups) is over 10 subjects and up to 26 subjects (see Materials and Methods). Although the sample size we used herein compares well with that of contemporary functional imaging genetic studies of these and other SCZ- and BD-risk polymorphisms (Gurung & Prata 2015), we recommend future independent and meta-analytical evidence is gathered to confirm these genes’ role, and their interplay, at the systems brain level.
5. Conclusions
affect neuronal function and, as such, increase the risk for psychosis should be encouraged. These studies will be critical for our understanding of the pathophysiological mechanisms of these disorders and, from there, putatively derive new drug targets to improve their clinical management.
Acknowledgments
References
Abi-Dargham, A., Gil, R., Krystal, J., Baldwin, R.M., Seibyl, J.P., Bowers, M., van Dyck, C.H., Charney, D.S., Innis, R.B. & Laruelle, M. (1998) Increased striatal dopamine transmission in schizophrenia: confirmation in a second cohort. Am J Psychiatry 155, 761–767.
American Psychiatric Association. (1994) Diagnostic and statistical manual of mental disorders: DSM-IV. American Psychiatric Association, Washington, DC.
Andreasen, N.C., Paradiso, S. & O’Leary, D.S. (1998) “Cognitive Dysmetria” as an Integrative Theory of Schizophrenia: A Dysfunction in Cortical-Subcortical-Cerebellar Circuitry? Schizophr Bull 24, 203–218.
Bigos, K.L., Mattay, V.S., Callicott, J.H., Straub, R.E., Vakkalanka, R., Kolachana, B., Hyde, T.M., Lipska, B.K., Kleinman, J.E. & Weinberger, D.R. (2010) Genetic Variation in CACNA1C Affects Brain Circuitries Related to Mental Illness. Arch Gen Psychiatry 67, 939–945.
Blennow, K., Davidsson, P., Gottfries, C.-G., Ekman, R. & Heilig, M. (1996) Synaptic degeneration in thalamus in schizophrenia. The Lancet 348, 692–693.
Breier, A., Su, T.-P., Saunders, R., Carson, R.E., Kolachana, B.S., De Bartolomeis, A., Weinberger, D.R., Weisenfeld, N., Malhotra, A.K., Eckelman, W.C. & others. (1997) Schizophrenia is associated with elevated amphetamine-induced synaptic dopamine concentrations: evidence from a novel positron emission tomography method. Proc Natl Acad Sci94, 2569–2574.
Bryois, J., Buil, A., Evans, D.M., Kemp, J.P., Montgomery, S.B., Conrad, D.F., Ho, K.M., Ring, S., Hurles, M., Deloukas, P., Davey Smith, G. & Dermitzakis, E.T. (2014) Cis and Trans Effects of Human Genomic Variants on Gene Expression. PLoS Genet 10, e1004461.
Cardno, A.G., Marshall, E.J., Coid, B., MacDonald, A.M., Ribchester, T.R., Davies, N.J., Venturi, P., Jones, L.A., Lewis, S.W., Sham, P.C., Gottesman, I.I., Farmer, A.E., McGuffin, P., Reveley, A.M. & Murray, R.M. (1999) Heritability estimates for psychotic disorders: the Maudsley twin psychosis series. Arch Gen Psychiatry 56, 162–168.
Costafreda, S.G., Fu, C.H., Picchioni, M., Toulopoulou, T., McDonald, C., Kravariti, E., Walshe, M., Prata, D., Murray, R.M. & McGuire, P.K. (2011) Pattern of neural responses to verbal fluency shows diagnostic specificity for schizophrenia and bipolar disorder. BMC Psychiatry 1, 1–10.
Cronenwett, W.J. & Csernansky, J. (2010) Thalamic Pathology in Schizophrenia. In Swerdlow, N.R. (ed), Behavioral Neurobiology of Schizophrenia and Its Treatment, Springer Berlin Heidelberg, Berlin, Heidelberg, pp. 509–528.
Curtis, V.A., Bullmore, E.T., Brammer, M.J., Wright, I.C., Williams, S.C., Morris, R.G., Sharma, T.S., Murray, R.M. & McGuire, P.K. (1998) Attenuated frontal activation during a verbal fluency task in patients with schizophrenia. Am J Psychiatry 155, 1056–1063.
Curtis, V.A., Bullmore, E.T., Morris, R.G., Brammer, M.J., Williams, S.C., Simmons, A., Sharma, T., Murray, R.M. & McGuire, P.K. (1999) Attenuated frontal activation in schizophrenia may be task dependent. Schizophr Res 37, 35–44.
Curtis, V.A., Dixon, T.A., Morris, R.G., Bullmore, E.T., Brammer, M.J., Williams, S.C.R., Sharma, T., Murray, R.M. & McGuire, P.K. (2001) Differential frontal activation in schizophrenia and bipolar illness during verbal fluency. J Affect Disord 66, 111–121.
Daban, C., Martinez-Aran, A., Torrent, C., Tabarés-Seisdedos, R., Balanzá-Martínez, V., Salazar-Fraile, J., Selva-Vera, G. & Vieta, E. (2006) Specificity of Cognitive Deficits in Bipolar Disorder versus Schizophrenia. Psychother Psychosom 75, 72–84.
Dietsche, B., Backes, H., Laneri, D., Weikert, T., Witt, S.H., Rietschel, M., Sommer, J., Kircher, T. & Krug, A. (2014) The impact of a CACNA1C gene polymorphism on learning and hippocampal formation in healthy individuals: A diffusion tensor imaging study. NeuroImage 89, 256–261.
Eckart, N., Song, Q., Yang, R., Wang, R., Zhu, H., McCallion, A.S. & Avramopoulos, D. (2016) Functional Characterization of Schizophrenia-Associated Variation in CACNA1C. PLOS ONE 11, e0157086.
supports a role for ANK3 and CACNA1C in bipolar disorder. Nat Genet 40, 1056– 1058.
Franke, B., Vasquez, A.A., Veltman, J.A., Brunner, H.G., Rijpkema, M. & Fernández, G. (2010) Genetic Variation in CACNA1C, a Gene Associated with Bipolar Disorder, Influences Brainstem Rather than Gray Matter Volume in Healthy Individuals. Biol Psychiatry 68, 586–588.
Frazier, T.W., Youngstrom, E.A., Frankel, B.A., Zunta-Soares, G.B., Sanches, M., Escamilla, M., Nielsen, D.A. & Soares, J.C. (2014) Candidate gene associations with mood disorder, cognitive vulnerability, and fronto-limbic volumes. Brain Behav 4, 418–430.
Friston, K., Brown, H.R., Siemerkus, J. & Stephan, K.E. (2016) The dysconnection hypothesis (2016). Schizophr Res 176, 83–94.
Fu, C.H.Y., Morgan, K., Suckling, J., Williams, S.C.R., Andrew, C., Vythelingum, G.N. & McGuire, P.K. (2002) A Functional Magnetic Resonance Imaging Study of Overt Letter Verbal Fluency Using a Clustered Acquisition Sequence: Greater Anterior Cingulate Activation with Increased Task Demand. NeuroImage 17, 871–879.
Gershon, E.S., Grennan, K., Busnello, J., Badner, J.A., Ovsiew, F., Memon, S., Alliey-Rodriguez, N., Cooper, J., Romanos, B. & Liu, C. (2014) A rare mutation of CACNA1C in a patient with bipolar disorder, and decreased gene expression associated with a bipolar-associated common SNP of CACNA1C in brain. Mol Psychiatry 19, 890–894.
Green, E.K., Grozeva, D., Jones, I., Jones, L., Kirov, G., Caesar, S., Gordon-Smith, K., Fraser, C., Forty, L., Russell, E. & others. (2010) The bipolar disorder risk allele at CACNA1C also confers risk of recurrent major depression and of schizophrenia. Mol Psychiatry 15, 1016–1022.
Gurung, R. & Prata, D.P. (2015) What is the impact of genome-wide supported risk variants for schizophrenia and bipolar disorder on brain structure and function? A systematic review. Psychol Med 45, 2461–2480.
Hannan, K.L., Wood, S.J., Yung, A.R., Velakoulis, D., Phillips, L.J., Soulsby, B., Berger, G., McGorry, P.D. & Pantelis, C. (2010) Caudate nucleus volume in individuals at ultra-high risk of psychosis: A cross-sectional magnetic resonance imaging study. Psychiatry Res Neuroimaging 182, 223–230.
Kempton, M.J., Gaia, R., Vassos, E., Tatarelli, R., Girardi, P., Collier, D. & Frangou, S. (2009) Effects of the CACNA1C risk allele for bipolar disorder on cerebral gray matter volume in healthy individuals. Am J Psychiatry 166, 1413–1414.
Kieseppä, T., Partonen, T., Haukka, J., Kaprio, J. & Lönnqvist, J. (2004) High Concordance of Bipolar I Disorder in a Nationwide Sample of Twins. Am J Psychiatry 161, 1814– 1821.
Kirschner, M., Hager, O.M., Muff, L., Bischof, M., Hartmann-Riemer, M.N., Kluge, A., Habermeyer, B., Seifritz, E., Tobler, P.N. & Kaiser, S. (2018) Ventral Striatal Dysfunction and Symptom Expression in Individuals With Schizotypal Personality Traits and Early Psychosis. Schizophr Bull 44, 147–157.
Krabbendam, L., Arts, B., van Os, J. & Aleman, A. (2005) Cognitive functioning in patients with schizophrenia and bipolar disorder: A quantitative review. Schizophr Res 80, 137–149.
Krug, A., Nieratschker, V., Markov, V., Krach, S., Jansen, A., Zerres, K., Eggermann, T., Stöcker, T., Shah, N.J., Treutlein, J., Mühleisen, T.W. & Kircher, T. (2010) Effect of CACNA1C rs1006737 on neural correlates of verbal fluency in healthy individuals. NeuroImage 49, 1831–1836.
Kruger, L. (1986) Neuroanatomy: the thalamus. , Science 232, 1028–9.
Lancaster, J.L., Woldorff, M.G., Parsons, L.M., Liotti, M., Freitas, C.S., Rainey, L., Kochunov, P.V., Nickerson, D., Mikiten, S.A. & Fox, P.T. (2000) Automated Talairach atlas labels for functional brain mapping. Hum Brain Mapp 10, 120–131.
Laruelle, M. & Abi-Dargham, A. (1999) Dopamine as the wind of the psychotic fire: new evidence from brain imaging studies. J Psychopharmacol (Oxf) 13, 358–371.
Laruelle, M., Abi-Dargham, A., Gil, R., Kegeles, L. & Innis, R. (1999) Increased dopamine transmission in schizophrenia: relationship to illness phases. Biol Psychiatry 46, 56– 72.
Levy, N.A. & Janicak, P.G. (2000) Calcium channel antagonists for the treatment of bipolar disorder. Bipolar Disord 2, 108–119.
Maldjian, J.A., Laurienti, P.J., Kraft, R.A. & Burdette, J.H. (2003) An automated method for neuroanatomic and cytoarchitectonic atlas-based interrogation of fMRI data sets. NeuroImage 19, 1233–1239.
Mallas, E.-J., Carletti, F., Chaddock, C.A., Shergill, S., Woolley, J., Picchioni, M.M., McDonald, C., Toulopoulou, T., Kravariti, E., Kalidindi, S., Bramon, E., Murray, R., Barker, G.J. & Prata, D.P. (2016a) The impact of CACNA1C gene, and its epistasis with ZNF804A, on white matter microstructure in health, schizophrenia and bipolar disorder. Genes Brain Behav.
psychosis-risk gene ZNF804A impacts on white matter microstructure in health, schizophrenia and bipolar disorder. PeerJ 4, e1570.
Meador-Woodruff, J.H., Clinton, S.M., Beneyto, M. & McCullumsmith, R.E. (2003) Molecular Abnormalities of the Glutamate Synapse in the Thalamus in Schizophrenia. Ann N Y Acad Sci 1003, 75–93.
Mechelli, A., Prata, D.P., Fu, C.H.Y., Picchioni, M., Kane, F., Kalidindi, S., McDonald, C., Demjaha, A., Kravariti, E., Toulopoulou, T., Murray, R., Collier, D.A. & McGuire, P.K. (2008) The effects of neuregulin1 on brain function in controls and patients with schizophrenia and bipolar disorder. NeuroImage 42, 817–826.
Nyegaard, M., Demontis, D., Foldager, L., Hedemand, A., Flint, T.J., Sørensen, K.M., Andersen, P.S., Nordentoft, M., Werge, T., Pedersen, C.B., Hougaard, D.M., Mortensen, P.B., Mors, O. & Børglum, A.D. (2010) CACNA1C (rs1006737) is associated with schizophrenia. Mol Psychiatry 15, 119–121.
Peterburs, J., Bellebaum, C., Koch, B., Schwarz, M. & Daum, I. (2010) Working Memory and Verbal Fluency Deficits Following Cerebellar Lesions: Relation to Interindividual Differences in Patient Variables. The Cerebellum 9, 375–383.
Prata, D.P., Mechelli, A., Fu, C.H.Y., Picchioni, M., Kane, F., Kalidindi, S., McDonald, C., Howes, O., Kravariti, E., Demjaha, A., Toulopoulou, T., Diforti, M., Murray, R.M., Collier, D.A. & McGuire, P.K. (2009a) Opposite Effects of Catechol-O-Methyltransferase Val158Met on Cortical Function in Healthy Subjects and Patients with Schizophrenia. Biol Psychiatry 65, 473–480.
Prata, D.P., Mechelli, A., Picchioni, M.M., Fu, C.H., Toulopoulou, T., Bramon, E., Walshe, M., Murray, R.M., Collier, D.A. & McGuire, P. (2009b) Altered effect of dopamine transporter 32 UTR VNTR genotype on prefrontal and striatal function in schizophrenia. Arch Gen Psychiatry 66, 1162–1172.
R Core Team. (2016) R: A language and environment for statistical computing. R Foundation for Statistical Computing, Vienna, Austria.
Radenbach, K., Flaig, V., Schneider-Axmann, T., Usher, J., Reith, W., Falkai, P., Gruber, O. & Scherk, H. (2010) Thalamic volumes in patients with bipolar disorder. Eur Arch Psychiatry Clin Neurosci 260, 601–607.
Hernandez, D.G., Nalls, M.A., Singleton, A.B., Traynor, B., van der Brug, M., Ferrucci, L., Johnson, R., Zielke, R., Longo, D.L., Troncoso, J., Zonderman, A., Coin, L., de Silva, R., Cookson, M.R., Singleton, A.B., Hardy, J., Ryten, M. & Weale, M.E. (2014) Genetic variability in the regulation of gene expression in ten regions of the human brain. Nat Neurosci 17, 1418–1428.
Ratnanather, J.T., Poynton, C.B., Pisano, D.V., Crocker, B., Postell, E., Cebron, S., Ceyhan, E., Honeycutt, N.A., Mahon, P.B. & Barta, P.E. (2013) Morphometry of superior temporal gyrus and planum temporale in schizophrenia and psychotic bipolar disorder. Schizophr Res 150, 476–483.
Smith, M.J., Wang, L., Cronenwett, W., Mamah, D., Barch, D.M. & Csernansky, J.G. (2011) Thalamic morphology in schizophrenia and schizoaffective disorder. J Psychiatr Res 45, 378–385.
Tecelão, D., Mendes, A., Martins, D., Bramon, E., Toulopoulou, T., Kravariti, E., Murray, R. & Prata, D. (2018) The impact of psychosis genome-wide associated ZNF804A variation on verbal fluency connectivity. J Psychiatr Res 98, 17–21.
Uemura, T., Green, M. & Warsh, J.J. (2015) CACNA1C SNP rs1006737 associates with bipolar I disorder independent of the Bcl-2 SNP rs956572 variant and its associated effect on intracellular calcium homeostasis. World J Biol Psychiatry 1–10.
Wang, F., McIntosh, A.M., He, Y., Gelernter, J. & Blumberg, H.P. (2011) The association of genetic variation in CACNA1C with structure and function of a frontotemporal system: Frontotemporal effects of CACNA1C. Bipolar Disord 13, 696–700.
Woon, P.S., Sum, M.Y., Kuswanto, C.N., Yang, G.L., Sitoh, Y.Y., Soong, T.W., Lee, T.S., Nowinski, W.L. & Sim, K. (2014) CACNA1C genomewide supported psychosis genetic variation affects cortical brain white matter integrity in Chinese patients with schizophrenia. J Clin Psychiatry75, e1284-1290.
Figure legends
activated more than G homozygotes, particularly so in BD patients. Part B: Interaction of CACNA1C rs1006737 genotype and SCZ diagnosis on PPI, where the risk allele A carriers show decreased connectivity between the seed and L superior and middle temporal gyrus (plotted) in SCZ patients but the opposite in healthy controls.
Figure 2 – Interaction of CACNA1C rs1006737 genotype with diagnosis on “verbal fluency > repetition” brain activation, where the risk allele (A) was associated, at whole-brain voxel-level FWE p<0.05, with increased activation in BD patients but the opposite in healthy controls, in the L superior temporal gyrus (plotted) as well as in its R homologue.
Figure 3 – Three-way interactions between the ZNF804A rs1344706, CACNA1C rs1006737 genotype and diagnosis on “verbal fluency > repetition” activation. Among the CACNA1C risk allele (A) carriers, ZNF804A risk allele A homozygotes activated more than their
Accepted Article
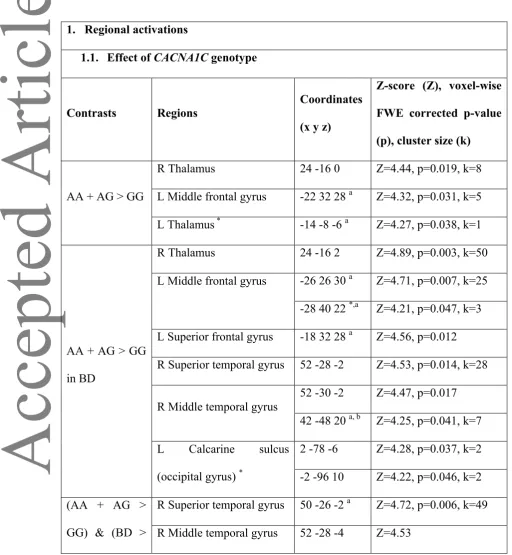
Table 1 – Regions under an effect of CACNA1C rs1006737, the risk allele being allele
A. All inferences correspond to results corrected for whole-brain voxel-wise FWE
multiple comparisons correction at p<0.05. Cluster size (k) is given only for the peak of
each cluster.
1. Regional activations
1.1. Effect of CACNA1C genotype
Contrasts Regions
Coordinates
(x y z)
Z-score (Z), voxel-wise
FWE corrected p-value
(p), cluster size (k)
AA + AG > GG
R Thalamus 24 -16 0 Z=4.44, p=0.019, k=8
L Middle frontal gyrus -22 32 28 a Z=4.32, p=0.031, k=5
L Thalamus * -14 -8 -6 a Z=4.27, p=0.038, k=1
AA + AG > GG
in BD
R Thalamus 24 -16 2 Z=4.89, p=0.003, k=50
L Middle frontal gyrus -26 26 30 a Z=4.71, p=0.007, k=25
-28 40 22 *,a Z=4.21, p=0.047, k=3
L Superior frontal gyrus -18 32 28 a Z=4.56, p=0.012
R Superior temporal gyrus 52 -28 -2 Z=4.53, p=0.014, k=28
R Middle temporal gyrus
52 -30 -2 Z=4.47, p=0.017
42 -48 20 a, b Z=4.25, p=0.041, k=7
L Calcarine sulcus
(occipital gyrus) *
2 -78 -6 Z=4.28, p=0.037, k=2
-2 -96 10 Z=4.22, p=0.046, k=2
Accepted Article
CON) L Superior temporal gyrus -52 -22 8 Z=4.29, p=0.036, k=6
L Occipital gyrus -2 -96 8 Z=4.67, p=0.008, k=12
L Calcarine sulcus
(occipital gyrus)
-20 -68 8 Z=4.34, p=0.029, k=45
-6 -72 10 Z=4.30, p=0.034
L Lingual gyrus 0 -72 8 Z=4.21, p=0.047
R Angular gyrus *,b 42 -66 38 a Z=4.36, p=0.027, k=1
L Middle frontal gyrus * -32 48 20 a Z=4.24, p=0.043, k=2
(AA + AG >
GG) & (SCZ >
CON)
R Inferior frontal gyrus,
pars opercularis * 60 16 14 Z=4.31, p=0.032, k=3
AA + AG > GG
in PSYCH
R Precuneus *,b 14 -50 14 a Z=4.24, p=0.042, k=1
(AA + AG >
GG) & (PSYCH
> CON)
L Calcarine sulcus
(occipital gyrus)
-20 -66 10 Z=4.69, p=0.007, k= 53
L Middle frontal gyrus -32 48 18 a Z=4.30, p=0.033, k=10
1.2. Effect of CACNA1C x ZNF804A genotype interaction
(AA + AG <
GG) & (AA >
AC + CC) in
CON
L Precuneus c -2 -52 20 Z=5.05, p=0.001, k=223
R Precuneus c 2 -52 20 Z=4.73, p=0.006
L Posterior cingulate gyrus c -2 -50 20 Z=5.05, p=0.001
R Posterior cingulate gyrus c 2 -44 16 a Z=4.42, p=0.021
L Calcarine sulcus (occipital
Accepted Article
2 -20 2 Z=4.64, p=0.009
L Thalamus -2 -20 4 a Z=4.40
L Lingual gyrus * -8 -36 2 a Z=4.26, p=0.040, k=3
R Middle cingulate gyrus * -2 -28 26 a Z=4.24, p=0.043, k=2
R Superior temporal gyrus
*,c 64 -22 16 Z=4.21, p=0.048, k=1
(AA + AG >
GG) & (AA >
AC + CC) &
(BD > CON)
Anterior Cerebellum
(Vermis) b
2 -50 10 Z=4.56, p=0.012, k=24
R Thalamus
8 -4 14 Z=4.55, p=0.013, k=63
4 -14 18 a, d Z=4.37, p=0.026
L Caudate nucleus -14 -4 16 a Z=4.52, p=0.015, k=26
R Caudate nucleus 12 -2 14 a Z=4.46, p=0.018
(AA + AG >
GG) & (AA >
AC + CC) &
(SCZ > CON)
L Superior temporal gyrus -52 -44 12 a Z=4.65, p=0.008, k=45
L Middle temporal gyrus -54 -44 10 a Z=4.55, p=0.012
(AA + AG >
GG) & (AA >
AC + CC) &
(BD > SCZ)
R Caudate nucleus * 12 –2 16 e Z=4.20, p=0.049, k=1
(AA + AG >
GG) & (AA >
Accepted Article
2. Psychophysiological interaction with L Precentral gyrus/inferior frontal gyrus,
pars opercularis (seed corresponding to peak of main effect of task)
2.1. Effect of CACNA1C genotype
(AA + AG >
GG) & (SCZ <
CON)
L Superior temporal gyrus -52 -44 14 a Z=5.07, p=0.002, k=60
L Middle temporal gyrus -52 -46 14 a Z=4.80, p=0.006
L Supramarginal gyrus * 46 -40 32 a Z=4.29, p=0.044, k=2
AA + AG <
GG in SCZ
L Superior temporal gyrus * -52 -44 14 a Z=4.36, p=0.034, k=3
AA + AG >
GG in CON f R Precuneus 14 -62 34
a Z=4.51, p=0.018, k=15
* Trend results: clusters with less than 5 clusters.
a Peak localized in the nearby white matter.
b Region associated with decreased deactivation.
c Regions associated with increased deactivation.
d Anterior part of the thalamus.
e Medial part of the caudate nucleus.
f Only present in the ANOVA comprising controls and patients experiencing psychosis.
AA, adenine-adenine; AG, adenine-guanine, GG, guanine-guanine; BD, bipolar
disorder; SCZ, schizophrenia; PSYCH, patients with a history of psychosis; R, right; L,