2020 4th International Conference on Modelling, Simulation and Applied Mathematics (MSAM 2020) ISBN: 978-1-60595-674-9
Simulation to Predict the Impact of Public Transport Changes on Air
Pollutants Emissions
Juan D. ARISTIZABAL
1, Daniela AZUMENDI
1,
Juan F. FRANCO
1and Ivan MURA
2,*1
Universidad de los Andes, Bogotá, Colombia
2
Duke Kunshan University, Kunshan, Jiangsu, China *Corresponding author
Keywords: Air quality, Discrete-event simulation, Transportation networks, Urban mobility planning.
Abstract. Predicting the effects of the introduction of alternative transportation means on air quality is an important task for urban mobility planners. This study proposes a methodology that uses simulation to estimate the impact of changes in public transport on the traffic emissions of PM2.5. By using mobility planning information simulation models can be built, which can provide estimation of the dynamics of traffic over time. Then, coupling simulated traffic with emission factors of vehicles, an emission model can be used to estimate the total amount of PM2.5 emitted. With this approach, the effect of changes in the public transportation system can be assessed with respect to PM2.5 emissions. In the paper, we explore a case study in the city of Bogotá, Colombia, when a bus rapid transport system is to be added alongside a major city avenue.
Introduction
In big metropolitan areas of the developing world, the generation of traffic emissions is often disproportionate compared to geographic size. This is due to the lack of adequate urban planning, and on the difficulties inherent to transportation networks management. Projects regarding mobility and transport means are often justified by authorities pleading a reduction in tailpipe emissions, claims not always supported by mathematical models. Therefore, the definition of modelling methodologies and computational approaches to support or contradict these claims is of particular relevance.
This work proposes a methodology for predicting the emissions on a road corridor, considering the traffic, the topology of the corridor, the characteristics of the automotive park and finally its emissions. We propose assimilating data on mobility and the geometry of the corridor into a traffic simulator to predict the occupancy of the corridor, and to feed the predicted traffic levels into an emission model that allows evaluating PM2.5 emissions. We chose this contaminant because multiple epidemiology studies found a high correlation between its concentration and severe diseases [3], [14].
We present a case-study that serves the purposes of both introducing our approach as well as to present its application. We consider Bogotá, the capital city of Colombia, where according to official mobility data reported in [8], a person spends each day, on average, 125 minutes traveling. We focus on a main corridor, called Carrera Séptima, where the city transit authority plans to introduce a Bus Rapid Transit System (BRT) to replace the current offer of public transportation. By our prediction methodology, we assess the expected change in PM2.5 emissions along the corridor.
Methodology
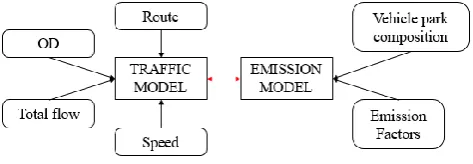
We use a discrete-event simulation (DES) to model the traffic infrastructure and the agents that use it, i.e. vehicles. We explicitly represent the interaction among agents due to infrastructure sharing. To build the model, sufficient input data to characterize the following elements is required:
Figure 1. Graphical description of the proposed methodology.
the routes to be modeled, which define the physical space of agents' movement, and must be geo-located for a proper representation;
the offered load, which includes defining the arrival rates of vehicles and their trajectories along the network;
the speed of movement, which can be introduced either in a parametric form (for instance drawn from a probability distribution), or described as a function of other simulated variables, e.g. vehicle density.
The emission model uses the composition of the vehicle park, and estimates an emission factors for each type of vehicle in it, considering type, model, age and emission standard (e.g. EURO IV).
Combining the data on vehicle park composition with the EFs estimate for each vehicle type completes the emission model. When this information is coupled with the vehicle populations over the segments obtained by simulation, the overall emission can be quantified. Our approach is particularly useful to analyze what-if scenarios in terms of PM2.5 emissions. DES models can easily accommodate changes in the offered load, network topology, evaluation scenarios. Similarly, changes in the automotive park are easily accounted for by updating the EFs values. It then becomes possible to answer quantitative questions about the impact on public health of mobility changes. We see in the next section examples of such evaluations for a case study in Bogotá.
Application to A Case Study
Bogotá is city with about 8 million inhabitants. It has a multi-modality public transportation system, which a growing Bus Rapid Transit (BRT) network called Transmilenio. The next expansion of the
Transmilenio network is to occur along Carrera Séptima. An estimation of how significant the reduction in emissions will be has not been reported by public authorities. Thus, we chose this case study for providing an answer to question of general relevance. In the following, we first describe the process by which we built the traffic and the emission models, then we present the verification and validation steps we conducted to gain confidence on the models, and finally we introduce a set of interesting scenarios to be evaluated.
Traffic Model
Figure 2. A snapshot of the SIMIO traffic simulation model.
To estimate the offered load for parametrizing the traffic simulator we used the data from a large mobility survey conducted at the city level [8], which provides the information used by Bogotá transit authority for mobility management in the city. The data contained in the survey allows obtaining time, transport mean and latitude/longitude of the start/end points of trips in the city.
Emission Model
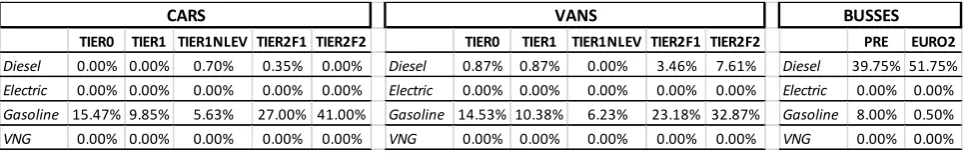
To define the emission model, we first addressed the characterization of the vehicle park, for each transportation modality taken into account in the study. Two main variables are to be considered: the used fuel and the emission standard followed, the latter one to be considered dependent on the age of the vehicle. This information was extracted from a report of the city transport authority [7]. The vehicle park composition is shown in Table 1.
Table 1. Vehicle park composition.
The following step was to assign to each vehicle a properly estimated emission factor (EF), of the form g PM2.5/km, which when combined with the vehicle traveled distance (obtained from the traffic simulator) allows determining total emissions along the corridor.
Verification and Validation
According to [1], there are several ways to verify the operational model: one of them is to examine selected output variables to see if they react reasonably to changes in the input settings. For our model, we evaluated the response of the model to a 50% reduction in the arrival rate. The expected outcome was a diminution of around the 50% in the overall computed emissions of PM2.5 for each segment. The results we obtained were satisfactory, with the reduction in each segment oscillating between the 49% and the 51.2%.
Still in [1], the authors describe validation as the set of activities aiming at increasing the confidence that can be put on the model being a truthful representation of the real system. Validation includes activities of different types, like face validity, i.e. having experts’ opinion on how reasonably good is the model in representing the real system, or comparing model input-output transformations with the corresponding input-output transformations for the real system. We went through both types of checks. We realized the first one with traffic authorities of the city, and the second one by comparing two distinct output variables (travelling time and throughput) against measurements not used for the calibration of the model.
Model Evaluation Scenarios
To define evaluation scenarios of interest for decision-makers, we took into consideration those variables that entail uncertainty:
TIER0 TIER1 TIER1NLEV TIER2F1 TIER2F2 TIER0 TIER1 TIER1NLEV TIER2F1 TIER2F2 PRE EURO2
Diesel 0.00% 0.00% 0.70% 0.35% 0.00% Diesel 0.87% 0.87% 0.00% 3.46% 7.61% Diesel 39.75% 51.75%
Electric 0.00% 0.00% 0.00% 0.00% 0.00% Electric 0.00% 0.00% 0.00% 0.00% 0.00% Electric 0.00% 0.00%
Gasoline 15.47% 9.85% 5.63% 27.00% 41.00% Gasoline 14.53% 10.38% 6.23% 23.18% 32.87% Gasoline 8.00% 0.50%
VNG 0.00% 0.00% 0.00% 0.00% 0.00% VNG 0.00% 0.00% 0.00% 0.00% 0.00% VNG 0.00% 0.00%
[image:3.595.57.540.381.458.2]BRT project may be canceled. Hence, it makes sense to consider both scenarios where modalities do and do not change. This variable is called System and the two associated values are BRT and No BRT.
The type of fuel used by the new bus fleet could be gasoline, diesel, vehicular natural gas and hybrid systems. The variable is named Fuel, and its possible values are Current, i.e. same as for the current vehicle park, Gasoline, Diesel, VNG and Hybrid.
The introduction of BRT should to lead to a reduction in the private car usage. This variable is called CFR (for Car Fleet Reduction) and we considered a nominal value of 5% and an optimistic value of 10%.
If the BRT were introduced, the fleet size would reduce (BRT busses have much larger capacity). We introduce a variable called BFR (for Bus Fleet Reduction) and we considered its nominal value to be 80% (transport authority guess) and its base value 0% (the latter value is for scenarios where the BRT is not implemented). We also consider a cautionary value of 50%, as the nominal value of reduction has not been agreed upon.
[image:4.595.197.397.413.534.2]We built the 9 what-if scenarios in Table 2, which define 9 experiments based on the levels of 4 factors. Scenario 1 represents the current transport network. Having it allows to compare the implementation of any public transportation policy with the current situation. Scenario 6 is for the possibility of not implementing a BRT; comparing it to the current situation permits evaluating the impacts of replacing the current bus fleet with a cleaner one in terms of the used fuel. By comparing scenarios 2 to 5, we estimate differences among distinct implementations of the BRT system, with bus fleets of different fuel types. Finally, by comparing scenario 4 against scenario 9 we can establish be the effect of the uncertainty associated with the estimate of the bus fleet size reduction, when the new busses are fueled by VNG.
Table 2. What-if scenarios of interest for analysis.
ID System Fuel CFR BFR 1 No BRT Current 0% 0%
2 BRT Diesel 5% 80%
3 BRT Gasoline 5% 80%
4 BRT VNG 5% 80%
5 BRT Hybrid 5% 80%
6 No BRT VNG 0% 0%
7 BRT VNG 0% 80%
8 BRT VNG 10% 80%
9 BRT VNG 5% 50%
Results
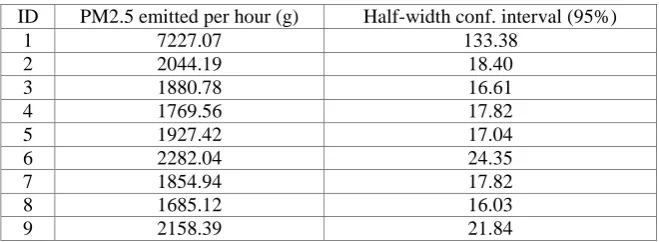
We analyze the morning rush hours, when emissions are at their maximum. In Table 3 we present model results for the total PM2.5 emitted (in grams/hour), for each considered scenarios. We report the half-width of the confidence interval obtained by simulation, at a confidence level of 95%.
Table 3. Model results for the total rate of PM2.5 emission during the peak hour.
ID PM2.5 emitted per hour (g) Half-width conf. interval (95%)
1 7227.07 133.38
2 2044.19 18.40
3 1880.78 16.61
4 1769.56 17.82
5 1927.42 17.04
6 2282.04 24.35
7 1854.94 17.82
8 1685.12 16.03
9 2158.39 21.84
[image:4.595.133.463.633.754.2]compared to Scenario 1, which we show in Fig. 3. Our model indicates that a BRT system like the one proposed would reduce of at least 70% (Scenario 9) the current emissions. Another important conclusion is that the sole replacement of the bus fleet for one fueled by VNG, even without the introduction of the BRT (i.e. Scenario 6), would generate a reduction of emissions of around the 68%. This finding confirms that public transport vehicles are major contributors to the current levels of city pollution, a fact already pointed out by several works (see for instance [5], [2]).
Figure 3. Vehicle park composition.
Comparing Vehicle Fueling Alternatives
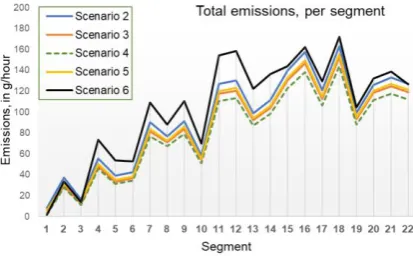
[image:5.595.194.401.457.585.2]In this subsection, we analyze scenarios 2-5, which differ only for the type of fuel busses would use in the new transport network. Since scenario 6 is also a fuel change scenario, we will add it to our analysis. In Fig. 4 we compare the average PM2.5 emissions of scenarios in each of the 22 segments of the corridor. Scenario 6 shows an improvement of a 68% with respect to the current situation; still it is worse than any scenario with BRT. Even a BRT with diesel busses (Scenario 2) would result in a cleaner solution. To appreciate the differences among scenarios 2-5, Fig. 5 shows the expected reduction they provide, relative to Scenario 6.
Figure 4. Analysis of scenarios 2 to 6.
Figure 5. Comparison of the emission reduction for scenarios 2 to 5, relative to Scenario 6.
Comparing Car Fleet Reduction Scenarios
To evaluate scenarios with distinct degrees of acceptance of the new modality by the citizenship, we included in our analysis scenarios 7 and 8. In Fig. 6 we compare the emissions of scenarios 4, 7 and 8.
Figure 6. Comparison of the emission reduction for scenarios 2 to 5, relative to Scenario 6.
For each scenario we show a boxplot of the emissions per segment. As expected, Scenario 7, which models the case when no car users would change modality, is the worst one in terms of emissions, while Scenario 8 is the best.
Conclusions
When major changes to a city transportation system are planned, reliable predictions of their impact on a variety of urban life indicators ought to be produced. Well-designed public transportation systems can play a relevant role in alleviating both traffic and air pollution issues in large cities. However, estimating the effects their implementation has on the total pollutant emissions is not an easy task.
In this work, we proposed a discrete-event simulation approach that can model the mobility of vehicles along a traffic network, to generate information about their time-dependent position. By integrating the simulation output with an estimation of each vehicle emission factor, our approach allows obtaining a prediction for the total emissions along the traffic network.
We applied our proposed method to evaluate the effects of the implementation of a BRT system in the Carrera Séptima in Bogotá, Colombia. According to the Mayor’s office, this change will generate an improvement in the air quality of the city, due to the introduction of environment friendly buses. To test this hypothesis we compared by our models the predictions for PM2.5 emissions before and after implementing the BRT. A significant amount of data coming from diverse sources was assimilated to properly parametrize our models, which could be verified and validated.
[image:6.595.189.408.307.450.2]considered BRT implementation options considered in the project would result in a relevant reduction (up to 76%) of the emissions along the traffic corridor. Also, we considered a scenario were the BRT would not be introduced but the current bus fleet would be changed for a cleaner one, fueled by VNG, and estimated that this cheaper intervention could anyway reduce emissions up to 68%.
The modeling approach we proposed in this paper is easily modifiable, so it is possible to evaluate the impact of a particular or several variables in the output values. Different network topology and vehicle park compositions can be easily accounted for. Our method is general enough to be easily applied to the study of the emissions along other traffic networks.
References
[1] J. Banks. Discrete-event system simulation, Prentice Hall, 5th ed., 2010.
[2] R. Morales Betancourt, B. Galvis, J.M. Rincón-Riveros et. al. Personal exposure to air pollutants in a bus rapid transit system: Impact of fleet age and emission standard. Atmospheric Environment, 202:117–127, 2019.
[3] B. Brunekreef and S.T. Holgate. Air pollution and health. The Lancet, 360(9341):1233–1242, 2002.
[4] N.P. Cheremisinoff. Waste: A Handbook for Management, Prentice Hall, 2011.
[5] J.F. Franco, J.F. Segura, and I. Mura. Air pollution alongside bike-paths in Bogotá–Colombia. Frontiers in Environmental Science, 4:77, 2016.
[6] D. Pegden and D. Sturrock. Introduction to SIMIO. In Proceedings 2010 Winter Simulation Conference, pages 1–10, edited by B. Johansson et al., Piscataway, New Jersey: IEEE, 2010.
[7] Infométrika Secretaría de Movilidad Alcaldía Mayor de Bogotá TPD Ingeniería, Consorcio Transconsult. Cartilla movilidad 2016. Mobility Secretariat, Bogotá, 2016.