170
Chapter 24
Design of Boiler Controller with LAN Based Data Logger
Andi Adriansyah1,a, Taufik Ridwan2,b
1
Department of Electrical Engineering, Faculty of Engineering, Universitas Mercu Buana
2
School of Post Graduate, Universitas Mercu Buana Jl. Raya Meruya Selatan, Kembangan, Jakarta 11650, Indonesia
a
[email protected],[email protected]
Abstract. Steam generation systems are a crucial part of most any industrial systems. Therefore, boiler control is
an important problem. It is required to keep the boiler operating well for large changes in the operating conditions. The focus of this research is to design a system for monitoring, controlling and data storage operation of an industrial boiler, especially at the critical parameters that could potentially cause an accident. Based on several results it can be said that the boiler works in accordance with the stages of its operations. The system is able to monitor and control from a remote computer via a LAN as a medium of communication. Data of operational activity stored in the data base of the computer or external memory data logger with web CSV format.
Keywords: Burner System, Boiler Controller, Data Logger.
I. Introduction
Acquiring multiple data, the data may be analog or discrete in nature from the field or process at high speed using multi-channel data acquisition system, processing the data with the help of a data processing algorithm and a computing device and displaying the data for the user is the elementary need of any industrial system [1]. After acquiring data from the field, the signal conditioning and processing operations are performed. After the signal conditioning operation, signal is given to a signal processing algorithm which processes the signal and stores the data in a memory unit.
Steam generation systems are a crucial part of most any industrial systems. Therefore, boiler control is an important
problem
that are frequently changing load or subject to sudden load disturbances, which are common in industrial process. In such circumstances it is required to keep the boiler operating well for large changes in the operating conditions. One way to achieve this is to incorporate more process knowledge into the control system that able to be monitored, controlled and analyzed the process in every particularly time [2]-[3].Therefore, various researches have been done to improve boiler control system by introducing data acquisition and logger system [3]-[4]. With the advantage of technology personal computers are used for data acquisition, test and measurement and automation, such as PLCs and SCADA [5]-[9]. Many of the networking technologies have also been progressively integrated by newly introduced connectivity solutions (Ethernet or Wireless LAN) [10]-[12]. Obviously, as an example, today it is possible to use a common personal computer in order to implement even complex remote supervisory tasks of simple as well as highly sophisticated industrial plants [12].
171
The research will use a boiler that produce 20 tons/hour of steam and working with 24.5 bars. The boiler used two-burner unit with either fueled by gas or diesel. There are several parameter of boiler operations that be incorporated into design of data logger.
II. Boiler System and Data Logger
A. Boiler System
Steam boiler is a device used to convert water to steam at a required pressure and temperature by applying heat. Fuel is burnt in the boiler furnace to generate the heat. The boiler fuel can be coal or furnace oil. Boilers are available in two basic designs: fire tube and water tube as depicted in Fig. 1. Boilers should produce steam at high pressure and temperature to meet maximum work efficiency. These conditions are achievable only with water tube boilers.
A water tube boiler is a type of boiler in which water circulates in tubes heated externally by the fire. Fuel is burned inside the furnace, creating hot gas which heats water in the steam-generating tubes. The heated water then rises into the steam drum. Here, saturated steam is drawn off the top of the drum. Superheated steam is used to drive turbines. Since water droplets can severely damage turbine blades, steam is superheated to 730°F (388°C) or higher to ensure that there is no water content in the steam. A significant advantage of the water tube boiler is that there is less chance of a catastrophic failure: there is not a large volume of water in the boiler nor are there large mechanical elements subject to failure.
There are different kinds of losses in boilers. Loss in efficiency is reported mainly because of incomplete combustion of carbon, unburned fuels, moisture content in fuel and external radiation. Boiler is a high pressure device which is required to be operated with safe permissible limits. Safe handling of boiler is foremost important otherwise the boiler gets damaged and can get burst. Bursting of boiler can extensively damage property and man power.
(a)
[image:2.595.225.381.446.746.2](b)
172
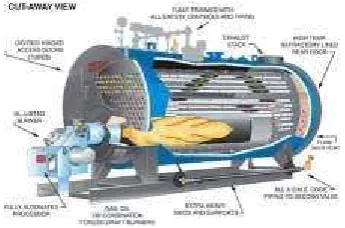
[image:3.595.218.391.154.268.2]Burner is part of the main supporters of the boiler that serves to boil water. The operation of the burner determines combustion products, system security and efficiency of the overall system. A burner system control unit comprises: burner control unit, flame sensor, servo motor, solenoid valve, magnetic coil coupling oil pump, power, electro motor blower, gas pressure switch, air pressure switch, oil return pressure switch. A cut- away view of burner unit is depicted in Fig. 2.
Fig. 2. Burner Unit.
B. Data Logger
Most measurements begin with a transducer, a device that converts a measurable physical quantity, such as temperature, strain, or acceleration, to an equivalent electrical signal. Transducers are available for a wide range of measurements, and come in a variety of shapes, sizes, and specifications.
Sensor is used to sense the physical parameters from the physical world. The output of the sensor is provided to the signal conditioning element. The main purpose of signal conditioning element is to remove the noise of the signal, amplify the signal. The output of the signal conditioning system is provided to ADC that converts the analog signal to the equivalent digital data. The equivalent digital data is then fed to the computer, which acts both as a controller and display element.
Once data has been acquired, there is a need to store it for current and future reference. Today, alternative methods of data storage embrace both digital computer memory and that old traditional standby-paper. There are two principal areas where recorders or data loggers are used. Recorders and data loggers are used in measurements of process variables such as temperature, pressure, flow, pH, humidity; and also used for scientific and engineering applications such as high-speed testing (e.g., stress/strain), statistical analyses, and other laboratory or off-line uses where a graphic or digital record of selected variables is desired. Digital computer systems have the ability to provide useful trend curves on CRT displays that could be analyzed.
173
Fig. 3. Data Logger Process.
III. System Design
A. Burner Operation Design
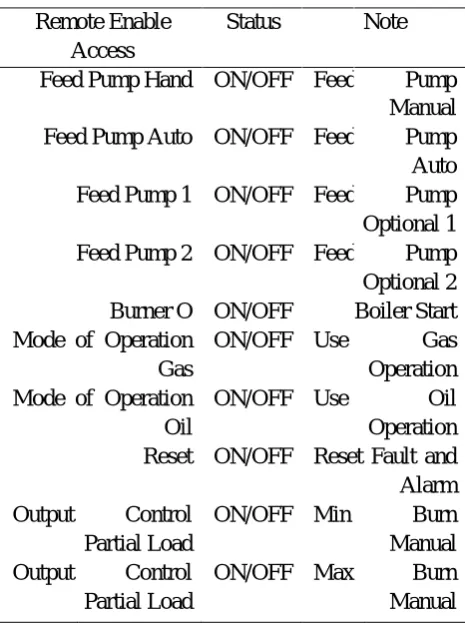
The research used boiler that produce 20 tons/hour of steam and working with 24.5 bars. The boiler used two-burner unit with either fueled by gas or diesel. There are ten parts of boiler operations that be incorporated into design of data logger. These parts are designed to be accessed remotely using digital input. The parts are listed in Table I.
TABLE I
REMOTEACCESSENABLEBURNERPARTS
Remote Enable Access
Status Note
Feed Pump Hand ON/OFF Feed Pump Manual Feed Pump Auto ON/OFF Feed Pump Auto Feed Pump 1 ON/OFF Feed Pump Optional 1 Feed Pump 2 ON/OFF Feed Pump Optional 2 Burner O ON/OFF Boiler Start Mode of Operation ON/OFF Use Gas Gas Operation Mode of Operation ON/OFF Use Oil Oil Operation Reset ON/OFF Reset Fault and Alarm Output Control ON/OFF Min Burn Partial Load Manual Output Control ON/OFF Max Burn Partial Load Manual
174
TABLE II
STATUSACTIVITYMONITORING OFBOILER(DIGITAL INPUT) Boiler Monitor Status Activity Note
Feed Pump Operation ON/OFF Feed Pump Operating Full Load ON/OFF Burning Max Over Pressure ON/OFF 1stOver Pressure Trouble Burner 1 ON/OFF Trouble in Burner 1 Trouble Burner 2
Final Pressure
ON/OFF ON/OFF
Trouble in Burner 2 2ndOver Pressure Gas Pressure 1 ON/OFF Low Pressure in 1 Gas Pressure 2 ON/OFF Low Pressure in 2 Pre Warning ON/OFF Level Pre Warning High/Low Water ON/OFF Water Level Oil Operation Burner 1 ON/OFF Burner 1 with Oil Gas Operation Burner 1 ON/OFF Burner 1 with Gas Burner Operation ON/OFF Burner Operating Oil Operation Burner 2 ON/OFF Burner 2 with Oil Gas Operation Burner 2 ON/OFF Burner 2 with Gas Remote Enable ON/OFF Operating in Remote
TABLE III
STATUSACTIVITYMONITORING OFBOILER(DIGITAL INPUT) Boiler Monitor Status Parameter
Input
Note
Current 0-200 Ampere Current for panel Gas Pressure Burner 1 0-100 mbar Gas Pressure Burner 1 Oil Pressure Burner 1 0-25 bar Oil Pressure Burner 1 Gas Pressure Burner 2 0-1000 mbar Gas Pressure Burner 2 Oil Pressure Burner 2 0-25 bar Oil Pressure Burner 2 Water Level 0-100% Level in Boiler Tube Pressure Steam
Flue Temperature
0-40 bar 0-300oC
Pressure Steam Temperature in flue Burner Operation 1 0-100% Value of burning Burner Operation 2 0-100% Value of burning
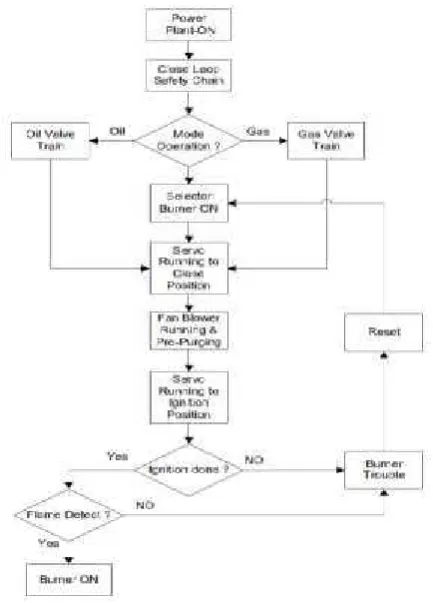
Boiler system will operate after power system is available and protection systems are in safe limits. There are two options for operating boiler system, oil or gas fueled. Normal process of boiler system is depicted in Fig. 4.
175
Monitor Status
TABLE IV BOILERRESPONS
Parameter Note Respons
Water Level 40% Low water Alarm down 45% Pre Warning Alarm operate 60% Start Feed Pump Normal boiler 80% Stop Feed Pump Normal boiler 85% High Water Boiler operate Pressure
Steam
17.5 bar Normal Pressure Boiler operate
>17.5 bar High Pressure Burning down <17.5 b Low Pressure Burning up 18 bar Over Pressure Shut down Flue
Temperature
> 290 oC High Temperature
Boiler operate
[image:6.595.196.413.364.666.2]< 290 oC Low Temperature Normal boiler
Fig. 4. Flow Chart of Normal Boiler System Process.
B. Configuration System Design
176
[image:7.595.181.430.101.260.2]Hardware configuration design is based on some PCs that interconnected with a LAN corporate via Ethernet cable UTP CAT5 to make special network. Some sensors and a PLC connected to the network to acquire data and control the process. Fig. 5 displayed hardware configuration.
Fig. 5. Hardware Configuration.
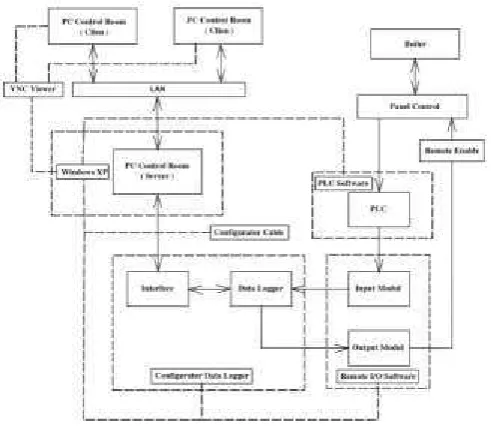
Some PCs with Windows XP operating system used in software configuration. Several software applications, such as: PC configurator cable, configuration software web data logger, remote I/O configurator, PLC software programmer and VNC viewer. The software applications used to make sure the process able to be monitored and controller suitably. Software configuration is depicted in Fig. 6.
Fig. 6. Software Configuration.
[image:7.595.182.428.406.619.2]177
Fig. 7. Network Configuration.
IV. Results and Discussions
A. Operational Status Monitoring
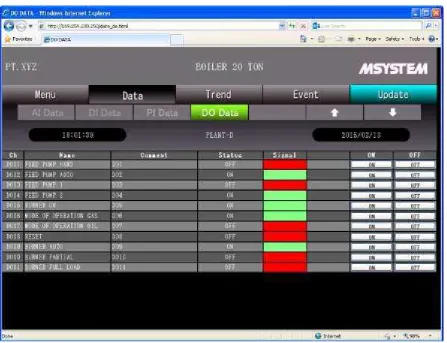
All of configuration design has been done. Some display of front panel boiler controller will be described. Fig. 8 shows overview of monitor display that describes overall process that can be controlled remotely as digital output. In Data Menu, there are Analog Input Data (AI Data), Digital Input Data (DI Data), Pulse Input Data (PI Data) and Digital Output Data (DO Data). It shows that status ON or OFF differentiates by color in column. Remote access control is done by clicking selector switch in monitor display. The remote access control is indicated by ON or OFF status and different color column.
[image:8.595.82.530.386.729.2]However, Fig. 9 shows overview of monitor display that can be monitored remotely as digital input. It shows some parameter values and several statuses as ON or OFF and differentiates by color in column.
178
Fig. 9. Overview of PC Display for Remote Access Control (Digital Input).
Overview of operational status of boiler activity is shown in Fig. 10 as table that display several input data parameters. The table presented actual value and unit of every parameter.
[image:9.595.105.507.450.756.2]179
B. Trend Display
[image:10.595.97.517.145.429.2]Trend is a display in the form of graphs based on time intervals or sampling rate that has been established to monitor all parameters, digital and analog inputs and operational status, as well. The parameters are recorded on the PC monitor so able to view operational status for earlier time. Fig. 11 and Fig. 12 showed four parameters of analog input and four operational statuses, respectively.
Fig. 11. Overview of Trend Display for Four Parameters (Analog Input).
[image:10.595.95.512.454.718.2]180
C. Network Analysis
[image:11.595.180.429.145.333.2]In order to test performance of network it is used Wireshark software application. Wireshark used as network protocol analyzer. Fig. 13 displayed capture protocol results via LAN communication.
Fig. 13 shows two-way active communication on LAN network between two module using TCP protocol. The Fig. shows data logger IP at 169.254.230.250 and Ethernet interface module IP at 169.254.230.251.
Fig. 13. Overview Captures Result of Network Protocol.
D. Data Storage
[image:11.595.142.467.486.663.2]As described in designing process that operational activity and data will be stored via web data logger in data base or external memory. The data will be store if CSV format. Data storage is done in order to analyze if there are any errors, faults or disturbances in process. Fig. 14 shows several data that have been stored in CSV format by certain setup time interval.
181
V. Conclusion
The focus of this research is to design a system for monitoring, controlling and data storage operation of an industrial boiler, especially at the critical parameters that could potentially cause an accident. Based on several results it can be said that the boiler works in accordance with the stages of its operations. The system is able to monitor and control from a remote computer via a LAN as a medium of communication. It is evidenced by the interaction of IP addresses between web data logger and Ethernet interface module with TCP as the protocol is using software Wireshark. Operational activity data stored in the data base of the computer or external memory data logger with web CSV format that can be read multiple formats text-editor.
PLC technology as the main control system control is now commonly used because of its flexibility that can adapt to other devices including web data logger which is one of the methods for monitoring and control of a machine or system that utilizes corporate Ethernet network. Limitations when using these networks were related to corporate policy that restricts access to the network exit, so the system does not work optimally. Another limitation of this system is visually less attractive compared with the SCADA system, because it only displays the data tables and graphs are only understood by those involved.
References
[1]. Deepthi, K., & Prasad, A. M., “Wireless Data logging and Supervisory Control of Process Using LabVIEW”,Journal of Electronics and Communication Engineering, 2012, Vol. 1, No. 2, pp. 15-19.
[2]. Shankar, Gowri, K., “Control of Boiler Operation using PLC – SCADA”, Proceedings of the International Multi Conference of Engineers and Computer Scientists, 2008, Vol. 2, pp. 19-21.
[3]. Atabani, A. E. Energy Economical and Environmental Analysis of Industrial Boiler. Academic Publishing doctoral dissertation, University of Malaya, Malaysia, 2012.
[4]. Agrawal, Roopal. Internet Based Data Logging and Supervisory Control of Boiler Drum Level Using
LabVIEW. Master Thesis, Department of Electronics & Communication Engineering National Institute of
Technology, Rourkela Odisha, India, 2012.
[5]. Jack, Hugh. Automating Manufacturing Systems with PLCs Version 5.1. Boston: Free Software Foundation, Inc., 2008.
[6]. Beecher, Henry Ward. Introduction to PLC Programming and Implementation—from relay logic to PLC logic. Marietta, Georgia: Industrial Text and Video Company, 1999.
[7]. Alihussein, A. M. A Supervisory Control and Data Acquisition (SCADA) for Water Distribution System
of Gaza City, Master Thesis, The Islamic University of Gaza, 2010.
[8]. Bhaiswar, Roshan., & Kshirasagar, P., “Optimization of Energy for Industrial Heater Using PLC and SCADA”,International Journal of Computer Technology and Electronics Engineering, 2008, Vol. 2, No.
1, pp. 200-204.
[9]. Boyer, Stuart A. SCADA: Supervisory Control and Data Acquisition 3rd Edition. United State of America: ISA–The Instrumentation, Systems and Automation Society, 2004.
[10]. Kumar, S. R., & Rameshkumar, S., “Industrial Temperature Monitoring and Control System through Ethernet LAN”, International Journal Of Engineering And Computer Science, 2013, Vol. 2 no. 6, pp.
1988-1991.
[11]. Wong, K. Daniel. Wireless Internet Telecommunication. Boston, London: Artech House, 2005.
[12]. Poman, A, Gundras, Mahesh., & Pujari, Prashant, “GSM Based LAN Monitoring System”, International Journal of Computer Science and Information Technologies, 2012, Vol. 3, No. 3, pp.