Robotic Dexterity Assessment
Framework
Mark W. Culleton
Department of Mechanical & Manufacturing Engineering
Parsons Building
Trinity College Dublin
The University of Dublin
Dublin 2
Ireland
July 2017
A thesis submitted to the University of Dublin in partial
fulfilment of the requirements for the degree of:
I declare that this thesis has not been submitted as an exercise for a degree at this
or any other university and it is entirely my own work.
I agree to deposit this thesis in the University’s open access institutional repository
or allow the library to do so on my behalf, subject to Irish Copyright Legislation
and Trinity College Library conditions of use and acknowledgement.
The importance of flexible manufacturing processes and small-scale assembly is
growing due to the increased pace of globalisation and greater consumer demands
for product customisation. To address this trend, there has been increased interest
in collaborative industrial robots that are better suited to work alongside humans
in this changing environment. However, adoption of these robots within flexible
manufacturing processes has been relatively slow, which can be, as demonstrated in
this thesis, attributed to the current uncertainty around robotic dexterity. Dexterity
is a key requirement if collaborative industrial robotics is to be useful within flexible
manufacturing processes. However, an effective method for defining and measuring
robotic dexterity is currently lacking, which has made it difficult for robotic integrators
to introduce collaborative robots in these processes due to challenges in mapping
their performance to the task assembly requirements.
The core hypothesis that underlies this work is that the adoption of industrial robots
within flexible manufacturing processes can be facilitated by the development of a
framework which comprehensively assesses robotic dexterity. This framework should
consider the range of dexterous requirements within flexible manufacturing processes,
and compliment current manufacturing assessment methods in order to maximise its
scope and ease-of-use within the area.
To develop such a framework, this work explores and defines robotic dexterity within
flexible manufacturing by abstracting influences from both the human and robotic
dexterity literature. The demand for robotic dexterity is found to stem from the
sur-rounding environment, and the classification tables within the Boothroyd-Dewhurst
(B-D) design-for-assembly method are shown to comprehensively represent the range
can be captured by considering the robotic system’s ability to perform the operations
identified within the B-D classification tables.
From this consideration of dexterity, the B-D tables are used to compose a robotic
dexterity assessment framework that measures a robotic systems dexterity and
determines its potential within flexible manufacturing operations. The framework
develops robotic performance metrics which supersede supplier specifications and
provide a greater insight into the dexterous ability of industrial robot systems.
These metrics consider the dexterous requirements identified by the B-D tables, and
their links to these tables simplify robotic integration within flexible manufacturing
processes.
The capability of the developed framework is demonstrated using three scenarios
commonly encountered within small-scale assembly. For each scenario, the framework
provides a structured approach for analysing the scenario and evaluating robotic
systems. An initial set of performance metrics is used to estimate the performance of
different robotic systems, and physical testing is performed to validate the estimated
results. In all scenarios, the developed framework provides an accurate estimate of
the robot system’s probability of success (PS) and task completion time (CT), which
combine to characterise the dexterity of the robot system. These values are compared
to normative data from B-D tables to determine the viability of each robotic system
relative to human operators. Use of the framework demonstrates that a human
operator is the most suitable choice in the majority of the considered scenarios, which
supports the current dominance of manual labour within flexible manufacturing
processes. Furthermore, the framework permits direct robotic system comparisons
and helps to quantify the current gap between human and robot dexterity, which is
an invaluable tool for robotic integrators and highlights the framework’s potential
Firstly, I would like to express my sincerest thanks to my advisor Prof. Kevin
Kelly for his continual support over the duration of my Ph.D. and related research.
His patience, motivation, knowledge and guidance have helped me throughout my
research and writing of this thesis. I could not have imagined having a better advisor
and mentor.
A special thanks must be given to Elena Messina for the amazing opportunity to visit
the National Institute of Standards and Technology (NIST) as a guest researcher
during my research. I really appreciate the invitation and the organising that was
required in order to make the visit happen. During my time at NIST, I worked within
the Intelligent Systems Division and got to meet some amazing people. They made
my time at NIST very enjoyable, and I thank them for the memories and lasting
friendships. In particular I would like to extend my thanks to Joe Falco, Jeremy
Marvel, Karl Van Wyk, and Rick Norcross. Without their stimulating discussions
and continual support I would not have been able to conduct the research presented
within this thesis.
In addition to visiting NIST, I also had the privilege of spending some time at Queen’s
University Belfast (QUB) under the guidance of Dr. Yan Jin. This collaboration
opened up possibilities that were not possible within my home university, so I am
truly grateful for the opportunity. During my time at QUB, Dr. Jin always made
himself available to me and provided me with support when needed, so I extend him
my sincerest gratitude.
Within my department, I would like to thank Prof. John Monaghan, Dr. Rocco
Lupoi, Dr. Garret O’Donnell, Dr. Gareth Bennett, and Mr. Paul Normoyle for
Conor McGinn for his dedicated support and tutelage throughout my research. His
interest and work in robotics has helped to establish a robotics research group within
the department, and I am truly appreciative of everything that he has done.
I have had the opportunity to work alongside a number of talented researchers during
my Ph.D. and related research, and I would like to thank them for their continued
friendship and input. In this regard, a special acknowledgement is given to Michael
Cullinan, Aran Sena, Mark O’Regan Murphy, and Dr. Eoin Parle.
Outside of academia, I must also express my sincerest thanks to my housemates
Jonathan Moran and Karen Mulligan. Their friendship and understanding throughout
my research and write-up was invaluable, and I hope I can return the favour as they
complete their own postgraduate degrees.
Last but by no means least, I would like to thank my family; my parents Martin and
Eileen, my brothers Shane and Darragh, and my sister Helena for their endless love
and kindness. In particular, I am forever indebted to my parents for their unfaltering
belief and support throughout my life and these challenging few years. They have
shaped me into the person I am today, which is why I would like to dedicate this
Declaration i
Abstract iii
Acknowledgements v
List of Figures ix
List of Tables xi
Nomenclature xiii
1 Introduction 1
1.1 Motivation and Challenges . . . 1
1.2 Research Objectives . . . 3
1.3 Contribution of Thesis . . . 4
2 Background and Literature Review 7 2.1 Preliminary Note . . . 7
2.2 Manufacturing Overview . . . 8
2.2.1 Manufacturing Sector . . . 8
2.2.2 Manufacturing within Ireland . . . 8
2.2.3 Manufacturing Processes . . . 11
2.2.4 Manufacturing Systems . . . 12
2.2.4.1 Manual Labour . . . 12
2.2.4.2 Fixed Automation . . . 12
2.2.4.3 Programmable Automation . . . 13
2.2.4.4 Flexible Automation . . . 14
2.2.5 Flexible Manufacturing . . . 15
2.3 Design for Assembly . . . 19
2.3.1 Methods-Time Measurement System . . . 20
2.3.2 Boothroyd-Dewhurst DFA Method . . . 21
2.4 Robotics Overview . . . 27
2.4.1 Brief History of Robotics . . . 27
2.4.2 Industrial Robots . . . 29
2.4.3 Collaborative Robots . . . 32
2.4.4 Robotics Research . . . 33
2.4.4.1 Safety . . . 33
2.4.4.2 Throughput . . . 36
2.4.4.3 Dexterity . . . 38
2.5 Dexterity . . . 39
2.5.1 Human Dexterity . . . 39
2.5.1.1 Overview & Definitions . . . 39
2.5.1.2 Contributing Factors . . . 39
2.5.1.3 Assessments . . . 40
2.5.2 Robot Dexterity . . . 43
2.5.2.1 Overview & Definitions . . . 43
2.5.2.2 Contributing Factors . . . 44
2.5.2.3 Assessments . . . 44
2.6 Statistical Data & Tests . . . 48
2.6.1 Data Types . . . 48
2.6.2 Continuous Data Analysis . . . 49
2.6.2.1 Kolmogorov-Smirnov Test . . . 49
2.6.2.2 Detectable Difference . . . 50
2.6.3 Categorical Data Analysis . . . 52
2.6.3.1 Kolmogorov-Conover Test . . . 52
2.6.3.2 Probability of Success . . . 52
2.7 Summary . . . 54
2.7.1 Key Findings . . . 54
3 Research Framework 57
3.1 Research Methodology . . . 57
3.2 Suitability of the B-D Method . . . 59
3.2.1 HDAT Comparison . . . 60
3.2.2 YCB Object Dataset Comparison . . . 66
3.2.3 Comparison Outcome . . . 68
3.3 Framework Proposal . . . 69
3.3.1 Robotic Dexterity - Updated Definition . . . 69
3.3.2 Framework Scope . . . 70
3.4 Framework Implementation . . . 70
3.4.1 Activity 1: Dexterous Requirements . . . 72
3.4.2 Activity 2: Robotic Performance Metrics . . . 73
3.4.2.1 Component-Level Metrics . . . 73
3.4.2.2 System-Level Metrics . . . 75
3.4.3 Activity 3: Dexterity Matching . . . 76
3.4.3.1 System Feasibility . . . 76
3.4.3.2 System Capability . . . 76
3.4.3.3 Operation - Performance Matching . . . 77
3.5 Performance Data Analysis . . . 78
4 Experimental Design and Methodology 81 4.1 Testing Overview . . . 81
4.2 Robotic Systems . . . 82
4.2.1 Robotic Manipulators . . . 82
4.2.1.1 Universal Robotics UR10 & UR5 . . . 83
4.2.1.2 KUKA LWR4 . . . 83
4.2.1.3 Rethink Robotics Baxter . . . 83
4.2.2 Robotic End Effectors . . . 84
4.2.2.1 Schunk KGG 80-30 . . . 84
4.2.2.2 Robotiq 3-Fingered Gripper . . . 84
4.2.2.3 Allegro Robotic Hand . . . 85
4.2.3.1 Teach Programming . . . 86
4.2.3.2 Simulated Vision Detection . . . 86
4.2.3.3 Cognex Vision System . . . 87
4.2.3.4 Robot Registration . . . 91
4.2.3.5 Cognex + Registration . . . 92
4.3 Performance Metrics . . . 93
4.3.1 Grasp Region . . . 93
4.3.2 Grasp Cycle Time . . . 94
4.3.3 Trajectory Completion Time . . . 96
4.3.4 Communication Delay . . . 100
4.3.5 Insertion Search Time . . . 103
4.3.5.1 Search Region . . . 103
4.3.5.2 Spiral Search Routine . . . 104
4.3.5.3 Random Search Routine . . . 105
4.3.5.4 Quasi-Random Search Routine . . . 105
4.3.5.5 System Performance . . . 105
4.4 Handling Scenario . . . 109
4.4.1 Setup & Testing Overview . . . 109
4.4.2 Robotic Systems . . . 110
4.5 Pick-and-Place Scenario . . . 112
4.5.1 Setup & Testing Overview . . . 112
4.5.2 Robotic Systems . . . 113
4.6 Insertion Scenario . . . 114
4.6.1 Setup & Testing Overview . . . 114
4.6.2 Robotic Systems . . . 115
5 Computational and Experimental Results 119 5.1 Results Overview . . . 119
5.2 Handling Scenario . . . 120
5.2.1 Computational Results . . . 121
5.2.1.1 Estimated Probability of Success . . . 121
5.2.2 Experimental Results . . . 126
5.2.2.1 Recorded Probability of Success . . . 126
5.2.2.2 Recorded Completion Time . . . 127
5.2.2.3 Experimental Summary . . . 133
5.2.3 Handling Scenario Discussion . . . 134
5.2.3.1 Computational vs. Experimental Results . . . 134
5.2.3.2 Boothroyd-Dewhurst Comparison . . . 136
5.3 Pick-and-Place Scenario . . . 138
5.3.1 Computational Results . . . 138
5.3.1.1 Estimated Probability of Success . . . 138
5.3.1.2 Estimated Completion Time . . . 140
5.3.2 Experimental Results . . . 140
5.3.2.1 Recorded Initialisation Time . . . 141
5.3.2.2 Recorded Probability of Success . . . 144
5.3.2.3 Recorded Completion Time . . . 146
5.3.2.4 Experimental Summary . . . 148
5.3.3 Pick-and-Place Scenario Discussion . . . 149
5.3.3.1 Computational vs. Experimental Results . . . 149
5.3.3.2 Boothroyd - Dewhurst Comparison . . . 151
5.4 Insertion Scenario . . . 153
5.4.1 Computational Results . . . 153
5.4.1.1 Estimated Probability of Success . . . 153
5.4.1.2 Estimated Completion Time . . . 154
5.4.2 Experimental Results - Search Strategy . . . 158
5.4.2.1 Recorded Probability of Success . . . 158
5.4.2.2 Recorded Completion Time . . . 159
5.4.2.3 Experimental Summary . . . 163
5.4.3 Experimental Results - Initialisation Approach . . . 165
5.4.3.1 Recorded Initialisation Time . . . 165
5.4.3.2 Recorded Probability of Success . . . 166
5.4.3.4 Experimental Summary . . . 170
5.4.4 Insertion Scenario Discussion . . . 171
5.4.4.1 Computational vs. Experimental Results . . . 171
5.4.4.2 Boothroyd - Dewhurst Comparison . . . 173
6 Conclusions and Future Work 175 6.1 Dexterity within Manufacturing . . . 175
6.2 Developed Assessment Framework . . . 176
6.3 Computational vs Experimental Results . . . 176
6.3.1 Handling Scenario . . . 177
6.3.2 Pick-and-Place Scenario . . . 178
6.3.3 Peg Insertion Scenario . . . 179
6.4 Concluding Remarks . . . 181
6.5 Recommendations for Future Work . . . 182
Bibliography 185 A MTM-1 Basic Movement Tables 201 A.1 Reach . . . 201
A.2 Grasp . . . 203
A.3 Move . . . 204
A.4 Position . . . 206
A.5 Release . . . 207
B Sobol’ Sequence 209
2.1 Persons in employment by economic activity (% of total employment).
Data taken from [5], [6]. . . 8
2.2 Breakdown of the total Net Selling Value (NSV) of Ireland’s production
by sector in 2015 (data from [12]). . . 9
2.3 Distribution of enterprises and persons engaged within Ireland in 2014
(taken from [15]). . . 10
2.4 Example of cumulative cost (investment + labour + operating cost)
for different types of production, showing the high initial investment
required for automation and continual cost of manual labour. The
time it takes to recover the cost of the investment is known as the
payback period (PB) (generated with reference to [17]). . . 13
2.5 Example unit assembly cost for different types of production in relation
to annual production volume (generated with reference to [19]). The
highlighted zone shows the production volumes at which collaborative
robots become a financially viable option. . . 14
2.6 The hierarchy of production levels showing the relationship between
changeover ability, reconfigurability, flexibility, transformability, and
agility (adapted from [26]). . . 15
2.7 Assembly layouts defined by Boothroyd [29] (small to large scale): (a)
Bench layout, (b) multi-station layout, (c) modular assembly layout,
(d) custom assembly layout, (e) flexible assembly layout and (f) large
multi-station layout. Other assembly layouts not shown are the very
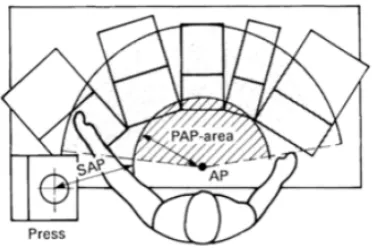
2.8 Bench assembly layout showing an operator’s PAP and SAP areas
based on the assembly position (AP). For assembly of relatively small
parts, the PAP area has a radius of 35 cm (taken from [30]). . . 18
2.9 Time requirement for a reach (Case B) movement in relation to
distance. Shown is the differentiation between PAP and SAP when
(a) handling relatively small parts, and (b) handling relatively large
parts (taken from [30]). . . 21
2.10 Extract from the Boothroyd-Dewhurst manual handling tables,
show-ing a number of factors which influence an operator’s completion
time during a one handed handling operation ( c 1999 Boothroyd Dewhurst, Inc.). . . 22
2.11 Alpha and beta rotational symmetries for various parts (taken from
[29]). . . 23
2.12 Extract from the Boothroyd-Dewhurst manual insertion tables,
show-ing a number of factors which influence an operator’s completion time
during the joining of parts ( c1999 Boothroyd Dewhurst, Inc.). . . . 24 2.13 A scene from Karel ˇCapek’s science fiction play R.U.R. showing three
robots. . . 28
2.14 ’UNIMATE’ - The first, fully automatic robot which was developed
by General Motors and deployed in 1961. . . 28
2.15 Types of industrial robot based on mechanical configuration (generated
with reference to [45], [47]). . . 30
2.16 Global estimated operational stock of industrial robots combined
with annual changes in U.S. manufacturing productivity, output, and
employment between 1987 and 2015 (data from [48], [49]). . . 31
2.17 The world market for industrial robots by manufacturing sector, robot
type, and robot function (data from [50], [51]). . . 32
2.18 The estimated increase in collaborative robot sales between 2015 and
2020 (source: ABI Research [57]). . . 33
2.19 NASA’s Robonaut 2 using hand tools (taken from [69]). . . 35
2.21 The high-speed hand-arm system used by the Ishikawa Watanabe
Laboratory (taken from [73]). . . 37
2.22 Interactive ‘singulation’ of an object from a pile (taken from [83]). . . 38
2.23 Comparison between two distributions,X1 = ¯x1±E1 andX2 = ¯x2±E2:
(a) The sample means ¯x1 and ¯x2 differ by at least a value of d for the
given confidence levelα (b) The sample means ¯x1 and ¯x2 cannot be
said to differ for the given confidence level. . . 51
3.1 Design science research methodology, adapted from [146]. . . 58
3.2 Handling operations required during the 14 HDAT as represented
on the B-D manual handling tables. Colour intensity represents the
performance frequency of each operation (range: 1 - 11). Those
operations not assessed by HDAT are left blank. . . 63
3.3 Insertion operations required during the 14 HDAT as represented
on the B-D manual insertion tables. Colour intensity represents the
performance frequency of each operation (range: 1 - 17). Those
operations not assessed by HDAT are left blank. . . 64
3.4 Number of operations within each B-D handling table that are
consid-ered by the 14 HDAT. . . 65
3.5 Number of one-handed B-D handling operations that are considered
by the 14 HDAT. . . 65
3.6 Number of operations within each B-D insertion table that are
consid-ered by the 14 HDAT. . . 65
3.7 Potential handling operations that can be assessed using the YCB
object dataset. Colour intensity represents the number of objects
which map to each operation (range: 1 - 21). Those operations which
cannot be assessed using objects from the YCB dataset are left blank. 67
3.8 Number of operations within each B-D handling table that can be
assessed using the YCB object dataset. . . 68
3.9 Number of one-handed B-D handling operations that can be assessed
3.10 Developed framework can be used to identify the robotic systems
suit-able for a given assembly process, or equally to identify the assembly
operations achievable by a given robotic system. . . 71
3.11 Framework incorporates three activities (labelled 1-3) to link robotic
systems to flexible manufacturing operations and simplify selection
within the area. . . 71
4.1 Allegro robotic hand with attached force-torque transducers. . . 85
4.2 Multi-fingered manipulation control architecture. . . 85
4.3 The probability distribution of a bivariate normal distribution with
zero correlation and mean, showing the one, two and three standard
deviation (σ) confidence regions. Taken from [160]. . . 86 4.4 Image captured by the GigE camera being processed by VisionPro
using the colour extractor tool and blob tool. In this instance the colour
extractor tool (a) searches for red within the defined region, and (b)
converts detected pixels white while setting remaining pixels to black,
while the blob tool (c) searches for light blobs on a dark background
within the defined region and (d) selects the most appropriate blob
based on shape and area. . . 89
4.5 Positioning of calibration checkerboard within the robot’s environment. 90
4.6 The VisionPro checkerboard tool detects the intersection points and
uses the board’s spacing distance, position, and orientation to
trans-form pixel coordinates to world (or robot) coordinates. . . 90
4.7 Translational error of the KUKA LWR4 (R1) and the UR10 (R2) as
a function of the target’s distance from the registration seats. Taken
from [166]. . . 91
4.8 Grasp region of the chosen robotic end effectors. . . 93
4.9 Selected frames from the opening and closing sequence of the Schunk
KGG 80-30 gripper, where each frame is equal to 1/30 s. . . 95
4.10 Selected frames from the opening and closing sequence of the Robotiq
4.11 Cycle time of the Robotiq 3-Fingered Gripper when performing a
pinch grasp. . . 95
4.12 Motion profile of the robotic manipulators when performing a linear
motion between points 1 and 2. Motion can be broken into stages,
which are defined by the programmed velocity (vprog), the constant
acceleration / deceleration (±a), and the stage time (t1,t2,t3). For
short trajectories, the trajectory velocity (vtraj) is the maximum
velocity achieved during the motion, which is less than vprog. . . 97
4.13 Comparison between the recorded completion times (discrete points)
and the estimated completion times (continuous functions) of the
KUKA LWR4 and UR robots in relation to trajectory distance. . . . 99
4.14 Cycle time of the Robotiq 3-Fingered Gripper performing a pinch
grasp when using the robot’s local controller and the programming
interface. The constant offset (0.2893s) is the communication delay between the programming interface and the robotic controller. . . 101
4.15 Comparison between the recorded completion times of the KUKA
LWR4 and UR robots in relation to trajectory distance when the
robot’s local controller and the programming interface. . . 101
4.16 Discretisation of a search region into a finite number of points at which
an insertion can occur. The spacing between these points is optimised
by setting the diagonal distance to equal the insertion clearance c. . . 104 4.17 Points generated by the two dimensional Sobol’ sequence within a 4
mm x 4 mm search region. . . 106
4.18 Search routines considered and an example of the first 20 robot
way-points used to generate the required path: (a) Spiral search where
turning distance equals the insertion clearance, c (waypoints don’t change between searches, turns enlarged for clarity) (b) Random
search (waypoints vary between searches) (c) Quasi-random search
4.19 Peg insertion search times of the KUKA LWR4 when using the spiral,
random and quasi-random search strategies. Graphs show the mean
search time and 95% confidence interval error bars for each 1 mm
increment. . . 108
4.20 Layout of the handling operation showing the proposed location of
a robotic system, which moves from its home position A to grasp
the disc at position B and place it in the bin at position C. The
coordinates are given inmm, and their values are taken from the real robot’s coordinate system. . . 109
4.21 Chosen primitive objects and their classification within the B-D
han-dling table based on their symmetry and size (given in mm). . . 109 4.22 Schunk KGG 80-30 pneumatic gripper dimensions for finger
configu-rations 1 & 2. . . 111
4.23 MRMT Displacement Test paper target variant. . . 113
4.24 Zones defined by the MRMT Displacement Test variant to quantify
placement accuracy. . . 113
4.25 Peg insertion operation setup and design specifications. . . 114
4.26 Cross section of the artefacts during an insertion by the LWR4 KGG
system; (a) initial misalignment of peg and hole (b) programmed
position not reached due to collision with surface, which generates a
contact force, F (c) maintaining this contact force, a search strategy is implemented until a successful insertion is achieved (detected when
the actual position equals the programmed position). . . 117
5.1 Actual testing of the handling scenario showing (a) the UR5 KGG1 C
system approaching the cylindrical block, and (b) the location of the
Cognex system within the environment. . . 120
5.2 Calculated grasp region of the robotic end effectors when handling
the disc. . . 121
5.3 Calculated reduced grasp region of the Schunk KGG 80-30 gripper
5.4 One-dimensional positional error±ex applied to the robot’s pick-up
location, which results in approach distances |AC| and |AD|. . . 129 5.5 Pick-and-place testing of (a) the UR10 RIQ system using the original
MRMT displacement test and (b) the UR10 AGO system using the
MRMT displacement test variant. . . 138
5.6 Additional testing using the MRMT and its variant to assess the
performance of the LWR4 AGO system. . . 141
5.7 The teaching of corner positions when using the UR10 robotic
manip-ulator takes less time during the MRMT displacement test variant
as it’s easier to determine when the robot is aligned with the printed
concentric circles. . . 143
5.8 Placement accuracy zones which can be defined for the original MRMT
displacement test based on the block’s position relative to the target
hole. . . 144
5.9 Ability of the Robotiq gripper to absorb errors when aligned parallel to
the direction of maximum error. As shown in (b), the cylindrical block
can be grasped off centre which means that errors in this direction
are negated during placement. . . 146
5.10 Comparison between the recorded placement zones of the UR10 RIQ
-CR during a single run when the Robotiq gripper is aligned (a) parallel
and (b) perpendicular to the direction of maximum error. . . 146
5.11 Actual testing of the insertion scenario using (a) the LWR4 RIQ
system and (b) the LWR4 KGG system. . . 153
5.12 Additional testing with the LWR4 AGO Sf system that used an active
force-controlled search strategy to locate the hole and complete a peg
insertion. . . 158
5.13 The surface condition of a peg after testing over a period with the
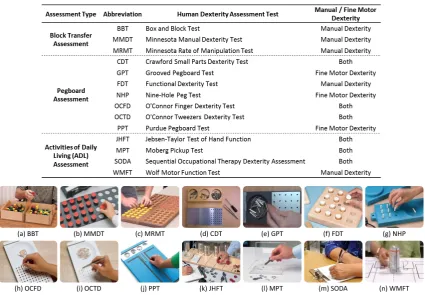
2.1 Breakdown of the 14 commercially available Human Dexterity
Assess-ment Tests (HDAT) based on their method for assessing dexterity.
Type of dexterity assessed taken from [89]. Images sourced online
from the public domain [96]–[102]. . . 41
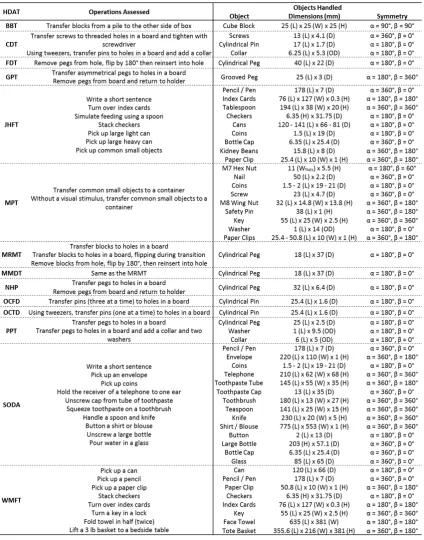
3.1 HDAT operations which require object interaction and their
corre-sponding objects. Item dimensions taken from HDAT documentation
where possible, but otherwise estimated using standard values.
Sym-metry parameters (α and β) defined in Section 2.3. . . 62 3.2 The B-D manual handling and insertion code(s) for each HDAT.
Codes calculated using the B-D classification tables and the items and
operations identified in Table 3.1. . . 65
3.3 Dependence of selected B-D handling and insertion operations on the
sixteen actions identified by NIST (with reference to Figures 3.2 and
3.3). . . 74
4.1 Supplier specifications for the robotic manipulators considered, taken
from [152]–[154] (* Repeatability not specified by supplier, but has
been recorded in [155]). . . 82
4.2 Supplier specifications for the robotic end effectors considered, taken
from [156]–[158]. . . 84
4.3 Supplier specifications for the Basler acA2000 GigE camera chosen
for testing. . . 88
4.4 Trueness of the Cognex vision system during detection of cylindrical
4.5 Robotic systems considered for the handling operation. . . 111
4.6 Robotic systems considered for the MRMT test. . . 113
4.7 Robotic systems considered for the peg insertion task. . . 115
5.1 Estimated probability of success (P S) for varying degrees of uncer-tainty in the selected handling operation. . . 122
5.2 Performance metrics of the UR5 KGG robotic system which relate to
the chosen handling scenario. . . 124
5.3 Estimated completion times of the different robotic systems for the
selected handling operation. . . 125
5.4 The recorded probability of success (P S) for each robotic system based on 60 handling iterations and a 0.95 confidence level. Due to the number of samples and the chosen confidence level, the maximum
P S that could be determined was 95.3%. . . 126 5.5 Calculated true mean value for each setup variation based on the
recorded completion times. . . 127
5.6 Comparison of the different robotic systems for each initialisation
approach. A positive detectable difference (in seconds) between the
system’s true mean completion times differ by at least that value.
Rejection (1) of the null hypothesis (H0) suggests that the data sets
do not belong to the same population at the 5% significance level. . . 130
5.7 Comparison of the different initialisation approaches for each robotic
system. A positive detectable difference (in seconds) between the
system’s true mean completion times differ by at least that value.
Rejection (1) of the null hypothesis (H0) suggests that the data sets
do not belong to the same population at the 5% significance level. . . 131
5.7 Comparison between the estimated and recorded performance of each
robotic system. To improve the clarity of the table, an average
5.8 Overall disparity between the estimated and recorded probability
of success values. A positive and negative value correspond to an
overestimation and underestimation by the developed framework. . . 135
5.9 Estimated probability of success (P S) for each of the robotic systems during the original MRMT Test and the MRMT test variant. . . 139
5.10 Estimated completion times of the different robotic systems for the
MRMT displacement test and its variant. . . 140
5.11 Robotic system performance during the MRMT displacement test.
Probability of success (P S) calculated for a 95% confidence level. . . 142 5.12 Robotic system performance during the MRMT displacement test
variant. Probability of success (P S) calculated for a 95% confidence level. . . 142
5.13 Comparison between the estimated and recorded P S and CT of each robotic system during the original MRMT and the MRMT variant. . 149
5.14 Estimated completion times of the different robotic systems during
performance of the peg insertion scenario. . . 157
5.15 Robotic system performance during the insertion scenario with
simu-lated perception error σ1 and σ2. Values calculated based on 60 test
iterations and for a 0.95 confidence level. . . 159 5.16 Comparison of the different search strategies when inserting the (a)
chamfered and (b) non-chamfered peg. A positive detectable difference
(in seconds) between the system’s true mean completion times differ by
at least that value. Rejection (1) of the null hypothesis (H0) suggests
that the data sets do not belong to the same population at the 5%
significance level. . . 161
5.17 Robotic system performance within the insertion scenario when using
different initialisation approaches. Values calculated based on 60 test
5.18 Comparison of the different initialisation approaches when inserting
the (a) chamfered and (b) non-chamfered peg. A positive detectable
difference (in seconds) between the system’s true mean completion
times differ by at least that value. Rejection (1) of the null hypothesis
(H0) suggests that the data sets do not belong to the same population
at the 5% significance level. . . 167
5.19 Comparison between the estimated and recordedCT of each robotic system for (a) the chamfered and (b) the non-chamfered peg insertion
scenario. . . 172
A.1 Normal time values for MTM-1 motion element ‘Reach’ [176]. . . 202
A.2 Normal time values for MTM-1 motion element ‘Grasp’ [176]. . . 203
A.3 Normal time values for MTM-1 motion element ‘Move’ [176]. . . 205
A.4 Normal time values for MTM-1 motion element ‘Position’ [176]. . . . 206
AGO Allegro Robotic Hand
BAX Baxter Robotic Manipulator
B−D Boothroyd-Dewhurst
C Cognex Initialisation Approach
CL Confidence Level
CR Cognex + Registration Initialisation Approach
CT Completion Time
DF A Design-For-Assembly
DOF Degrees Of Freedom
H0 Null Hypothesis
Ha Alternative Hypothesis
KGG Schunk KGG 80-30 Gripper
LW R4 KUKA LWR4 Robotic Manipulator
M RM T Minnesota Rate of Manipulation Test
M T M Methods-Time Measurement
N SV Net Selling Value
N IST National Institute of Standards and Technology
P AP Primary Assembly Process
P B Payback Period
P OV Program Override Value
P S Probability of Success
R Robot Registration Initialisation Approach
r Random Search Strategy
RCC Remote Centre Compliance
RIQ Robotiq 3-Fingered Gripper
s Spiral Search Strategy
SAP Secondary Assembly Process
SM Es Small and Medium Sized Enterprises
T Teach Programming Initialisation Approach
T CP Tool Centre Point
q Quasi-Random Search Strategy
V AC Baxter Vacuum Gripper
α Significance level
BIN CDF Binomial cumulative distribution function
dtraj Linear trajectory distance of robot arm
dthresh Threshold trajectory distance at which a robotic arm reaches vprog
Ea Efficiency of an assembly process
ex Positional error in the x-direction
invN orm Inverse of the cumulative normal distribution function
µ Population mean
s Sample standard deviation
σ Population standard deviation
Σ Population covariance matrix
vprog Programmed linear velocity of a robotic manipulator
vtraj Linear velocity achieved by a robotic manipulator during a trajectory
¯
x Sample mean
Agile
Manufactur-ing
Agile manufacturing is a manufacturing approach whereby a
company’s processes and structure are organised to enable a
swift response to changing consumer needs and markets.
Alternative
Hy-pothesis (Ha)
The alternative hypothesis is used within statistical tests and is
the opposing hypothesis to the null hypothesis. The alternative
hypothesis is usually taken to be that there is a significant
difference between the samples being considered due to a real
effect during testing. In general Ha is the hypothesis that a
statistical test is trying to prove.
Boothroyd-Dewhurst (B-D)
Method
The Boothroyd-Dewhurst (B-D) method is a design-for-assembly
(DFA) method used to optimise and assembly process within
manufacturing. The B-D method is the most commonly used
DFA method, and optimises an assembly by minimising the
Collaborative
Robot
Within industry, collaborative robots refer to robotic systems
that are able to share a workspace with humans. Since
col-laborative robots need to work alongside and/or with human
co-workers, collaborate robots are designed to be inherently safe
through mechanical design, smart control or a combination of
both. The majority of collaborative robots are low payload and
are easily programmable and transportable to facilitate their
use within flexible manufacturing.
Completion Time
(CT)
Robotic performance metric which corresponds to the time
re-quired by the robotic system to perform a given task successfully
and in full.
Confidence Level
(CL)
Within statistics, the confidence level is the probability that
the value of a parameter falls within a specified range of values
known as a confidence interval. While somewhat arbitrary, a
95% confidence level is commonly used within statistics and
industry, which implies that you can be 95% certain that the
corresponding confidence interval contains the true mean of a
population.
Confidence
Inter-val (CI)
See Confidence Level (CL).
Design-for-assembly (DFA)
Design-for-assembly (DFA) methods are used within industry
to optimize an assembly process. DFA methods reduce the
overall cost of an assembly process by minimising the number
of discrete operations, the number of parts, and the complexity
of the remaining operations.
Degrees of
free-dom (DOF)
The degrees of freedom (DOF) of a system are the number of
independent parameters that describe its configuration. The
degrees of freedom of a robot typically corresponds with the
number of actuated joints or controllable degrees of freedom it
possesses.
Flexible
Manufac-turing
Flexible manufacturing refers to manufacturing processes that
that incur changes at the macro level (e.g. in product volume
and mix) and/or the micro level (e.g. disturbances in product
geometry or material properties). Flexible manufacturing is
part of the agile manufacturing approach, but its scope limited
to the production of features, workpieces, and sub-products
within manufacturing stations, cells, and/or segments.
Foreign Direct
In-vestment (FDI)
Foreign direct investment (FDI) occurs when a corporation
invests in a foreign country by establishing a business operation
or acquiring business assets (such as ownership or controlling
interest in a local company).
Industrial
Devel-opment Agency
(IDA) Ireland
Industrial Development Agency (IDA) Ireland is a Irish
Govern-ment State Agency that focuses exclusively on the promotion
and generation of high-quality Foreign Direct Investment (FDI)
in Ireland.
Initialisation
Time
Robotic performance metric which corresponds to the time
re-quired to change a robotic system between one operation and
another. This metric does not consider the initial development
of the control program(s), but rather focuses on the time
re-quired to reprogram and/or teach the robotic system during
Kolmogorov-Conover (KC)
test
The Kolmogorov-Conover (KC) test is an extension of the KS
test, and is used to determine if two discontinuous data sets
belong to the same population.
Kolmogorov-Smirnov (KS)
two-sample test
The Kolmogorov-Smirnov (KS) test is a non-parametric
hypoth-esis test that is used to determine if two sets belong to the same
population by measuring the maximum difference between the
two cumulative distributions of the samples.
Margin of Error
(E)
Margin of error (or tolerable error) refers to the sampling error
present during testing and represents the maximum expected
difference between a sample estimated parameter and the true
population parameter. In statistics, the margin of error is
usually defined as half the width of the confidence interval.
Methods-Time
Measurement
(MTM)
Methods-Time Measurement (MTM) is a predetermined motion
time system that is used to identify the basic motions required
during a manual assembly and quantify their time based on the
motion’s nature and the conditions of the motion.
Minnesota Rate
of Manipulation
Test (MRMT)
The MRMT is a standardised human dexterity assessment
test used to analyse gross coordination and bilateral manual
dexterity. The test has five subtests which require the subject to
manipulate cylindrical blocks within and a perforated wooden
board.
Net Selling Value Net selling value (NSV) is the net amount (excluding VAT)
invoiced to customers during product sales. This value includes
amounts charged by enterprises to customers for transport of
Normal
Distribu-tion
A probability distribution that represents the distribution of a
data set. A normal (or Gaussian) distribution is bell-shaped,
where most values cluster around the mean and taper off
sym-metrically towards either extreme.
Null Hypothesis
(H0)
The null hypothesis is used within statistical tests and states
that samples being considered are from the same population.
Acceptance of the null hypothesis suggests that there is no
statistical difference between the samples, and any differences
can be attributed to random sampling error.
Payback Period
(PB)
Within industry, the payback period refers to the elapsed time
before the cost of an investment is recovered from the revenue
or free cash flow it generates.
Primary
As-sembly Process
(PAP)
A primary assembly process (PAP) is a process which directly
contributes to the formation of a product e.g. part mating,
energy costs and items of information.
Probability of
Suc-cess (P S)
A robotic metric that indicates the likelihood that the robotic
system will perform the task successfully. During testing, the
P S can be determined for a given confidence level (CL) based on the number of successes and the number of independent
trials.
Program Override
Value (POV)
The program override value (POV) limits the velocity of a
robotic arm during program execution, and is specified as a
Remove
Cen-tre Compliance
(RCC)
A remove centre compliance (RCC) is a mechanical device that
is included between a robotic manipulator’s wrist and tool to
provide the tool with rotational and translational compliance.
Robotic Dexterity Specific to flexible manufacturing, robotic dexterity refers to
the ability of a robotic system to perform and adapt to the
operations identified within the Boothroyd-Dewhurst
classifica-tion tables in adequate time and in the presence of uncertainty.
For each operation, the dexterity of a robotic system can be
captured by considering its probability of success, initialisation
time, and completion time. The probability of success identifies
if the robotic system is dexterous enough to perform the
opera-tion based on the uncertainty present, while the initialisaopera-tion
and completion times represent the robotic system’s level of
dexterity. This level of dexterity is relative, and can be
com-pared to the average human times tabulated within the B-D
tables.
Secondary
Assem-bly Process (SAP)
A secondary assembly process (SAP) is a process that is required
during an assembly but does not directly contribute to the
final product’s realisation e.g. material handling, transfers,
re-grasping, etc.
Small and
Medium Sized
En-terprises (SMEs)
Small and medium sized enterprises (SMEs) is a term which
incorporates companies categorized as micro (employs fewer
than 10 employees and whose annual turnover and/or annual
balance sheet total does not exceede2m), small (employs fewer
than 50 employees and whose annual turnover and/or annual
balance sheet total does not exceed e10m), and medium-sized
(employs fewer than 250 employees and whose annual turnover
Tool Centre Point
(TCP)
The tool centre point (TCP) is the location on the tool of a
robotic manipulator whose position and orientation define the
tools coordinate system. Robotic velocities and positioning is
typically defined in relation to the TCP.
Workspace The space within which a robotic system operates. This space
Introduction
1.1
Motivation and Challenges
Industrial robots are highly valued within industry due to their speed, repeatability,
and lift capabilities [1]. Similar to other automated machines, industrial robots
can operate continuously with high reliability and low cost. Consequently, these
robots can greatly increase the output and efficiency of a manufacturing process,
and their adoption within industry has allowed companies to stay competitive in an
increasingly challenging global market.
While having many advantages, industrial robots traditionally required significant
investment and dedicated assembly lines, which primarily made them suited for
large-scale, high-volume manufacturing. However, with a growing importance in
flexible manufacturing processes that can meet more stringent consumer demands [2],
there has been an increased interest in industrial robots which can operate within
this environment.
Low-payload, collaborate industrial robots have been introduced by robotic suppliers
to address this demand. Unlike traditional robots, collaborative robots prioritise a
different set of performance parameters which make them more suited to flexible
manufacturing processes. Safety is the key requirement, as it allows the robot to
work alongside human co-workers within a shared workspace. This opens robotics
up to smaller scale manufacturing, which is an area that has seen little robotic
integration to-date. Since the same benefits apply to collaborative robots, there is
expected to increase from US $95 million in 2015 to over US $1 billion [3] in 2020.
While a range of collaborative industrial robots are commercially available, their
adoption within flexible manufacturing has been relatively slow. A primary reason
for this is that the performance of collaborative robots within this area is unclear.
Current robotic performance metrics were developed for traditional robots, and are
consequently insufficient for determining the performance of robots within flexible
manufacturing environments. This has made it difficult for companies to identify
suitable robotic systems for a given task.
A key enabler of robotic integration within flexible manufacturing is robotic dexterity,
as this helps to determine the range of operations that the robotic system can
perform. However, robotic dexterity is difficult to comprehensively define and
measure, which has led to ambiguity within the area. Without accepted measures,
robotic dexterity is typically described qualitatively or using in-house (i.e. robot
manufacturer) measurements. Consequently, it is currently challenging to identify
and compare the dexterity of different robotic systems.
Motivated by these challenges, this work focuses on a framework for defining and
measuring robotic dexterity within flexible manufacturing. The development of a
dex-terity assessment framework presents many additional challenges, as the framework
needs to bridge the gap that currently exists between robotics research and industrial
use. The framework must be comprehensive enough to capture the full extent of
robotic dexterity, yet simple enough to be adopted by those within industry. In
particular, the framework should provide dexterity measurements that are meaningful
to those within industry and require minimal effort to use and/or understand.
An initial but important challenge for this framework is to clearly define dexterity
and its contributing factors. This helps to identify the key components that need
to be considered for a thorough yet concise assessment of dexterity. Based on these
components, the framework must develop robotic performance metrics that are better
suited for collaborative robots operating within flexible environments. These metrics
need to be easily measured across the range of industrial robotic systems available,
which requires the development of standardised test methods and artefacts. An
easily related to flexible manufacturing processes if the framework is to simplify the
robot selection process and facilitate the benchmarking of robotic systems.
1.2
Research Objectives
The overall objective of this work was to develop a dexterity assessment framework
for robotic systems within flexible manufacturing that is both comprehensive and
beneficial to those within industry. The core hypothesis that directed this objective
was that the development of a suitable dexterity framework can facilitate the increased
adoption of industrial robots within smaller scale manufacturing by establishing a
link between robotic performance and flexible manufacturing processes.
To meet this objective, this work aimed to design and develop a dexterity assessment
framework based on an in-depth analysis of both human and robotic dexterity. This
analysis considered the range of dexterous requirements within flexible manufacturing
processes, as their identification helped in the design of a suitable framework that
compliments other manufacturing assessment tools and maximises its scope and
usability. In addition, the resulting framework accounted for the challenges outlined
above by designing and incorporating a number of standardised performance metrics
and test methods. These performance metrics provided a greater insight into the
dexterous ability of industrial robots within flexible manufacturing processes.
To validate the hypothesis, the developed framework was used to consider a number
of robotic systems within flexible manufacturing scenarios. Each robotic system was
analysed using the developed performance metrics, and their results incorporated
within the developed framework to estimate the system’s performance in the given
scenarios. The objective in this instance was to calculate the dexterity of the robotic
systems and identify their capability and suitability for each scenario. Equally
important was to perform actual testing with each robotic system in order to
quantify the accuracy of the estimated results and evaluate the usefulness of the
1.3
Contribution of Thesis
The work presented within this thesis provides a novel contribution to the
indus-trial robotics sector by developing a framework for assessing indusindus-trial robots and
identifying their dexterity within flexible manufacturing. In the development of this
framework, the following key contributions are made:
1. The Boothroyd-Dewhurst design-for-assembly method, an accepted standard
for analysing manufacturing assembly, is extended and used to analyse dexterity
assessments within robotics. This method is subsequently incorporated within
a functional definition of robotic dexterity and is used to classify the dexterous
requirements within flexible manufacturing processes.
2. Dexterity is explored from both human and robotic perspectives. This in-depth
analysis identifies the scope of dexterity and addresses the current difficulty in
defining the term and its contributing factors. A definition for robot dexterity
within flexible manufacturing is presented, which identifies robotic dexterity as
the ability of a robotic system to perform and adapt to the operations identified
within the B-D tables in adequate time and in the presence of uncertainty. This
functional definition is beneficial to both researchers and manufacturers as it
encourages dexterity measurements that are more targeted and informative.
3. A framework for assessing the suitability of a robotic system within flexible
manufacturing processes is developed. This framework incorporates the DFA
method to aid in the development of relevant performance metrics and ensure
a comprehensive dexterity assessment framework. The framework establishes a
direct link between manufacturing operations and robot performance metrics,
which addresses the current integration challenge and highlights the framework’s
potential within the manufacturing sector.
4. Test scenarios are proposed to benchmark robotic performance within flexible
manufacturing and to validate the developed framework. These scenarios
incorporate standardised test methods, artefacts and data analysis tools to
are used to assess a number of collaborative industrial robots. The numerical
results provide an insight into the dexterity of each robotic system, and help
to quantify the current gap between human and robotic dexterity which must
be reduced if collaborate robots are to become a viable option within flexible
Background and Literature
Review
2.1
Preliminary Note
As noted in Section 1.3, one of the key contributions of this work is the exploration of
dexterity and the development of a definition and measurement of robotic dexterity
within flexible manufacturing. However, it useful at this stage to present a preliminary
definition of flexible manufacturing and dexterity, as an understanding of these will
assist the reader as they advance through the remainder of this chapter.
In this work, flexible manufacturing refers to manufacturing processes that incur
changes at the macro level (e.g. in product volume and mix) and/or the micro level
(e.g. disturbances in product geometry or material properties). It is a part of the
agile manufacturing approach, whereby a company’s processes and structure are
organised to enable a swift response to changing consumer needs and markets. While
agile manufacturing is employed at all stages of production, the scope of flexible
manufacturing is limited to the production of features, workpieces, and sub-products
within manufacturing stations, cells, and/or segments.
In general terms, dexterity refers to the ability of a system to “find a motor solution
for any situation and in any condition” [4]. While this definition can refer to
systems of varying scale, this work focuses on the dexterity of the hand and arm.
Accordingly, robotic dexterity within flexible manufacturing can be defined at this
stage as the ability of a robotic system to perform the range of operations within
is only a preliminary definition of robotic dexterity and will be updated in Chapter
3 based on the more in-depth analysis of dexterity performed in Section 2.5.
2.2
Manufacturing Overview
2.2.1
Manufacturing Sector
Manufacturing is a secondary economic activity that involves the value-added
conver-sion of raw materials into finished goods through the use of labour, tools, machines,
and other processes. It is a wealth producing activity, and accordingly is a key
contributor to a country’s economy during development and industrialisation. For
modern-day societies with higher levels of socio-economic development, secondary
activities typically account for 15% to 20% of the society’s workforce distribution
(see Figure 2.1).
2.2.2
Manufacturing within Ireland
Manufacturing is an important activity for ensuring Ireland’s economic stability. In
2014, manufacturing supported the direct employment of 218,500 people and close to
double that number when including indirect employment [7], [8]. The area amounted
to 19.55% of Ireland’s Gross Domestic Product (GDP) in 2013, and is a key driver of
Research and Development (R&D) within Irish based firms. Action plans developed
by the Government [9] and state agencies such as the Industrial Development Agency
(IDA) Ireland [10] identify manufacturing as an important area for job generation and
development within Ireland. This highlighted by the 10,000 jobs that were created
during the two year period between 2012 and 2014 [8], [9] and IDA Ireland’s plan to
create 80,000 new jobs within manufacturing between 2015 and 2019 [11].
The primary sectors in which manufacturing firms operate within Ireland are shown
in Figure 2.2. Of these sectors, Ireland has identified the food, medical technologies,
(bio-)pharmaceutical, ICT, and engineering sectors as key areas for ensuring success
in the future. Focus has been placed on these sectors as they address global trends
and issues such as globalisation, ageing populations, environmental concerns, and
changing consumption behaviours [9].
To establish Ireland as an advanced manufacturing centre within Europe, the Irish
government are investing heavily within the manufacturing sector. For example,
20.7% of the total money spent by the government on R&D in 2014 (equivalent
to e150.3m) was directly invested in industrial production and technology [13].
Furthermore, six of the fourteen key focus areas for competitive public research
funding (as identified by the Research Prioritisation Steering Group) are directly
[image:49.595.160.474.506.717.2]related to manufacturing sector [14].
While interest in manufacturing is growing, the level of robotic automation within
Ireland is relatively low. One reason for this is the dominance of small and medium
enterprises (SMEs), which account for 99.8% of the total number of enterprises
within Ireland (see Figure 2.3) [15]. Due to their size, SMEs tend to utilise more
flexible manufacturing processes that have traditionally favoured manual assembly
over automation. However, as robotic technologies advance and more flexible and
collaborative industrial robots are developed, there is significant potential for the
adoption of industrial robots within these enterprises. This will be discussed in
[image:50.595.106.462.330.536.2]greater detail in Section 2.4.2.
2.2.3
Manufacturing Processes
Within manufacturing, processes are classified according to six major groups [16]:
1. Primary Shaping Processes: The initial shaping of a product from an amorphous
material. These processes form the general product shape e.g. casting, forging,
and rolling.
2. Secondary or Machining Processes: Subsequent processes after primary
pro-cessing which improve the basic shape and ensure it meets some of the products
specifications e.g. milling, turning, and drilling.
3. Metal Forming Processes: The deformation and displacement of the metal
to the required final shape. Achieved using suitable forces, pressures, and/or
stresses at temperatures above (hot working) or below (cold working) the metal’s
recrystallisation temperature e.g. forging, rolling, extrusion, and drawing.
4. Joining Processes: The joining of parts together to form the product. Processes
can result in a temporary, semi-permanent, or permanent joint, and are widely
used within fabrication and assembly e.g. welding, soldering, adhesive bonding,
and mechanical fastening.
5. Surface Finishing Processes: Processes which impart the specified surface finish
by negligible material removal / addition e.g. polishing, grinding, and painting.
6. Property Altering Processes: Processes which change the material’s
micro-structure to alter its mechanical properties e.g. annealing, tempering, and shot
2.2.4
Manufacturing Systems
In general, a manufacturing process can be performed using manual labour, fixed
automation, flexible automation, or some combination of these. With reference to
Figures 2.4 and 2.5, the most suitable system for a manufacturer is dependent on a
number of factors including:
• Availability and cost of labour
• Available capital
• Product variability
• Product life cycle
• Production volume
2.2.4.1 Manual Labour
A manual manufacturing system is performed by human operators with or without
the aid of mechanical tools. Manual labour is particularly suited to production lines
with high variability due to our natural problem solving ability and high levels of
dexterity. This combined with low initialisation costs means that manual labour
is typically used to meet low-volume production requirements of SMEs. However
manual labour has its drawbacks, such as high operation costs and a human’s inability
to work consistently or continuously.
2.2.4.2 Fixed Automation
Fixed automation refers to specialised manufacturing systems that utilise
special-purpose equipment to automate a sequence of operations. Since fixed automation is
only efficient if the full manufacturing process is automated, individual operations are
often performed by custom-engineered equipment to ensure constant and continuous
production. Since the performable operations are restricted by the configuration of
this equipment, fixed automation is relatively inflexible to changes to the production
process. However, this system supports high production rates, which makes it
particularly suited for manufacturing products with very high demands and volumes.
Since a custom-engineered and dedicated manufacturing system requires significant
Figure 2.4: Example of cumulative cost (investment + labour + operating cost) for different types of production, showing the high initial investment required for automation and continual cost of manual labour. The time it takes to recover the cost of the investment is known as the payback period (PB) (generated with reference to [17]).
at these large production volumes thanks to economies of scale. Examples of fixed
automation include the machining transfer lines commonly seen within the automotive
sector and automatic assembly machines [18].
2.2.4.3 Programmable Automation
Programmable automation refers to productions which utilise equipment that are
capable of changing the sequence of operations to accommodate product variations.
As its name suggests, the operation sequence is controlled by a program which can
be re-coded as necessary. Programmable automation has a relatively low production
rate (compared to fixed automation), but is much more susceptible to variations in
the production process. While the use of general-purpose equipment requires initial
investment, programmable automation is typically used in low- and medium-volume
batch production that require program and tool alterations between runs. This
changeover means that downtime between batches is a feature of programmable
automation. Examples of programmable automation includes computer numerical
Figure 2.5: Example unit assembly cost for different types of production in relation to annual production volume (generated with reference to [19]). The highlighted zone shows the production volumes at which collaborative robots become a financially viable option.
2.2.4.4 Flexible Automation
Flexible automation is an extension of programmable automation. While flexible
automation is a relatively new concept and its principles are still evolving, it is
currently distinguishable from programmable automation in that it has the capability
to switch between part programs and alter its physical setup with no loss in production
time. Accordingly, flexible automation facilitates the continuous production of
different product ranges or variations.
Similar to the other forms of automation, flexible automation requires high initial
investment in order to procure the necessary equipment. However, its elimination
of downtime allows flexible automation to achieve better production rates than
programmable automation (but still not comparable to fixed automation). This makes
flexible automation particularly suited to lower volume production, as highlighted in
Figure 2.5. Examples of flexible automation are the flexible manufacturing systems
2.2.5
Flexible Manufacturing
Due to global trends such as the increased pace of globalisation, growing competition,
reduced product life cycles, and consumer demands for greater product customisation
[1], [2], [9], [20] there is an increased interest in smart factories which will adopt
more flexible manufacturing processes to improve their customisation capabilities
and responsiveness to change.
As shown in Figure 2.6, manufacturing flexibility can be considered a part of agile
manufacturing, which refers to the organisation of company’s processes and structures
to enable a swift response to changing consumer needs and markets. Within this
hierarchy, flexibility incorporates the production of pieces and components within
workstations, cells, and factory segments. In this sense, flexibility within
manufactur-ing has been defined as the, “operative ability of a manufacturing or assembly system
to switch with minimal effort and delay within a pre-defined family of work pieces or
sub-assemblies by re-programming, re-routing, or re-scheduling the same system” [21].
Similarly in other work, manufacturing flexibility has been described as the ability
to adaptively respond to changing circumstances or environmental uncertainty with
minimal impact on time, effort, or performance [22]–[25].
As summarised by Jonsson in [25], manufacturing flexibility can be further broken
down by phases (e.g. value chain), hierarchy (e.g. machine level), or objects (e.g.
products). Regardless of the type, flexibility has three elements [24], [25], [27]:
• Range: The range of products that can be produced by the manufacturing system
• Response: The ease (time, cost, etc.) at which the manufacturing system can respond to each product within this range
• Uniformity: The ability of the system to handle changes without impacting performance (e.g. quality and profitability)
Within this thesis, flexible manufacturing is the term used for a manufacturing
envi-ronment that requires all or some of the three elements identified above. Accordingly,
to perform within this environment a manufacturing system must be capable of
responding to changes at the macro level (e.g. in product volume and mix) and
micro level (e.g. disturbances in product geometry or material properties) [25]. With
reference to Figure 2.6, flexible manufacturing requires flexibility, reconfigurability
and changeover ability to enable the production of sub-products at station, cell, or
segment level.
2.2.6
Manufacturing Assembly
Assembly is a particularly prevalent and important part of flexible manufacturing
as it accounts for up to 30% of a product’s manufacturing costs and 50% of its
manufacturing time [28]. Of the different manufacturing systems presented in Section
2.2.4, manual labour is best suited for production lines with high variability and
consequently is the most widely used assembly approach within this area. This
is particularly true within SMEs, as small-scale, low-volume production currently
makes manual assembly the most economically viable choice.
Within manual assembly, there are eight layouts commonly used which help to
categorise the assembly process (see Figure 2.7). These layouts are dependent on the
size of the parts being assembled and the tools required, but in general their floor
Figure 2.7: Assembly layouts defined by Boothroyd [29] (small to large scale): (a) Bench layout, (b) multi-station layout, (c) modular assembly layout, (d) custom assembly layout, (e) flexible assembly layout and (f) large multi-station layout. Other assembly layouts not shown are the very small assembly layout (e.g. clean room assembly) and assembly on site.
Accordingly, small-scale assemblies typically utilise the bench and multi-station
layouts that do not require bending, turning, or walking during the process, while
large-scale assemblies utilise the flexible and large multi-station layouts that allow
parts to be stored, oriented, and fabricated with greater ease. Large-scale assemblies
tend to require additional tools for transport and alignment, which further increases
their required footprint. An assembly line is most commonly used within manual
assembly. In this setup, the product moves along an automated line while operators
perform their assembly tasks at designated workstations (i.e. multi-station layout).
To optimise a manual assembly’s layout, the complete process can be decomposed
into Primary Assembly Processes (PAP) and Secondary Assembly Processes (SAP)
[30]. The former refers to all operations which directly contribute to the formation
![Figure 2.2: Breakdown of the total Net Selling Value (NSV) of Ireland’s productionby sector in 2015 (data from [12]).](https://thumb-us.123doks.com/thumbv2/123dok_us/8810785.918389/49.595.160.474.506.717/figure-breakdown-total-selling-value-ireland-productionby-sector.webp)
![Figure 2.3: Distribution of enterprises and persons engaged within Ireland in 2014(taken from [15]).](https://thumb-us.123doks.com/thumbv2/123dok_us/8810785.918389/50.595.106.462.330.536/figure-distribution-enterprises-persons-engaged-ireland-taken.webp)

![Figure 2.7: Assembly layouts defined by Boothroyd [29] (small to large scale): (a)Bench layout, (b) multi-station layout, (c) modular assembly layout, (d) customassembly layout, (e) flexible assembly layout and (f) large multi-station layout](https://thumb-us.123doks.com/thumbv2/123dok_us/8810785.918389/57.595.102.523.104.401/figure-assembly-dened-boothroyd-assembly-customassembly-exible-assembly.webp)
![Figure 2.9: Time requirement for a reach (Case B) movement in relation to distance.Shown is the differentiation between PAP and SAP when (a) handling relativelysmall parts, and (b) handling relatively large parts (taken from [30]).](https://thumb-us.123doks.com/thumbv2/123dok_us/8810785.918389/61.595.186.440.100.321/requirement-movement-relation-dierentiation-handling-relativelysmall-handling-relatively.webp)

![Figure 2.21: The high-speed hand-arm system used by the Ishikawa WatanabeLaboratory (taken from [73]).](https://thumb-us.123doks.com/thumbv2/123dok_us/8810785.918389/77.595.239.387.100.301/figure-high-speed-hand-used-ishikawa-watanabelaboratory-taken.webp)