ScholarWorks @ Georgia State University
Business Administration Dissertations Programs in Business Administration
Spring 5-5-2018
An Empirical Study in the U.S. Hotel Industry:
How Quality Assurance, Customer Satisfaction,
Brand Signaling, and Guest Loyalty Impact
Revenue
Kevin Morgan
Follow this and additional works at:https://scholarworks.gsu.edu/bus_admin_diss
This Dissertation is brought to you for free and open access by the Programs in Business Administration at ScholarWorks @ Georgia State University. It has been accepted for inclusion in Business Administration Dissertations by an authorized administrator of ScholarWorks @ Georgia State University. For more information, please [email protected].
Recommended Citation
Morgan, Kevin, "An Empirical Study in the U.S. Hotel Industry: How Quality Assurance, Customer Satisfaction, Brand Signaling, and Guest Loyalty Impact Revenue." Dissertation, Georgia State University, 2018.
In presenting this dissertation as a partial fulfillment of the requirements for an advanced degree from Georgia State University, I agree that the Library of the University shall make it available for inspection and circulation in accordance with its regulations governing materials of this type. I agree that permission to quote from, copy from, or publish this dissertation may be granted by the author or, in her absence, the professor under whose direction it was written or, in his absence, by the Dean of the Robinson College of Business. Such quoting, copying, or
publishing must be solely for scholarly purposes and must not involve potential financial gain. It is understood that any copying from or publication of this dissertation that involves potential gain will not be allowed without written permission of the author.
All dissertations deposited in the Georgia State University Library must be used only in accordance with the stipulations prescribed by the author in the preceding statement.
The author of this dissertation is: Kevin John Morgan
4726 Village Dr. Fairfax, VA 22030
The director of this dissertation is:
Danny Bellenger
J. Mack Robinson College of Business Georgia State University
Brand Signaling, and Guest Loyalty Impact Revenue
by
Kevin John Morgan
A Dissertation Submitted in Partial Fulfillment of the Requirements for the Degree
Of
Executive Doctorate in Business
In the Robinson College of Business
Of
Georgia State University
GEORGIA STATE UNIVERSITY
ROBINSON COLLEGE OF BUSINESS
Copyright by Kevin John Morgan
This dissertation was prepared under the direction of the KEVIN JOHN MORGAN Dissertation
Committee. It has been approved and accepted by all members of that committee, and it has been
accepted in partial fulfillment of the requirements for the degree of Doctor of Philosophy in
Business Administration in the J. Mack Robinson College of Business of Georgia State
University.
Richard Phillips, Dean
DISSERTATION COMMITTEE
Dr. Danny Bellenger (Chair)
Dr. Wesley Johnston
ACKNOWLEDGEMENTS
Special thank you to my dissertation chair, Dr. Danny Bellenger, and committee
members, Dr. Wesley Johnston and Dr. Debra Cannon. Additionally, gratitude and appreciation
TABLE OF CONTENTS
I INTRODUCTION ... 1
I.1 Hotel Industry ... 1
I.2 Quality And Customer Satisfaction ... 2
I.3 Big Data to Determine the Relationship ... 3
II LITERATURE REVIEW ... 5
II.1How Quality Assurance Drives Customer Satisfaction and Recommendation ... 5
II.2Customer Satisfaction AND Quality Assurance: The Chicken Or The Egg ... 7
II.3How Customer Satisfaction Impacts Market Share (RPI) ... 9
II.4How Market Share (RPI) Drives Revpar ... 12
II.5Importance of Revpar... 14
II.6Explaining the Experience With Quality and Customer Satisfaction ... 16
II.7Expectation Confirmation Theory ... 16
II.7.1 Framework of the Expectation Confirmation Theory ... 18
II.7.2 Expectation ... 19
II.7.3 Disconfirmation ... 21
II.7.4 Satisfaction ... 23
II.7.5 Attitude and Intention ... 25
II.7.6 The Expectation Confirmation Theory–related to Hotel Guests ... 26
II.7.7 Distrust: Implications on Perceived Performance and Satisfaction ... 30
II.8Franchising and the Role of the Agency Theory ... 32
II.8.1 Role of Franchising in Hotels ... 34
II.8.3 Role of the Agency Theory... 37
II.8.3.1 Horizontal Agency Cost with Regard to Free Riding ... 40
II.8.3.2 Vertical Agency Cost with Regard to Employee-Manager Incentives ... 41
II.9The Role of the Brand... 42
II.9.1 Definition of a Brand ... 42
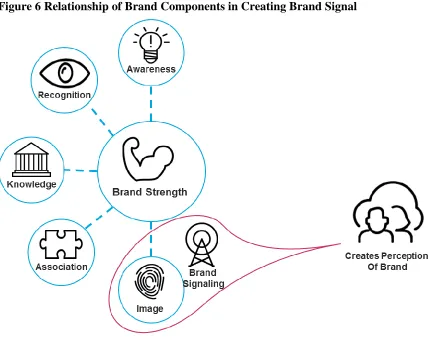
II.9.2 Brand Equity, Strength, and Resulting Signaling ... 46
II.9.3 Brand Awareness and Recognition ... 48
II.9.4 Brand Knowledge ... 50
II.9.5 Brand Association ... 51
II.9.6 Brand Signaling and Image ... 52
III METHODS ... 54
III.1 Research Question(S) And Model... 54
III.2 Partial Least Squares-Structural Equation Model (Pls-Sem) ... 55
III.3 Definition of Variables ... 56
III.3.1 Dependent Variables ... 57
III.3.2 Independent Variables ... 57
III.3.3 Moderating Variables ... 58
III.3.4 Control Variables ... 58
III.3.5 Data Sources ... 59
III.4 Testable Hypotheses ... 61
III.4.1 H1: Increased Quality Assurance scores will increase Customer Satisfaction: Experience scores ... 61
III.4.3 H3: The Interaction Effect between Guest Loyalty Mix of Business and
Quality Increases Customer Satisfaction: Experience ... 64
III.4.4 H4A / H4B: Increased Customer Satisfaction: Experience will result in increased Customer Recommendation; Increased Customer Recommendation will result in increased Market Share (RPI) ... 65
III.4.5 H5: Increased Market Share (RPI) will increase Revenue Per Available Room (RevPAR) ... 67
IV RESULTS AND ANALYSES ... 69
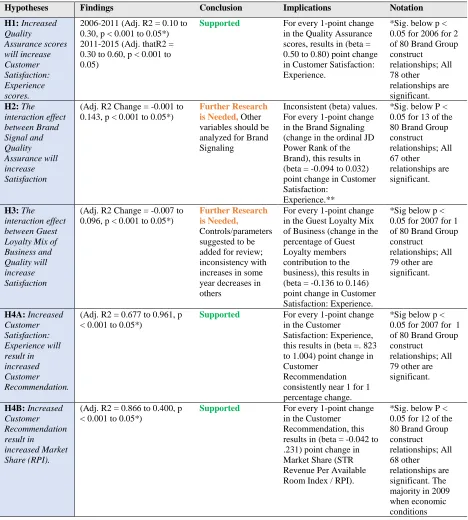
IV.1 Hypotheses Summary and Analyses Outcomes ... 69
IV.2 Rationale For Partial Least Squares-Structural Equation Model (PLS-SEM) ... 71
IV.3 Partial Least Squares-Structural Equation Modeling (PLS-SEM) Baseline Model Validation... 72
IV.3.1 Reflective Measurement Model Validation ... 73
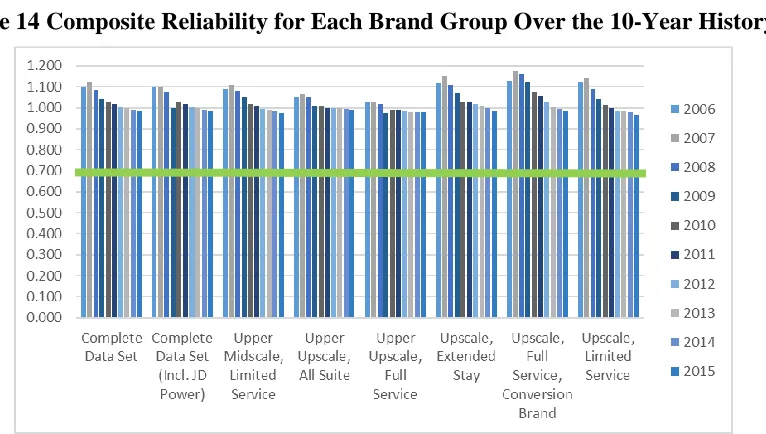
IV.3.1.1 Internal Consistency Reliability: Composite Reliability ... 74
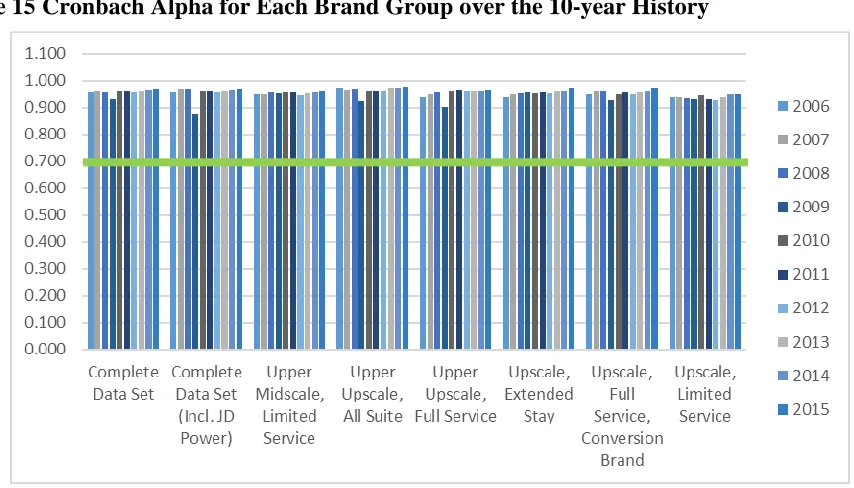
IV.3.1.2 Internal Consistency Reliability: Cronbach Alpha... 75
IV.3.1.3 Convergent Validity: Average Variance Extracted (AVE) ... 77
IV.3.1.4 Convergent Validity: Outer Loadings ... 78
IV.3.1.5 Discriminant Validity: Cross Loadings ... 81
IV.3.1.6 Discriminant Validity: Heterotrait-monotrait (HTMT) Ratio of Correlations ... 87
IV.3.2 Formative Measurement Model(s) Validation ... 90
IV.3.2.1 Significance: T-Values (Bootstrapping) ... 91
IV.3.2.2 Collinearity Statistics (VIF) ... 92
IV.4.1.1 H1: Increased Quality Assurance scores will increase Customer
Satisfaction: Experience scores ... 94
IV.4.1.2 H1: Analysis Method ... 95
IV.4.1.3 H1: Analysis Outcome ... 95
IV.4.2 H2: The interaction effect between Brand Signal and Quality Assurance will increase Customer Satisfaction: Experience ... 99
IV.4.2.1 H2: Analysis Method ... 100
IV.4.2.2 H2: Analysis Outcome ... 100
IV.4.3 H3: The interaction effect between Guest Loyalty Mix of Business and Quality will increase Customer Satisfaction: Experience ... 104
IV.4.3.1 H3: Analysis Method ... 104
IV.4.3.2 H3: Analysis Outcome ... 104
IV.4.4 H4A: Increased Customer Satisfaction: Experience will result in increased Customer Recommendation. ... 110
IV.4.4.1 H4A: Analysis Method ... 110
IV.4.4.2 H4A: Analysis Outcome... 110
IV.4.5 H4B: Increased Customer Recommendation will result in increased Market Share (RPI). ... 116
IV.4.6 H4B: Analysis Method ... 116
IV.4.6.1 H4B: Analysis Outcome... 117
IV.4.7 H5: Increased Market Share (RPI) will increase Revenue Per Available Room (RevPAR). ... 122
IV.4.7.1 H5: Analysis Method ... 123
IV.4.7.2 H5: Analysis Outcome ... 123
V.1 Contributions Of Quality On Customer Satisfaction And Guest Experience... 129
V.2 Interaction Effect Of Brand Signaling With Quality On Customer Satisfaction And Guest Experience ... 133
V.2.1 Interaction Effect of Guest Loyalty Mix of Business with Quality on Customer Satisfaction and Guest Experience ... 135
V.3 Customer Satisfaction And Guest Experience Impact Customer Recommendation ... ... 139
V.4 Customer Recommendation Impact On Market Share (RPI) ... 140
V.5 Market Share (RPI, STR Revenue Per Available Room Index) Impact On Revenue Per Available Room (Revpar) ... 142
VI CONCLUSION ... 145
VIIAPPENDIX ... 148
A.1 Data Dictionary ... 148
A.2 Inflation Calculations ... 153
A.3 Customer Survey Questions ... 154
A.4 PLS Models (2006 – 2015, PLS And BOOTSTRAPPING Diagrams) ... 155
REFERENCES ... 205
LIST OF TABLES
Table 1 Core Variables for Analysis ... 3
Table 2 Quality vs. Customer Satisfaction: Experience and Customer Recommendation .... 8
Table 3 Expectation Confirmation Theory Definition (Oliver, 1980) ... 19
Table 4 Positive and Negative Disconfirmation (Oliver, 1977) ... 21
Table 5 Explanation of Resulting Intention to Purchase (Oliver, 1980) ... 28
Table 6 Difference between the Expectation Confirmation Theory and the Agency Theory ... 30
Table 7 Horizontal and Vertical Agency Costs Related to Franchising ... 39
Table 8 Components of Brand Strength That Drive Brand Signaling ... 44
Table 9 Definitions of Independent Variables for Explaining Customer Experience ... 56
Table 10 Descriptive Statistics on Hotel Sample ... 59
Table 11 Descriptive Statistics on Quality Assurance Visits ... 60
Table 12 Descriptive Statistics on Customer Satisfaction Survey Scores for Hotels ... 60
Table 13 Hypotheses Summary and Outcomes ... 70
Table 14 Composite Reliability for each Brand Group over the 10-year history ... 75
Table 15 Cronbach Alpha for Each Brand Group Over the 10-Year History ... 76
Table 16 Average Variance Extracted (AVE) for Each Brand Group Over the 10-Year History ... 77
Table 17 Reflective Measurement Outer Loadings for All Models ... 79
Table 18 Cross Loading for 2006, All Brand Groups ... 81
Table 19 Cross Loading for 2007, All Brand Groups ... 82
Table 20 Cross Loading for 2008, All Brand Groups ... 82
Table 22 Cross Loading for 2010, All Brand Groups ... 83
Table 23 Cross Loading for 2011, All Brand Groups ... 84
Table 24 Cross Loading for 2012, All Brand Groups ... 84
Table 25 Cross Loading for 2013, All Brand Groups ... 85
Table 26 Cross Loading for 2014, All Brand Groups ... 86
Table 27 Cross Loading for 2015, All Brand Groups ... 86
Table 28 Model Variables Under Review ... 87
Table 29 Maximum Figure for ALL HTMT Tables ... 88
Table 30 Special Note for HTMT Variable Exceeding .90 ... 89
Table 31 Significance: T-Values for All Data Models (Bootstrapping) ... 92
Table 32 Variance Inflation Factor (VIF) for Collinearity Issues ... 93
Table 33 Adjusted R2 for Quality: Quality Assurance to Customer Satisfaction: Experience ... 96
Table 34 Significance: Bootstrapping T-Values for Quality: Quality Assurance to Customer Satisfaction: Experience ... 97
Table 35 Path Coefficient for Quality: Quality Assurance to Customer Satisfaction: Experience ... 98
Table 36 R2 Change with Interacting Effect of Brand Signaling on Customer Satisfaction: Experience ... 101
Table 37 Significance: Bootstrapping T-Values for Interaction Effect of Brand Signaling on Customer Satisfaction: Experience ... 102
Table 38 Path Coefficient for Bootstrapping T-Values for Interaction Effect of Brand Signaling on Customer Satisfaction: Experience ... 103
Table 40 Significance: Bootstrapping T-Values for Interaction Effect of Quality Assurance
on Guest Loyalty Mix of Business (H3) ... 107
Table 41 Path Coefficient for Interaction Effect of Quality Assurance on Guest Loyalty
Mix of Business (H3) ... 108
Table 42 Adjusted R2 for Customer Satisfaction: Experience to Customer
Recommendation... 111
Table 43 Significance: Formative Customer Satisfaction: Experience Drives Reflective
Customer Recommendation (H4A) ... 114
Table 44 Path Coefficient for Formative Customer Satisfaction: Experience Drives
Reflective Customer Recommendation (H4A) ... 115
Table 45 Rationale for STR Occupancy Control Variable ... 116
Table 46 Adjusted R2 for Customer Recommendation to Market Share (STR Revenue per
Available Room Index / RPI) ... 117
Table 47 Significance: Bootstrapping T-Values for Customer Recommendation to Market
Share (STR Revenue per Available Room Index / RPI) ... 119
Table 48 Path Coefficient for Customer Recommendation to Market Share (STR Revenue
per Available Room Index / RPI) ... 120
Table 49 Rationale for ADR, Guest Rooms, and STR Asset Age ... 122
Table 50 Adjusted R2 for Market Share (RevPAR Index, RPI) to Dependent Variable:
Revenue per Available Room (RevPAR) ... 124
Table 51 Significance: Bootstrapping T-Values for Market Share (RevPAR Index, RPI) to
Dependent Variable: Revenue per Available Room (RevPAR) ... 126
Table 52 Path Coefficient for Market Share (RevPAR Index, RPI) to Dependent Variable:
Revenue per Available Room (RevPAR) ... 127
Table 53 Contribution to Practice: Management at the Hotel ... 130
Table 55 Special Note: Outcomes with Quality Assurance ... 132
Table 56 Impact of Quality on RevPAR ... 132
Table 57 Extractions Which the Data Suggest ... 134
Table 58 Extractions Which the Data Suggest ... 135
Table 59 Correlation Results of Guest Loyalty to RevPAR by Brand Group ... 137
Table 60 Occupancy Change Year Over Year for Complete Data Set ... 138
Table 61 Impact of Quality Assurance on RevPAR ... 139
Table 62 Extractions Which the Data Suggest ... 139
Table 63 Impact of Quality Assurance on RevPAR ... 141
Table 64 Extractions Which the Data Suggest ... 142
Table 65 Impact of Quality Assurance on RevPAR ... 143
LIST OF FIGURES
Figure 1 Impact of Quality Assurance on Customer Satisfaction and Recommendation ... 5
Figure 2 Customer Satisfaction Impacts on Hotel Occupancy ... 9
Figure 3 Hotel Market Share Impact on RevPAR ... 12
Figure 4 Focus on Importance of RevPAR ... 15
Figure 5 A Cognitive Model of the Antecedents and Consequences of Satisfaction Decisions (Oliver, 1980) ... 27
Figure 6 Relationship of Brand Components in Creating Brand Signal ... 47
Figure 7 Model for Explaining Revenue per Available Room ... 54
Figure 8 Hypothesis Diagram ... 62
Figure 9 Hypothesis Diagram ... 63
Figure 10 Hypothesis Diagram ... 64
Figure 11 Hypothesis Diagram ... 66
Figure 12 Hypothesis Diagram ... 67
Figure 13 Customer Recommendation—Reflective Measurement Model ... 73
Figure 14 Composite Reliability for Each Brand Group Over the 10-Year History ... 75
Figure 15 Cronbach Alpha for Each Brand Group Over the 10-year History ... 76
Figure 16 Average Variance Extracted (AVE) for Each Brand Group Over the 10-Year History ... 78
Figure 17 Reflective Measurement Outer Loadings for All Models ... 80
Figure 18 Maximum Figure for ALL HTMT Tables ... 89
Figure 19 Quality Assurance—Formative Measurement Model & Customer Satisfaction: Experience – Formative Measurement Model ... 91
Figure 21 Path Coefficient for Quality: Quality Assurance to Customer Satisfaction:
Experience ... 99
Figure 22 R2 Change with Interacting Effect of Brand Signaling on Customer Satisfaction:
Experience ... 101
Figure 23 Path Coefficient for Interaction Effect of Brand Signaling on Customer
Satisfaction: Experience ... 103
Figure 24 R2 Change with Interaction Effect of Quality Assurance on Guest Loyalty Mix of
Business (H3) ... 106
Figure 25 Path Coefficient for Interaction Effect of Quality Assurance on Guest Loyalty
Mix of Business (H3) ... 108
Figure 26 Adjusted R2 for Customer Satisfaction: Experience to Customer
Recommendation... 112
Figure 27 Path Coefficient for Formative Customer Satisfaction: Experience Drives
Reflective Customer Recommendation (H4A) ... 115
Figure 28 Adjusted R2 for Customer Recommendation to Market Share (STR Revenue per
Available Room Index / RPI) ... 118
Figure 29 Path Coefficient for Market Share (STR Revenue per Available Room Index /
RPI) ... 120
Figure 30 Adjusted R2 for Market Share (RevPAR Index, RPI) to Dependent Variable:
Revenue per Available Room (RevPAR) ... 125
Figure 31 Path Coefficient for Market Share (RevPAR Index, RPI) to Dependent Variable:
Revenue per Available Room (RevPAR) ... 127
Figure 32 Path Coefficients for H3: Interaction Effect of Quality Assurance on Guest
ABSTRACT
An Empirical Study in the U.S. Hotel Industry: How Quality Assurance, Customer Satisfaction,
Brand Signaling, and Guest Loyalty Impact Revenue
by
Kevin John Morgan
May 2018
Chair: Danny Bellenger
Major Academic Unit: Executive Doctorate in Business
The hotel industry is a major area of the U.S. economy, contributing nearly $176 billion
to Gross Domestic Product in 2014 (AHLA, 2017). For large hospitality brands (franchisors),
quality and customer satisfaction are important in driving customer stays or occupancy. In this
study, secondary data from a large hospitality company (with more than 3,600 hotels) with a
portfolio of brands were used to explain the relationship between revenue, or RevPAR, and
market share (Smith Travel Research [STR] Revenue per Available Room Index or known as
RPI), customer satisfaction, and quality assurance moderated by brand signaling and loyalty.
Looking through the lens of the Expectation Confirmation Theory (ECT), this study shows how
expectations and satisfaction play a role in predicting revenue implications based on customer
behavioral decisions. The model proves the relationship between the various aspects of the
customer experience, including how quality assurance scores measure hotel delivery and
execution, which standards are set by the brand, and the extent to which customers’ expectations
are moderated by brand signaling and loyalty. Additionally, how resulting disconfirmation (or
confirmation) measured by customer survey results of meeting or not meeting expectations, and
captured). This study proves that brand managers should spare no costs to ensure that quality
assurance is a priority to protect the tangible and intangible aspects of their brands. The data
support that on average, a 10-point increase in Quality Assurance results in up to a $1.05
increase in RevPAR; a 5- to 8-point increase in Customer Experience (Overall Experience and
Problem Free Stays) results in up to a $1.05 increase in RevPAR; a 4- to 8-point increase in
Customer Recommendation results up to a $1.05 in RevPAR; and a 2-point increase in Market
Share (RPI) results in up to a $1.05 increase in RevPAR.
INDEX WORDS: Hotel, Hospitality, Quality Assurance, Customer Satisfaction, Customer
Recommendation, Guest Experience, Revenue Per Available Room, RevPAR,
Occupancy, RevPAR Index, Smith Travel Research, STR, Average Daily Rate, ADR,
Market Share, Franchising, Brand Management, Brand Signaling, Branding, Loyalty,
I INTRODUCTION
I.1 Hotel Industry
The hotel industry is a major area of the U.S. economy, contributing nearly $176 billion
to Gross Domestic Product in 2014 (AHLA, 2017). The U.S. hotel industry represents $1.1
trillion dollars in sales (hotel revenue, guest spending, and taxes), services five million guests per
day, and employs eight million American workers (AHLA, 2017). With nearly 54,200 hotel
properties in the U.S., 61 percent of hotels are small businesses, supporting $355 billion in labor
income and capital investments of $13 billion (AHLA, 2017). This multi-trillion-dollar business
depends on leisure customers to spend their discretionary incomes on travel, business travelers to
opt for face-to-face experiences over virtual ones, conventions and large events, the government
to invest in projects, and the economy to continue to thrive. Whether a hotel is owned by a single
entity or controlled by a publicly traded company, customer demand drives the cycle of the
business.
Hotel industry market segments are defined by chain scales of luxury, upper upscale,
upscale, upper midscale, midscale, economy, and independents. Operator types range from
owner companies and management companies to real estate investment trusts (REITs),
developers, and asset managers. This broad base of owner profiles combined with market
segments creates a dynamic industry that caters to all walks of life. The dynamic environment as
a result of this dichotomy allows for brands to expand through franchises and become household
names. As a result, these brands are afforded the luxury to grow around the globe and thrive with
innovation and strength.
The majority of U.S. hotels are franchised. The relationship between the franchisor and
the factors that contribute to customer (or consumer) satisfaction, quality, and revenue. The
hospitality industry has its roots in creating memorable experiences for travelers coming from
places near and far. Whether travelers are on a budget or are making the trip of a lifetime to
destinations around the world and expecting the highest touch, the industry caters to all types of
discerning travelers. Engrained in customers is an expectation associated with an experience,
which is the foundation for customer experiences.
I.2 Quality and Customer Satisfaction
For large hospitality brands (franchisors), quality and customer satisfaction are important
in driving customer stays, or occupancy. If a hotel room is left unsold, that room night is lost
forever. Therefore, proper management of the hotel and strategies to drive business are
imperative to performance. The key in franchising is to provide a product the customer can
depend on, to drive revenue, and ultimately to capture market share (Smith Travel Research
Revenue Per Available Room Index also referred to as RPI). For publicly traded hotel
companies, driving market share (RPI) and average daily rate (ADR), or the average of what is
charged to the customer, contributes to driving stock price and shareholder value. This cycle of
managing hotel performance has an impact on investors of not only franchises but also the
franchisors. Franchise organizations’ primary sources of income are from royalty fees or
percentages of revenue collected by the franchisees. For every room sold, the franchisor collects
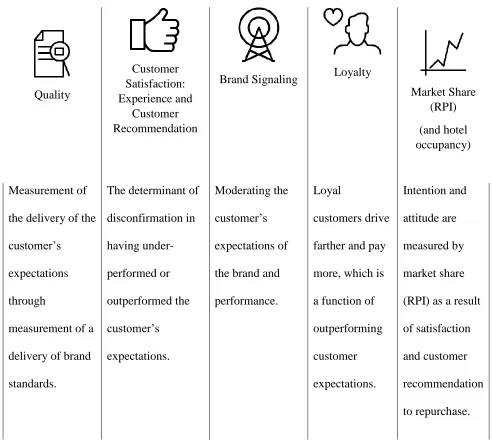
Table 1 Core Variables for Analysis
Quality
Assurance
Customer Satisfaction: Experience and
Customer Recommendation
Market Share (RPI)
(and hotel occupancy)
Revenue per Available Room
(RevPAR)
In this study, big data from a large hospitality company with a portfolio of brands were
used to explain the relationship between revenue, or RevPAR, and market share (RP)I; customer
recommendation; customer satisfaction: experience; and quality assurance moderated by brand
signaling. Customer Satisfaction: Experience is the measurement for meeting customers’
expectations while at the hotel, which results in customer recommendation. Customer
recommendation is the post-purchase intent formed by the customer for future purchases, which
directly drives market share and occupancy, and is impacted by loyalty. Quality assurance
measures a hotel’s compliance with brand standards that measure customer expectations.
Compliance with standards and expectations results in higher satisfaction. This sequence of
relationships explains how hotels drive RevPAR.
I.3 Big Data to Determine the Relationship
A considerable amount of research concentrates on the behavioral aspects of hospitality
and customer satisfaction, but there is a noticeable gap with long-term studies using empirical
data. This research deliberates on the quality assurance, customer satisfaction, and hotel
gap in linking the Expectation Confirmation Theory to the multi-unit analysis of a large
hospitality company over multiple years. This study contributes significantly to research not
only in hotels but also from a customer service perspective overall in providing year-over-year
analyses of how hotel customer satisfaction and quality influence customer behavior through the
lens of the Expectation Confirmation Theory. Additionally, this study is the first of its kind in
linking (and delineating) the effects of customer satisfaction of brands with more than 3,600
II LITERATURE REVIEW
The customer life cycle has factors that affect experience, perceptions, and
decision-making. The following sections outline the sequence of relationships in this study that were
analyzed to determine implications on Revenue per Available Room (RevPAR). With each
subsection, a discussion outlines the influencing factors, and each larger section following
provides a deep dive into the aspects that support these relationships. The subsections include
Quality Assurance; Customer Satisfaction: Experience; Customer Recommendation; Market
Share (RPI); and RevPAR.
II.1 How Quality Assurance Drives Customer Satisfaction and Recommendation
Quality assurance is focused on the brand standards. This is essentially the expectation of
the customer. The standard defines what the customer expects to experience. This experience
[image:25.612.70.523.434.687.2]expectation (quality) determines their satisfaction (did the hotel meet or not meet expectations).
Figure 1 Impact of Quality Assurance on Customer Satisfaction and Recommendation
This Subsection
Quality
Assurance
Customer Satisfaction: Experience and
Customer Recommendation
Market Share (RPI)
(and hotel occupancy)
Revenue per Available Room
(RevPAR)
Quality is the brand commitment to the
customer which drives customer
Moreover, Oliver (1977) and Churchill and Surprenant (1982) stated the case that quality
precedes customer satisfaction, and others have suggested that experience affects attitude.
Therefore, perceived quality impacts satisfaction. The literature supports a number of focus areas
for where hotel guests perceive quality:
• Oh and Kim (2017) defined satisfaction components of the guest stay to include cleanliness
of the room, maintenance, team member friendliness, and knowledgeable team members.
• Cadotte and Turgeon (1988) conducted an analysis of complaints and found that the top
areas are related to the guest room, food quality and speed of service, team member
knowledge, quietness of accommodations, and cleanliness of the hotel.
• Dube, Enz, Renaghan, and Siguaw (1999) results found that quality of service, guest room
design, and physical property are all related to satisfaction.
Regardless of the relationship to one another, the literature clearly demonstrates that there
are cases to be made that quality measures are critical to satisfaction. Fornell, Johnson,
Anderson, Cha, and Bryant (1996) referenced the American Customer Satisfaction Index (ACSI)
in regard to overall customer satisfaction, which has three antecedents: (1) perceived quality, (2)
perceived value, and (3) customer expected antecedents for customer satisfaction.
The first customer satisfaction determinant that is expected to impact customer
satisfaction is perceived quality or performance (Fornell et al., 1996). Understanding the
definition of quality and value to hotel guests allows firms to excel in marketing, segmentation,
This is similar in spirit to the position taken by Zeithaml (1988) in summarizing an
extensive review of the literature on quality: "Perceived quality can be defined as the
consumer's judgment about a product's overall excellence or superiority."
Fornell et al. (1996) cited in their research that long-term profitability is dependent on
customer loyalty and creating a long-term relationship with the guests. This is in the context that
the relationship with the guest (buyer) can create a ”warning signal” about future financial
performance, and this is impacted by customer satisfaction (Fornell et al., 1996). Anderson,
Fornell, and Lehmann (1994) further elaborated that customer satisfaction is a “function of (1)
current quality, and (2) past satisfaction.” The relationship with quality and customer satisfaction
in these examples go hand in hand. Although there is research that supports both sides of the
impact of quality and customer satisfaction; it is noteworthy to reiterate research from Yeung,
Lee Chew, and Ennew (2002) that suggested the individual-level customer measures versus
firm-level measures create complexities with the measurement of satisfaction and performance.
II.2 Customer Satisfaction AND Quality Assurance: The Chicken or The Egg
The relationship between quality and customer satisfaction is complex in nature with
some authors suggesting they are closely related, even going as far as comparing them to
“Siamese twins” (Danaher & Mattsson, 1994; Ismail, Dalbor, & Mills, 2002). However, many
arguments are made in asking the question do they impact one another and which one causes the
other. From a hotel perspective, some delineations are drawn between Quality and Customer
Satisfaction: Experience and Customer Recommendation, and the logic that weighs on each of
Table 2 Quality vs. Customer Satisfaction: Experience and Customer Recommendation
RESEARCH NOTATION
Quality Assurance
Customer Satisfaction: Experience and Customer Recommendation
Is measured by the franchisor (or brand) and
is focused on three aspects of the business:
(1) compliance with standards as set forth
by the brand, (2) cleanliness of product
offering, and (3) condition of the asset.
Measurement of satisfaction by the
customer (or guest) through surveys asking
questions about aspects of the life cycle of
the hotel experience – ranging from the
quality of the hotel and room to the food
and beverage served and to the friendliness
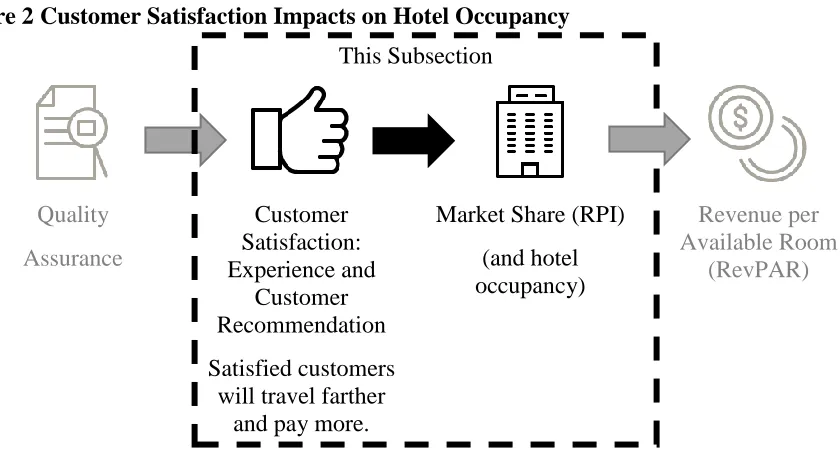
II.3 How Customer Satisfaction Impacts Market Share (RPI)
Investing in hotels is a long-term business decision that involves some aspects of
customer service, including the acquisition or attracting of guests, maintaining those guests,
satisfying their expectations, and retention. Thus, successful hotel managers must understand the
relationship between their hotels and guests, including services and offerings that drive intent to
[image:29.612.98.518.265.498.2]repurchase (Choi & Chu, 2001).
Figure 2 Customer Satisfaction Impacts on Hotel Occupancy
This Subsection
Quality
Assurance
Customer Satisfaction: Experience and
Customer Recommendation
Market Share (RPI)
(and hotel occupancy)
Revenue per Available Room
(RevPAR)
Satisfied customers will travel farther
and pay more.
“Hospitality services are, for the most part, produced by humans, and consequently, no
two guest stays will be precisely alike. Research in general marketing suggests that the
variability in performance across different consumption experiences leads to increased
uncertainty, and thus to decreased reliance on prior expectations” (Mattila & O'Neill, 2003).
Consistent with the literature is support for the positive relationship between satisfaction of
customers and performance (or profitability). The strength of the relationship sees significant
(satisfaction and repurchase intention) with aggregate, firm-level measures” (Yeung et al., 2002).
Firms are complex, and multiple aspects of the business impact a consumer experience,
especially if each stay has the potential to be different. There is little dispute, though, about the
positive relationship. Additionally, research shows that loyal customers may not necessarily pay
close attention to the “actual service” of an establishment unless “something particularly bad or
particularly good occurs” (Dube & Renaghan, 2000). Therefore, hotel guests look to experience
consistency with each purchase. Customer satisfaction alone has evolved into a requirement for
experiences that are more than the baseline expectations, and customers are shifting expectations
to that of desiring ”delight” (Yeung et al., 2002). The experiences create value in the customer’s
eyes. A study conducted by Dube and Renaghan (2000) measured loyalty and asked participants
if they intended to stay at a hotel that created customer value; the responses of the study returned
a 61 percent intent to return, whereas only 41 percent of those stays had no particular value
created—representing nearly a 50 percent increase in loyalty.
“The principles that underlie the relationship between satisfaction and firm performance
are well documented, based on the cost and revenue effects associated with increased
loyalty and repurchase. These relationships are probably most neatly encapsulated in the
concept of the service–profit chain, although their relevance extends beyond the service
context alone” (Yeung et al., 2002).
Perceived value in, “post-purchase decision-making showed immediate indication of
value created for guests has the immediate impact on the satisfaction created and loyalty
garnered by the hotel and brand.
Anderson et al. (1994) concluded in their 1994 study on customer satisfaction and
market share that the following should result:
• Increased loyalty for current guests, • Reduced price elasticities,
• Insulation of existing customers from competitive efforts, • Lower costs of future transactions,
• Reduced failure costs,
• Lower costs of attracting new customers, and
• An enhanced reputation for the firm.
“Loyal” means that more customers have the intention to repurchase and are retained for
future business (Anderson et al., 1994; Zeithaml, 1988). The same goes for lower customer
service, resulting in higher turnover and difficulty with retention, a higher cost to reacquire, and
a decrease in price elasticity (Anderson et al., 1994). The same study with Anderson et al. (1994)
also noted that changes in customer satisfaction in a single period impact future periods, which is
consistent with the ”cumulative nature of customer satisfaction”—but a firm’s return on
investment is affected by customer satisfaction.
The relationship between customer service and driving financial performance is proven
by a number of empirical studies. The relationship between satisfaction and customer intent is
clear in both a practical sense and theoretical manner. Satisfied customers, “are more willing to
pay for the benefits they receive and are more likely to be tolerant of increases in price”
(Anderson et al., 1994). In a study conducted by Oh (1999), the research suggested that at the
luxury hotel level, hotel managers (and franchisors and franchisees, in this case) must take note
quality (Oh, 1999). The entanglements of customer satisfaction are imperative to the guest
experience and measure the expectation of the customer (quality) and the actual delivery by the
hotel (satisfaction).
II.4 How Market Share (RPI) Drives RevPAR
For hotel franchisors and franchisees, each guest room has one chance to be sold; once
the clock strikes twelve, unsold rooms are gone forever. Market share (RPI) in the hotel industry
is calculated by Smith Travel Research (STR), and the calculation is RevPAR Index = RevPAR /
RevPAR Compset * (100). This metric focuses on the performance of the hotel from a RevPAR
perspective and isolates other indicators that are outlined in the paper.
Figure 3 Hotel Market Share Impact on RevPAR
This Subsection
Quality
Assurance
Customer Satisfaction: Experience and
Customer Recommendation
Market Share (RPI)
(and hotel occupancy)
Revenue per Available Room
(RevPAR)
RevPAR Index (RPI, also referred to in the literature as Revenue Growth Index, RGI) is
intended to evaluate the performance of property compared to a competitive set of locations.
RevPAR comparisons can be deceiving because of the average daily rate (ADR) that hotels
charge based on location and demand generators. RevPAR Index (RPI) can be a valuable
indication of efficiency with revenue when looking at the hotel in comparison to other locations
franchisees, market share has been at odds between the two stakeholder groups. For many
franchisees, their beliefs are that market share is not tied directly to revenue performance, and
it’s a complexity of market conditions, competing locations, and myriad factors that muddy the
water. There is no dispute that occupancy has always been an important variable related to
RevPAR, but market share seems to have always had some questions about the relationship. In
this study, market share (RPI) is proven to be critical for the overall performance of the asset.
While occupancy and average daily rate are components of RevPAR, market share is a core
determinant of the overall RevPAR performance for the hotel. If a hotel is performing above
their comp-set from a revenue perspective, they ultimately have a higher market share index
(RPI).
Since occupancy multiplied by average daily rate (total rooms revenue) is included in the
RevPAR calculation, this variable is critical to performance. O’Neill and Mattila (2006) cited
that during their study of nearly 1,900 U.S. hotels between 2002 and 2003, they uncovered that a
hotel percentage of net operating income is most closely tied to occupancy—further citing that
average daily rate has ”strong influence” as well as market segment, age, and brand affiliation.
While the importance of brand as it relates to the equation is addressed, occupancy is a critical
factor associated with the performance of the franchisor and franchisee. Market share ultimately
increases as occupancy and average daily rate increase.
As price elasticity is decreased and the greater rate is captured, the RevPAR advantage
increases accordingly. In a study conducted by Enz, Canina, and Lomanno (2009), price
elasticity was analyzed with hotels regarding price charge and impact on occupancy and
demand and optimizing hotel locations. This study intends to show that occupancy impacts
RevPAR, and the research by Enz et al. (2009) supports the same.
In a study conducted by Russo (1991), a hotel’s revenue picture is created from: (1)
pricing decisions for each room and room type, and (2) changes to occupied rooms. If the
equation for RevPAR is: RevPAR = Total Rooms Revenue / Total Available Rooms, the more
hotel rooms that are sold, the greater the revenue captured, the higher the RevPAR. In simple
terms, calculated:
• If 10 rooms of a 10-room hotel are sold at $100 room rate, this equals $1,000 in revenue
collected and RevPAR of $100.
• If 5 rooms are sold at that same 10-room hotel for $100, that is $500 in revenue collected
and RevPAR of $50.
Every room sold generates revenue for a hotel and increases the RevPAR when all
variables are held constant, and no complexities of revenue management are introduced. The
connection between financial performance and occupancy is complex, but multiple studies have
shown there is a relationship between profits and occupancy (Russo, 1991). Therefore, average
daily rate, hotel occupancy, and RevPAR are all important factors when understanding how
market share (RPI) is impacted. This study proves that not only does this relationship exist, but it
is important in organizational performance for both the franchisor and franchisee.
II.5 Importance of RevPAR
Perhaps the single most important measured variable in the industry is Revenue per
Figure 4 Focus on Importance of RevPAR
This Subsection
Quality
Assurance
Customer Satisfaction: Experience and
Customer Recommendation
Market Share (RPI)
(and hotel occupancy)
Revenue per Available Room
(RevPAR)
RevPAR is a function of hotel
occupancy.
All aspects of the business, ranging from hotel managers to Wall Street, relying on
RevPAR as a performance measurement, including industry analysts that use this for stock prices
(Ismail et al., 2002). RevPAR is used to compare hotels, franchise brands, and portfolios in the
hotel industry and serves as a tool valued by hospitality executives for top-line financial
measures (O'Neill & Qu, 2006). The RevPAR calculation is derived from total revenue divided
by total available rooms:
RevPAR = Total Room Revenue / Total Available Rooms
This calculation is essentially a performance efficiency measurement that allows the
industry to measure how well hotels are selling rooms and optimizing the prices for those rooms
sold. RevPAR is used for understanding historical performance, hotel valuation, and even
incentives for hotel employees. While RevPAR is critical to measuring the hotel’s performance,
its limitation lies in the fact that it does not measure operating costs and may not provide a full
picture of the hotel’s profitability (e.g., fails to include revenue from sources other than room
as a franchisor performance indicator (Chen & Lin, 2013). Prior research suggested that RevPAR
does not predict a firm’s stock price. However, RevPAR has been used to understand market
segment variability with returns on investment (Ismail et al., 2002). Consistent with the
literature, RevPAR serves as a measurement for understanding property performance.
Consequently, the research arguments have been made that RevPAR measures both supply and
demand (Gallagher & Mansour, 2000) by allowing both the availability and consumption of
rooms to be measured against the revenue collected for those same rooms (average daily rate).
RevPAR serves as the dependent variable and proxy for royalty fees collected, as this variable is
a direct function of royalty fees.
II.6 Explaining the Experience with Quality and Customer Satisfaction
The relationship that exists between Quality; Customer Satisfaction: Experience,
Customer Recommendation; Market Share (RPI); and RevPAR creates a sequence of
relationships that explain how all the components fit together. These relationships are bound
together in a seemingly logical manner and can be explained through two theories: (1) the
Expectation Confirmation Theory, which articulates the guest relationship with each of the
variables in the study, and (2) the Agency Theory, which outlines the headwind and tailwind
forces that impact how the delivery of these variables is executed at the hotel level. Each of these
theories is intertwined with one another to explain why these variables ultimately drive
performance, generate RevPAR and profit for the organization, and increase royalty fees
collected by the franchisor.
II.7 Expectation Confirmation Theory
The Expectation Confirmation Theory (ECT) states that expectations and satisfaction
three components of the broader model relate to the hotel guest experience and explain how
RevPAR is the benefactor of meeting or exceeding customer expectations. From pre-booking to
on-property experience to post-stay rating, the purpose of this study is to articulate the
relationships within the customer experience.
In reviewing the literature associated with the theory and industry trends, there are a
handful of studies within the hotel industry related to customer satisfaction. Much of the research
looks at the Expectation Confirmation (Disconfirmation), SERVQUAL, and other social
cognitive theories as lenses for looking at customer satisfaction and employee satisfaction while
on the job, including retention.
Ferrer (2009) used Structural Equation Modeling in a horizontal study with
approximately 1,201 customers in different services, including some areas of hotels and
restaurants. The study used expectations and confirmation (disconfirmation) as a premise but did
not look at aggregate scores from multiple units. This study conducted by Ferrer (2009)
supported the importance that expectations have on influence and satisfaction. In a related study,
Ekinci, Dawes, and Massey (2008) used the antecedents defined by Oliver (1980) around
satisfaction and predictive expectations as lenses for the SERVQUAL Theory to better
understand customer behavior. In each of these studies, the outcome was that a customer’s
expectations and satisfaction predict future purchase behavior.
Additionally, Pizam and Milman (1993) wrote in their article about personal interviews
and questionnaires used to understand 181 travelers from the U.S. to Spain. In the study, some
factors were reviewed that included satisfaction and dissatisfaction. The purpose of the Pizam
and Milman (1993) study was to explain customer satisfaction and dissatisfaction, conducted
hotel industry. Moreover, the study by N. Torres and Kline (2013), From Customer Satisfaction
to Customer Delight, looked at seven hotels in the Midwest through letters written related to
customer experience. The study made a nod to the Expectation Confirmation Theory but only
looked at the customer feedback as a mechanism for understanding the theory within hotels and
the hospitality industry.
Each of these studies demonstrated the importance of the Expectation Confirmation
Theory within the industry, but each of these studies and many others published lacked empirical
support on a large scale over a longer time period at the unit level (hotel by hotel). This study
uses empirical data to support the Expectation Confirmation Theory in explaining how the hotel
experience drives revenue per available room.
II.7.1 Framework of the Expectation Confirmation Theory
At the core of customer behavior and satisfaction are: (1) expectation: preset expectation
of hotel products or services performed, (2) disconfirmation: experience will either outperform
or under-perform, and (3) satisfaction: post-purchase is a reflection of the match between
expectation and disconfirmation, (Table 3) (Oliver, 1980). While this does not include the
“attitudes” or ”intentions” that are resulting, this is a core aspect of customer consideration prior
Table 3 Expectation Confirmation Theory Definition (Oliver, 1980)
(1) Expectation (2) Disconfirmation (3) Satisfaction
The preset expectation of hotel products or services performed
Experience will either
outperform or under-perform.
Post-purchase is a reflection of the match between expectation and disconfirmation.
The resulting satisfaction translates into attitude and intentions. These three components
are essential to an understanding before elaborating on how this cycle works, as they are critical
to the measurements for analyzing these relationships.
II.7.2 Expectation
At the core of customer behavior is “expectation”—meeting or not meeting the
expectation is directly linked to satisfaction. Customer satisfaction occurs when the perception of
the product or service performance matches the initial expectation (Oliver, 1980). When looking
at the satisfaction or dissatisfaction of the customer, evaluation of the product or service by the
customer needs to be tempered by the information they have received and knowledge that this
impacts their expectations and resulting satisfaction (Spreng, MacKenzie, & Olshavsky, 1996).
It is important to note that satisfaction needs to be differentiated between individual
attributes and overall satisfaction—meaning that the parts or individual attributes are not the
same as being satisfied with the whole or overall satisfaction (Spreng et al., 1996). Within the
guest experience at a hotel, each aspect of the hotel experience builds on one another; this overall
guest experience contributes toward the bigger picture with regard to service, arrival, staff,
product, and quality assurance (e.g., standards and cleanliness). Both anticipated characteristics
“an expectancy disaffirmed [disconfirmation] will be a source of psychological tension that will
lead a person to reject or dislike the unexpected event [Satisfaction]” (Weaver & Brickman,
1974).
From an expectations perspective, Spreng et al. (1996) highlighted the consumer’s
assessment of expectations and drew a comparison to “expectation congruency.” This is the
comparison of actual performance to expectation, similar to the ratio noted by Oliver (1980). The
simple fact that customers’ perceptions drive customer satisfaction weighs heavily on how
customers perceive a product. When looking at the context of Spreng et al. (1996) and this
perspective on brand strength, there is a direct tie to the importance of customer perception. In
this study, the measurement of brand strength comes to light in the form of consumer perception
of the brand as measured by a third party.
Both pre-purchase and pre-adoption expectations are the foundation for which the
product or service is judged by the consumer (Oliver, 1980). Satisfaction comes in two forms in
the customer’s eyes: (1) the product or service itself, and (2) the information the customer
receives to set the expectation (Spreng et al., 1996). In the light of hotel performance, brand
strength impacts the perceived performance and sets the tone for the actual experience.
Therefore, consistency at the hotel is critical to expectations. And any marketing promises or
brand image promises serve to reinforce expectations. From expectations and performance
perspective, the literature does not have a clear-cut model of what should happen. Parasuraman,
Zeithaml, and Berry (1988) suggested that the should aspect of the expectations is based on
Quality Assurance scores measure hotel delivery and execution, which
are set by the brand. The customer's expectations are moderated by
Brand Signaling. At the hotel, Quality Assurance scores measure
compliance with Brand Standards, Cleanliness, and Condition of the
asset. Quality Assurance audits are conducted at all hotels. Therefore,
this score is a measurement of what the customer or guest, in this case,
expects.
II.7.3 Disconfirmation
Disconfirmation is the evaluation (or judgment) that a customer makes on a product or
service during the experience. And confirmation is essentially the midpoint on the continuum of
disconfirmation—not unfavorable, but not favorable (Oliver, 1977).
Table 4 Positive and Negative Disconfirmation (Oliver, 1977)
Positive Disconfirmation Negative Disconfirmation
The outperformance of consumer’s expectation
resulting in “increased purchase or
post-adoption satisfaction.”
The under-performance of consumer’s
expectation resulting in “decreased
post-purchase or post-adoption satisfaction” or
increased dissatisfaction.
This process of evaluating the product or service to the customer’s original experience is
of the customer and the disconfirmation experienced are necessary to fully understand the
post-exposure evaluation that is made (Oliver, 1977). This is best explained as the attitude of the
customer that is revised or changed based on expectation and disconfirmation.
Upon experiencing the product or service, the customer alters their position and changes
expectation based on the disconfirmation. Therefore, according to Oliver (1977) and the basis of
the theory, positive disconfirmation is a result of the disconfirmation exceeding the initial
position, which results in post-purchase or post-adoption satisfaction. An important notation
related to customers’ experiences is that they can still, ”feel they have better than expected
performance (e.g., whiter than white),” even when they enter into situations where their
expectations are high (Oliver, 1977). Within hotel performance, there is a degree of loyalty and
experience the customers may receive that draws them to return to specific locations. Whether
this is service or culture related, the fact of the matter is that locations that outperform others still
exceed customer expectations time and time again. This cross section of loyalty and driving
occupancy with return visits is where those hotels that meet customer needs excel and
outperform other locations.
According to Tajefl (1978), satisfaction is both cognitive and emotional—there is rarely
neutrality of this categorization. Within our pre-evaluation criteria, already known are the ”things
we like” and the ”things that we don’t like,” which form our perspectives on satisfaction when
we make an evaluation of the product or service (Tajefl, 1978).
Customer Survey questions of Overall Experience and Problem Free
measurement comes from customer survey results and guest complaints
made to a centralized desk.
II.7.4 Satisfaction
Satisfaction is a combination of expectation of the product or service and the disconfirmation experienced,
meaning that once the customer experiences the product or service, they are able to form
disconfirmation—"did this meet my expectations or not.” In this sequence, satisfaction is measured by the customer
at the point of experience.
Satisfaction can be determined by subjective (e.g., customer needs and emotions) and
objective factors (e.g., product and service features) (Holjevac, Marković, & Raspor,
2009).
Continuing with the literature on satisfaction and the theory, suggestions were made,
mainly by Helson with concepts supported by Oliver, “…the adoption phenomena [consists of]
(1) the product itself including one's prior experience, brand connotations, and symbolic
elements, (2) the context including the content of communications from salespeople and social
referents, and (3) individual characteristics including persuasibility and perceptual distortion”
will influence post-purchase and post-adoption (Helson, 1964). This supports the fact that the
customer’s satisfaction is a result of combining the expectation of product or service and the
resulting disconfirmation and/or confirmation. Moreover, since the expectation and
disconfirmation occur at different points in time, they are weakened naturally, or the effect is
First, the product usage experience itself may serve to interfere with the retention of
expectation levels and, if usage takes place over a period of time, the time interval may
enhance forgetting. Second, because aroused disconfirmation is in closer temporal
proximity to the post-exposure evaluation, its effect may be greater than that of expectation
(Oliver, 1977).
From Oliver (1980), the model of antecedents and consequence of satisfaction flow more
formally from a few areas—whether they are expectations, attitudes, and intention—this is all
rooted with the end decision in mind. The article discussed attitude and intentions below but
related to the hotel industry, satisfaction with the experience comes to life through the customer
(guest) experience. Coupled with attitude and intention, this impacts decision-making with a
choice of location, which further adds depth to understanding brand strength and consistency.
With relationship to Weaver and Brickman (1974), when expected positive experiences
are met with individuals with overall high expectancies, individuals are more satisfied. With
repeated instances of disconfirmation, the outcomes detract from the satisfaction of the
individual. The literature further elaborated that many studies have shown that customer
satisfaction has both direct and indirect impact on business performance and profitability
(Anderson et al., 1994; Yeung et al., 2002).
According to these findings, customer satisfaction increases customer loyalty, influences
repurchase intentions and leads to positive word-of-mouth [or recommendations]
When looking for products and services outlined in the Expectation Confirmation
Theory, a noteworthy clarification by Ekinci and Riley (1998) was made around satisfaction.
Related to experience, the subjectivity of the intangibility of services (how customers are treated)
is greater than that of physical products (Ekinci & Riley, 1998). Therefore, the product or asset
is the hotel, and the service that customers experience can be viewed differently. Looking at the
survey data around customer satisfaction is critical in understanding the relationship between
those questions related to the product itself and those related to the experience or intangible
aspects.
Customer Survey questions on Helpfulness of the Hotel Staff, Intent to
Return, Value for Price Paid, and Recommend Hotel are considered
determinates of post-purchase adoption or repurchase.
II.7.5 Attitude and Intention
Product and service perception create attitudes toward post-purchase and approval. Much
of the literature concludes that “expectations are paired with disparate performance,” whereas
others view this, “as a comparative process culminating in an immediate satisfaction decision”
(Oliver, 1980). Regardless, the perception and behavior of the customer are a direct result of the
comparison and perceived satisfaction. This comparison of assessment between the expectations
and performance is subjective in nature but ideally needs to result in expectation agreement
These outcomes impact both post-purchase and adoption behaviors by the customer
based on whether the service (or product) meets or does not meet the customer’s expectations (or
disconfirmation). Moreover, “most investigators have emphasized the comparison between
unexpected success and expected failure and have construed the disconfirmation effect as
requiring that subjects prefer an expected failure to an unexpected success” (Weaver &
Brickman, 1974). Expectations impact pre-purchase or pre-adoption perceived performance.
Ultimately, the Attitude and Intention are measured by Market Share
(RPI) captured by the hotel. However, reference Section 2.7.4 for alignment
with Helpfulness of the Hotel Staff, Intent to Return, Value for Price Paid,
and Recommend Hotel for Satisfaction for Attitude and Intention.
II.7.6 The Expectation Confirmation Theory–related to Hotel Guests
The hotel industry is built on the platform of hospitality and customer experience. Every
aspect of a guest stay is based on a combination of human interactions and the product offering
(furniture, fixtures, and equipment) that make up the brand requirements. As customers’ progress
through the experience, these determinations of meeting expectations, obtaining satisfaction,
resulting in attitudes and intention (from before and after experience) impact intent to return and
repurchase. More importantly, how each of these aspects unfolds also impacts brand perception
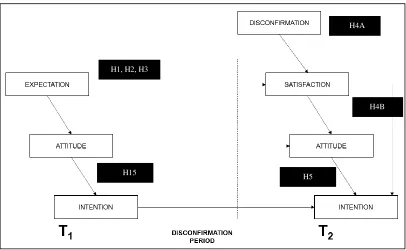
(or strength) and hotel performance. This cycle closely follows the diagram from Oliver (1980),
Figure 5 A Cognitive Model of the Antecedents and Consequences of Satisfaction Decisions (Oliver, 1980)
From the diagram and for hotels, expectations are either met or not met (Table 5). This
translates to attitude and intent to purchase in Time (1) versus Time (2). The navigation as
explained in common terms is as follows: H1, H2, H3
H15
H4A
H5
Table 5 Explanation of Resulting Intention to Purchase (Oliver, 1980)
The Theory The Translation
When you attempt to purchase a product or service initially, you have a preset “attitude” of how you think the service or product will
perform. Your “attitude” is a function of your “expectation,” meaning what you expected will determine your “attitude.”
You think you know how the product and service will perform; that’s your “attitude.”
Time 1 Attitude (t1) = f (expectation)
Your “satisfaction” is based on if your “expectation” was “disconfirmed (or confirmed)”—meaning did the product or service meet your “expectation.”
Whether you are
“satisfied” is based on if the experience met your “expectations.”
Satisfaction = f (expectation, disconfirmation)
During the next purchase, your “attitude” will be a function of the
“expectations” from Time 1. Your “attitude” for repurchase the second
time will be based on the combination of “attitude” and “satisfaction” from Time 1 or your first purchase.
The next time you
purchase the product
and service, your
attitude is based on the “expectation” from the first purchase and if you were satisfied.
Time 2 Attitude (t2) = f (attitude (t1), satisfaction)
Your future “intention” is based on the “attitude” from Time 1 which
merges with your “satisfaction” and “attitude” from Time 2.
If you’re happy with the purchase the first time, then you’ll have
“intention” to purchase again.
Purchase Intent
Intention (t1) = f (attitude (t1))
Intention (t2) = f (intention (t1), satisfaction, attitude
(t2))
For hotels, this is of paramount importance, as demand generators (industry term for new
areas. When looking at satisfaction and its relationship to expectation levels, consideration needs
to be made around time. As time passes, there are higher levels of “forgetting” (Oliver, 1977).
For customer survey results, this means that acquisition of sentiment about the stay is imperative
near the time of occupancy and, more importantly, feelings of the experience change based on
the time between hotel stays.
Additionally, customers’ understanding of what they should expect and resulting
intentions in the future are impacted by both marketings of the brand and customers’ perceived
understanding of the brand, and the product itself. In the franchise community of hospitality,
variation from location to location can have a significant impact on trust in the brand by the
customer. One area that must be introduced to the equation is the concept of customer distrust.
Distrust is based on the misalignment of marketing to and communications with the customer
about the product and the actual experience. Distrust in hotels is important because the majority
of hotels are franchised, meaning that the operator of the hotel is not the same entity as the brand.
The brand or franchisor relies on the franchisee to deliver the brand tenants to the customer.
When there is a deviation from the standards or expectations set by the brand, trust issues can be
created with the customer—especially when experience differs between hotels. The franchisor
and franchisee relationship can be explained by the Agency Theory, which complements
Expectation Confirmation Theory in explaining how quality and customer satisfaction relate to
Table 6 Difference between the Expectation Confirmation Theory and the Agency Theory
Expectation Confirmation Theory Agency Theory
The customer has set the expectation, and after
they have experienced the service (or product),
the post-purchase decision is made.
Franchisors (or the brand) do not have
direct purview of the execution of the
standards, which can impact the customer
experience between hotels if the
franchisee shirks or free rides.
The relationship between the Expectation Confirmation Theory and the Agency Theory
creates the dynamic for how the guest experience occurs from hotel to hotel. Core to the
experience and relevant to Expectation Conformation Theory, it is noteworthy to reference how
the “distrust” component of the Expectation Confirmation Theory is an underlying factor related
to the Agency Theory.
II.7.7 Distrust: Implications on Perceived Performance and Satisfaction
Distrust is a misalignment of the customer’s perceptions of the product based on
marketing, advertising, or other means from which an individual form an opinion of experience
versus the actual experience with the product or service. From a customer perspective,
expectation and experience are continuous. When the aspect of outside influence enters the
equation (e.g., marketing and experience at another location that varies), the concept of distrust