The Effect of Different Time Interval in
Micro-Waved Meat On the Meat Quality
1Sangosina, M.I*, 1Olorunsogbon, B.F. and 2Sanwo, K.A.
1Department of Agricultural Technology, The Federal Polytechnic Ilaro, Ogun State, Nigeria 2Department of Animal Production and Health, Federal University of Agriculture, Abeokuta, Nigeria.
DOI: 10.29322/IJSRP.9.11.2019.p95113
http://dx.doi.org/10.29322/IJSRP.9.11.2019.p95113
I. INTRODUCTION
eat is considered a source of high quality proteins. Meat is a very good source of animal protein that consists of essential amino acid, minerals, vitamins and essential fatty acids (Lawrie, 1991). Meat provides calories from fat, proteins and limited quantities of carbohydrate (Judge et al., 1990). Lean meat contains from 15 to 20% of protein, which varies inversely with percentage of fat. It is also one of the few foods which provide complete protein as well as being rich source of such essential nutrients as iron, niacin and vitamin B12 (Lawrie, 1991).
The major poultry meat quality attributes are appearance, texture, juiciness, flavour, and functionality. With increasing trends in further processing, meat functionality has increased in relative importance, especially because of its key role in determining the sensory quality of complex ready-to-eat products (Fletcher, 2002). A quality grade is a composite evaluation factors that affect palatability of meat (tenderness, juiciness, and flavour). These factors include carcass maturity, firmer, texture and colour of lean meat.
Cooking of meat is essential to achieve a palatable and safe product (Tornberg, 2005). There is very little Vitamin A and ascorbic acid in meat. (Mikkelsen et al., 1984). Lean meat from most animal carcass which consist of muscle, connective tissue, fat and bone and some 75% water in proportions depending on species, breeds, size, age, etc (Ainger, 1991). The muscle (lean meat) is relatively constant in composition in a given species and greatest variable in the carcass is the amount of fat which can range from 2% in some free-living animal to 15 - 40% in domesticated animals intensively reared. (Ramaswany, 1980). It will be noted that the lean meat of various species has similar values for micro nutrient and inorganic constituents. The same is true of the vitamins with the beef meat and chicken meat. (Reiter and Driskell, 1985). Method of cooking determines its compositional, processing determinants and sensory attributes especially appearance and colour and juiciness of the meat product. Some researchers have observed that microwave oven cooked meat products had lower moisture content than conventional oven cooking (Salama, 1993; Hoda et al., 2002). Nath et al., (1996) and Mendiratta et al. (1998) reported no moisture difference in microwave oven and conventional oven cooked chicken patties. Meats consist primarily of muscular tissues with the amount of fatty tissue varying not only with the breed, age, sex and diet of the animal but also anatomical location.
For example, heating temperatures have been shown to affect the texture of the beef muscle. (Herhon and Hulland. 1980).
II. MATERIALSANDMETHODS
The experiment was carried out at the animal products and Processing Laboratory of the Department of Animal Production And Health, College of Animal Science And Livestock Production, Federal University of Agriculture, Abeokuta.
Experimental Procedure
Broiler chickens and beef were purchased from a Commercial market, they were slaughtered and dressed and 1kg of each meat types was assigned to the three treatments cooking at 5, 10 and 15 minutes.
Table 1: The meat type and cooking intervals
Meat type Cooking time (minutes) Chicken meat (broiler) 5 10 15 Beef 5 10 15
Determination of Cooking (Microwave) Losses
Each sample was into sizeable portion, weighed and then microwave at about 900wd for 5, 10, and 15 minutes. Cooking losses were then calculated using the formula below.
Cooking loss (g) ═ Weight of samples before cooking (g) – weight after cooking (g)
Cooking Loss (%) ═ Weight of samples before cooking – weight after cooking × 100
Weight before cooking
Determination of Refrigerated Losses
Refrigerated weight losses were determined after the meat types have been microwaved at different time interval (initial weight). Then the microwave meat types were later refrigerated at 40c for 24 hours. Refrigerated weight loss was calculated using the
formula below:
Refrigerated weight loss (g) =Initial weight (g) - Final weight (g) Refrigerated weight loss (%) = Initial weight – Final weight × 100
Initial weight
International Journal of Scientific and Research Publications, Volume 9, Issue 11, November 2019 832 ISSN 2250-3153
http://dx.doi.org/10.29322/IJSRP.9.11.2019.p95113 www.ijsrp.org
Proximate Analysis
Parameter that were evaluated for each meat types were moisture content, crude protein, crude fat, total ash, water , calcium (Ca), iron (Fe) that were determined for each meat types according to the method described by AOAC(1990).
Sensory Evaluation
Sensory evaluation of the microwave beef and chicken meat at different time intervals was carried out using ten trained taste panellist. Some of the meat qualities estimated include colour, juiciness, meaty flavour, tenderness, saltiness, overall flavour and overall acceptability. Bite size portions of the microwave beef and chicken meat weighing 10g each were served at room temperature to the trained panellists who awarded scores using a nine point hedonic scale as described by (Cross et al., 1986). Like extremely =9, like very much=8, moderately=7, like slightly=6, neither like nor dislike=5, dislike slightly=4, dislike moderately=3, dislike very much=2, and dislike extremely=1.
A preliminary briefing session was held and the panellists were told as follows: Water was served to them for rinsing of their mouth after scoring each sample. Samples were independent of one another.
Statistical Analysis
All the data generated was subjected to 2x3 Factorial Arrangement in Completely Randomised Design using the statistical package (SAS 2010), while difference between means was determined by Duncan Multiple Range Test (1995)
III. RESULTSANDDISCUSSION
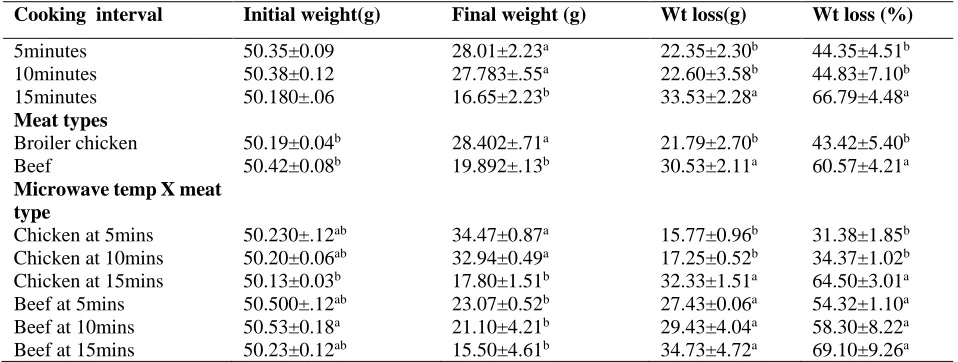
[image:2.612.67.546.333.514.2]Table 2 show the main and interactive effect of microwave weight loss of broiler chicken and beef meat microwave at different time interval. Considering the interactive effect, the weight loss was observed to be higher in beef than in chicken at the longest time microwave interval of 15 minutes this goes to show that chicken has a higher water holding capacity than beef. Which agree with the finding of (Ruiz et al., 2000). It was observed that the longer the micro-waved time, the higher the cook loss.
Table 2: Effect of microwave weight losses of chicken meat and beef
Cooking interval Initial weight(g) Final weight (g) Wt loss(g) Wt loss (%)
5minutes 50.35±0.09 28.01±2.23a 22.35±2.30b 44.35±4.51b
10minutes 50.38±0.12 27.783±.55a 22.60±3.58b 44.83±7.10b
15minutes 50.180±.06 16.65±2.23b 33.53±2.28a 66.79±4.48a Meat types
Broiler chicken 50.19±0.04b 28.402±.71a 21.79±2.70b 43.42±5.40b
Beef 50.42±0.08b 19.892±.13b 30.53±2.11a 60.57±4.21a Microwave temp X meat
type
Chicken at 5mins 50.230±.12ab 34.47±0.87a 15.77±0.96b 31.38±1.85b
Chicken at 10mins 50.20±0.06ab 32.94±0.49a 17.25±0.52b 34.37±1.02b
Chicken at 15mins 50.13±0.03b 17.80±1.51b 32.33±1.51a 64.50±3.01a
Beef at 5mins 50.500±.12ab 23.07±0.52b 27.43±0.06a 54.32±1.10a
Beef at 10mins 50.53±0.18a 21.10±4.21b 29.43±4.04a 58.30±8.22a
Beef at 15mins 50.23±0.12ab 15.50±4.61b 34.73±4.72a 69.10±9.26a
Mean along the same column with different superscript are significantly different (p<0.05) Table 3 Shows the main and interactive effect of weight loss
of chicken and beef meat microwave and refrigerated after 24hours shows no significant in gram and percentage. There was significant different on final weight. Which agree with the findings
of (Whiting et al., 1987). This is as a result of increase in water losses maybe be due to incorrect water gelling.
Table 3: Effect of refrigerated weight losses of micro-waved chicken and beef
Cooking interval Initial weight (g) Final weight (g) Weight loss Weight loss (%) 5minutes 28.01±2.23a 27.43±2.23a 0.58±0.20b 2.12±0.69b
10minutes 27.78±3.55a 26.09±3.52a 21.64±0.50ab 5.71±1.36ab
15minutes 16.65±2.23b 14.88±2.33b 2.51±0.83a 13.94±4.52a Meat type
Broiler chicken 28.40±2.71a 26.33±2.89a 2.07±0.60 8.32±3.00
Beef 19.89±2.13b 19.26±2.44b 1.08±0.38 6.19±2.52 Microwave temp X
meat type
[image:2.612.60.549.616.739.2]Chicken at10mins 32.94±0.49a 32.40±0.15ab 0.56±0.37 1.67±1.09
Chicken at 15mins 17.80±1.51b 14.78±0.06c 3.02±1.49 15.71±7.45
Beef at 5mins 23.07±0.52b 22.47±0.38bc 0.60±0.25 2.57±1.03
Beef at 10mins 21.10±4.21b 20.35±5.38c 0.65±0.26 3.83±2.11
Beef at 15mins 15.50±4.61b 14.97±5.22c 2.00±0.98 12.17±6.61
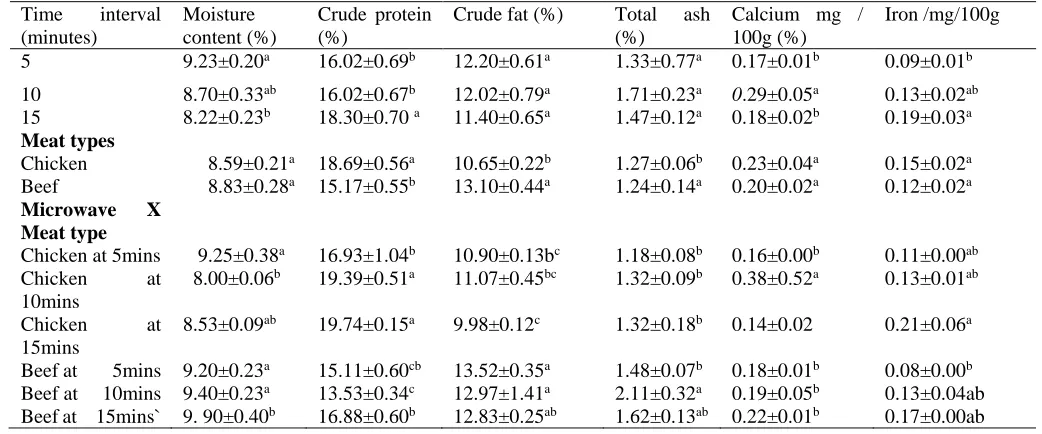
Mean along the same column with different superscript are significantly different (p<0.05) Table 4 shows the main and interactive effect of proximate
composition of broiler chicken and beef microwave at different time interval. For moisture content, crude fat, and total ash it was observed that beef was the highest at 15minutes (9.90) 12.83, 1.62, respectively. While chicken was the highest for crude protein and
[image:3.612.58.579.230.447.2]carbohydrate for 15 minutes (79.39) (0.33) which agrees with the findings of (wood et al. 2004) this content composition of meat are of major important for consumers due to important for meat quality and nutritional value
Table 4: Effect of proximate composition of chicken and beef meat microwave at different time.
Time interval (minutes)
Moisture content (%)
Crude protein (%)
Crude fat (%) Total ash (%)
Calcium mg / 100g (%)
Iron /mg/100g 5 9.23±0.20a 16.02±0.69b 12.20±0.61a 1.33±0.77a 0.17±0.01b 0.09±0.01b
10 8.70±0.33ab 16.02±0.67b 12.02±0.79a 1.71±0.23a 0.29±0.05a 0.13±0.02ab
15 8.22±0.23b 18.30±0.70 a 11.40±0.65a 1.47±0.12a 0.18±0.02b 0.19±0.03a Meat types
Chicken 8.59±0.21a 18.69±0.56a 10.65±0.22b 1.27±0.06b 0.23±0.04a 0.15±0.02a
Beef 8.83±0.28a 15.17±0.55b 13.10±0.44a 1.24±0.14a 0.20±0.02a 0.12±0.02a
Microwave X
Meat type
Chicken at 5mins 9.25±0.38a 16.93±1.04b 10.90±0.13bc 1.18±0.08b 0.16±0.00b 0.11±0.00ab
Chicken at 10mins
8.00±0.06b 19.39±0.51a 11.07±0.45bc 1.32±0.09b 0.38±0.52a 0.13±0.01ab
Chicken at 15mins
8.53±0.09ab 19.74±0.15a 9.98±0.12c 1.32±0.18b 0.14±0.02 0.21±0.06a
Beef at 5mins 9.20±0.23a 15.11±0.60cb 13.52±0.35a 1.48±0.07b 0.18±0.01b 0.08±0.00b
Beef at 10mins 9.40±0.23a 13.53±0.34c 12.97±1.41a 2.11±0.32a 0.19±0.05b 0.13±0.04ab
Beef at 15mins` 9. 90±0.40b 16.88±0.60b 12.83±0.25ab 1.62±0.13ab 0.22±0.01b 0.17±0.00ab
Table 5 shows significant (p<0.05) different for main and interactive effect of some sensory properties of broiler chicken and beef meat microwaved at different time interval, the interactive effect of microwave and meat type on colour show that chicken microwaved at 15minutes was scored 6.27 being like slightly while beef at 15minutes was scored 5.70 being intermediate. Juiciness for chicken and beef meat at 10minutes was 6.10 and 4.70 slightly juicy and slightly dry respectively, while at 15minutes was slightly dry. Flavour for chicken at 15 minutes was scored 6.23 being slightly meaty while beef was scored the lowest at 10minutes for 5.03 being intermediate. Tenderness for chicken
[image:3.612.37.576.616.723.2]at 10 minutes was scored 6.40 being slightly tender while beef was scored the lowest at 15 minutes for 3.77 being moderately tough. This agreed with the findings of Obuz et al (2003) that the effect of heating rate on the tenderness of meat is greatly influenced by muscle type. The overall flavour for chicken was the highest at 15minutes for 6.50 which were slightly desirable than beef at 5minutes of the lowest of 5.33 intermediate. The overall acceptability for chicken was scored highest of 6.50 at 15minutes like slightly to beef at 10 minutes for 5.30 which was intermediate.
Table 5: Effect of sensory properties of broiler chicken and beef meat micro-waved at different time interval
Time interval
Colour Juiciness Flavour Tenderness Saltiness Overall Flavour
Overall Acceptability 5 Minutes 5.42±0.25 4.98±0.24 5.80±0.34 5.33±0.41ab 5.0±0.20 5.7±0.26 5.82±0.33
10 Minutes 5.40±0.18 5.40±0.37 5.45±0.37 5.80±0.36a 5.10±0.21 5.65±0.23 5.77±0.31
15 Minutes 5.98±0.24 4.50±0.40 5.83±0.25 4.35±0.43b 4.93±0.26 6.13±0.26 6.23±0.29 Meat types
Chicken 5.71±0.25 5.29±0.30 5.96±0.13 5.54±0.33 5.03±0.15 6.16±0.24a 6.24±0.30
International Journal of Scientific and Research Publications, Volume 9, Issue 11, November 2019 834 ISSN 2250-3153
http://dx.doi.org/10.29322/IJSRP.9.11.2019.p95113 www.ijsrp.org
Microwave Interval X Meat types
Chicken at 5 5.13±0.47b 5.0±0.50ab 5.77±0.68 5.30±0.53ab 4.80±0.26 6.07±0.43ab 6.0±0.68
Chicken at 10
5.73±0.07ab 6.10±0.38a 5.87±0.70 6.40±0.45a 5.07±0.32 5.90±0.44ab 6.23±0.41
Chicken at 15
6.27±0.43a 4.77±0.43ab 6.23±0.38 4.93±0.49ab 5.23±0.24 6.50±0.46a 6.50±0.61
Beef at 5 5.70±0.10ab 4.97±0.20ab 5.83±0.33 5.37±0.74ab 5.20±0.31 5.33±0.09b 5.63±0.23
Beef at 10 5.07±0.23b 4.70±0.21ab 5.03±0.18 5.20±0.31ab 5.13±0.35 5.40±0.10b 5.30±0.25
Beef at 15 5.70±0.12 4.23±0.75b 5.43±0.12 3.77±0.57b 4.63±0.45 5.77±0.03ab 6.13±0.18
Mean along the same column with different superscript are significantly different (p<0.05)
IV. CONCLUSIONANDRECOMMENDATION The higher the microwave time the more the percentage cooking weight losses of broiler chicken and beef meat. Cooking time of meat types in microwaves had little or no effect on crude protein content. Crude fat was more affected by cooking time in beef and independent in chicken meat, while mineral content in the meat types were independent of cooking time in microwaves.
Recommendation
Since cooking time in microwaves has little or no effect on nutrient composition in both meat types, it is therefore, recommended that beef and chicken meat can be cooked in microwaves up till 15 minutes
REFERENCES
[1] Association of Official Analytical Chemists (AOAC).1990. Official Methods of Analysis of AOAC International, 17th ed.; AOAC International: Gaithersburg, MD, USA.
[2] Ainger, S. 1991 Hybrid deer- basis for New Animal. The Gazett, University of Sydney, Vol.19, No.1
[3] Cross, H.R., P.R. Durland, and S.C. Seideman, 1986. Sensory qualities of meat. Pages 279-320 in: Muscle As Food. P.J. Bechtel, ed. Academic Press, New York, NY.
[4] Fletcher, D.L., 2002. Poultry meat quality. World’s poult. Sci. J. 58; 131-145. [5] Herhon, A.C. and E D. Hulland, 1980. Canned Foods,Thermal Processing
and Microbiology. Churchhill,Living Stone.pp. 235-261.
[6] Hoda, I, Ahmad, S, and Srivastava, P. K. 2002. Effect of microwave oven processing, hot air oven cooking, curing and polyphosphate treatment on physico-chemical, sensory and textural characteristics of buffalo meat products, Journal of Food Science and Technology 39(3): 240-245. [7] Judge, M. E., Aberte, E, Forrest, J, Hedrick, H and Market, R. 1990.
Principles of Meat Science 2nd edition. Kedall/ Hunt, Iowa
[8] Lawrie, R. A. 1991. Meat science, 5th edition, Pergamon Press Ltd. Heading Ton Hill Hall, Oxford.
[9] Mendiratta, S. K., Kumar, S., Keshri, R. C. & Sharma, B. D. 1998. Comparative efficacy of microwave oven for cooking of chicken meat, Fleischwirtschaft 78(7): 827-8293-706 echnology 40(6): 94
[10] Mikkelsen, K.,Rasmussen, E.L and Zinck, O.1984. Retention of vitamin B1,B2 and B6 in frozen meat. In Thermal processing and Quality of Foods .Elsevier Applied Science. Pp.777-781
[11] Nath, R. L., C. M. Mahapatra, N. Kondaiah and J. N. Singh. 1996. Quality of chicken patties as influenced by microwave and conventional oven cooking. J. Food Sci. Technol. 33:162-164.
[12] Obuz, E., Dikeman, M.E., and Loughin, T.M., 2003.Effects of cooking method, reheating, holding time and holding temperature on beef longissimus lumborum and biceps femoris tenderness, Meat Science, 65, 841-851. [13] Ramaswamy, N. 1980 Report of Draft Animal Power as a source of
Renewable Energy. FAO, Rome. Pp. 78-79.
[14] Reiter, L.A and Driskell, J. A.1985 Vitamin B6 content of selected foods served in dining halls.J.Amer.Dietet.Assoc. vol 85.pp.16-25
[15] Ruiz, J.A., Perez-Vendrell, A.M. and Esteven-Garcia, E. 2000. Effect of dietary iron and copper on performance and exudative stability in broiler leg
meat. Isr. Poult. Sci. 41; 163-167. [16] Salama, N. A. 1993. Evaluation of two cooking methods and precooking
treatments on characteristics of chicken breast and leg. Grasas-y-Aceites 44:25-29
[17] SAS Institute Inc. 2010. SAS/STAT program. SAS Institute International, Cary, NC.
[18] Tornberg, E. 2005. Effects of heat on meat proteins—Implications on structure and quality of meat products. Meat Science, 70(3), 493–508. [19] Whitting, G.R, Strange, E.D. Cronlund, A.L, and Miller, A.J. 1987. Effect of
connective tissues on the sensory textural scores and shear forces of restructured beef steak in proceedings on 33rd international congress of meat science and technology. European meeting of meat research work, vol.2.helsinki, finlandia
[20] Wood, J.D, Richardson, R.I., Nute, G.R, Fisher, A.V, Campo, M.M and Kasapidou, E. 2004. Effect of fatty acid on meat quality. A review meat science 66(1) 21-32
AUTHORS
First Author – Sangosina, M.I, Department of Agricultural
Technology, The Federal Polytechnic Ilaro, Ogun State, Nigeria
Second Author – Olorunsogbon, B.F, Department of
Agricultural Technology, The Federal Polytechnic Ilaro, Ogun State, Nigeria
Third Author – Sanwo, K.A.,Department of Animal Production