BIROn - Birkbeck Institutional Research Online
Fugard, Andrew J.B. and Potts, H.W.W. (2015) Supporting thinking on
sample sizes for thematic analyses: a quantitative tool. International Journal
of Social Research Methodology 18 (6), pp. 669-684. ISSN 1364-5579.
Downloaded from:
Usage Guidelines:
Please refer to usage guidelines at or alternatively
Full Terms & Conditions of access and use can be found at
https://www.tandfonline.com/action/journalInformation?journalCode=tsrm20
International Journal of Social Research Methodology
ISSN: 1364-5579 (Print) 1464-5300 (Online) Journal homepage: https://www.tandfonline.com/loi/tsrm20
Supporting thinking on sample sizes for thematic
analyses: a quantitative tool
Andrew J.B. Fugard & Henry W.W. Potts
To cite this article: Andrew J.B. Fugard & Henry W.W. Potts (2015) Supporting thinking on sample sizes for thematic analyses: a quantitative tool, International Journal of Social Research Methodology, 18:6, 669-684, DOI: 10.1080/13645579.2015.1005453
To link to this article: https://doi.org/10.1080/13645579.2015.1005453
© 2015 The Author(s). Published by Taylor & Francis
Published online: 10 Feb 2015.
Submit your article to this journal
Article views: 38947
View Crossmark data
Supporting thinking on sample sizes for thematic analyses: a
quantitative tool
Andrew J.B. Fugarda*and Henry W.W. Pottsb
aResearch Department of Clinical, Educational and Health Psychology, University College
London, 26 Bedford Way, London WC1H 0AP, UK;bInstitute of Health Informatics, University College London, 222 Euston Road, London NW1 2DA, UK
(Received 14 June 2014; accepted 8 October 2014)
Thematic analysis is frequently used to analyse qualitative data in psychology, healthcare, social research and beyond. An important stage in planning a study is determining how large a sample size may be required, however current guide-lines for thematic analysis are varied, ranging from around 2 to over 400 and it is unclear how to choose a value from the space in between. Some guidance can also not be applied prospectively. This paper introduces a tool to help users think about what would be a useful sample size for their particular context when investigating patterns across participants. The calculation depends on (a) the expected population theme prevalence of the least prevalent theme, derived either from prior knowledge or based on the prevalence of the rarest themes con-sidered worth uncovering, e.g. 1 in 10, 1 in 100; (b) the number of desired instancesof the theme; and (c) the powerof the study. An adequately powered study will have a high likelihood of finding sufficient themes of the desired prevalence. This calculation can then be used alongside other considerations. We illustrate how to use the method to calculate sample size before starting a study and achieved power given a sample size, providing tables of answers and code for use in the free software, R. Sample sizes are comparable to those found in the literature, for example to have 80% power to detect two instances of a theme with 10% prevalence, 29 participants are required. Increasing power, increasing the number of instances or decreasing prevalence increases the sample size needed. We do not propose this as a ritualistic requirement for study design, but rather as a pragmatic supporting tool to help plan studies using thematic analysis.
Keywords:sample size determination; power analysis; thematic analysis
Thematic analysis is a qualitative method for uncovering a collection of themes,
‘some level of patterned response or meaning’(Braun & Clarke,2006, p. 82) within a data-set. It goes beyond word or phrase counting to analyses involving‘identifying and describing both implicit and explicit ideas’(Guest, MacQueen, & Namey, 2012, p. 10). Themes tend to emerge when answering the question, ‘What is this expres-sion an example of?’ (Ryan & Bernard, 2003, p. 87). Thematic analyses are widely used in psychology, healthcare research, social research and beyond. Topics addressed are diverse, including understanding experiences, understandings, percep-tions, practices, and causal factors underlying phenomena (Braun & Clarke, 2013,
*Corresponding author. Email:[email protected]
© 2015 The Author(s). Published by Taylor & Francis.
pp. 44–55). This paper tackles the question of how large a sample is sufficient to uncover all themes of interest and provides a partial solution that can be combined with other considerations.
Being able to plan ahead with an estimate of numbers required is of great practi-cal value in carrying out research, in grant proposals or when seeking ethipracti-cal review (Guest, Bunce, & Johnson, 2006). Indeed, good research practice and governance, including public engagement, requires researchers to explain what they plan to do before they do it, and why.
We do not presume to provide a final context-free formula for sample size that we think all researchers must use. Rather, we offer a tool that we believe can assist thinking and contribute to the already lively debate around sample size.
For quantitative studies, sample size may be calculated using a power analysis from a chosen probability of finding a statistically significant result (power) for a given population effect magnitude (Cohen, 1988) and such calculations are now commonplace. Such calculations are context-dependent and part of a subjective process (Schulz & Grimes,2005; Spiegelhalter & Freedman,1986; Whitley & Ball,
2002), even if reviewers sometimes expect more precision in them than is feasible (Bacchetti,2002). For instance, a well-controlled lab-based study would be expected to show larger differences between conditions than a complex social intervention and so will require a smaller sample size. Guidelines on interpretations of effect magnitude – and hence sample size – are domain specific and differ between, for instance, educational attainment (Hattie, 2009), memory research (Morris & Fritz,
2013), and social psychology (Richard, Bond, & Stokes-Zoota, 2003). Although a rich toolbox of mathematics is available to guide sample size determination, other factors are important such as ethical concerns, practical matters such as the availabil-ity of participants and other resources such as researcher time, whether the study is a pilot or a confirmatory study, and also the particular research question (Barker, Pistrang, & Elliot, 2002; Cocks & Torgerson, 2013). ‘N of 1’ quantitative studies are also run, for instance in psychotherapy research (Borckardt et al., 2008) so
‘quantitative’ need not imply ‘large sample’, although the questions answered by a single case study are different to those answered by a large scale probability sample. Qualitative studies are different to quantitative studies since they aim to map out the qualitatively different patterns observed in a data-set rather than to quantify mag-nitudes. Sandelowski (1995, p. 179) argued that ‘There are no computations or power analyses that can be done in qualitative research to determine a priori the minimum number […] of sampling units required’. The main goal, Sandelowski argues, is to ensure that the sample size is small enough to manage the material and large enough to provide ‘a new and richly textured understanding of experience’ (p. 183) and this is always a matter of subjective judgment, i.e. guided by researcher experience and assessing the data as it is analysed in relation to the goals of the research. However, prior work has sought to suggest numbers.
project (‘small’,‘medium’, or ‘large’). For small projects, 6–10 participants are rec-ommended for interviews, 2–4 for focus groups, 10–50 for participant-generated text and 10–100 for secondary sources. The upper range for large projects is‘400+’. It is unclear exactly how these numbers were arrived at, however justification alludes to having enough data to demonstrate patterns while ensuring there is not too much data to manage. An earlier review (Onwuegbuzie & Leech, 2007) of a range of rec-ommendations from the literature notes that the authors provide no clues for how they arrived at their estimates. There are virtually no guidelines in this area (Guest et al., 2006) and guidance to date has even been rejected as having ‘little if any value’(Emmel,2013, p. 146) as no evidence is given to justify the offered advice.
Another approach is to investigate empirically when no further themes are found, a state known as theoretical saturation (Glaser, 1965, pp. 441–443). Studies have reported saturation after as few as 6 interviews (e.g. Isman, Ekéus, & Berggren,
2013; Isman, Mahmoud Warsame, Johansson, Fried, & Berggren, 2013). Another study began with 10 interviews, developed themes, and then continued collecting data, plotting the cumulative additions of themes to enable the visualization of diminishing returns as few new themes were discovered (Francis et al.,2010). Guest et al. (2006) took an empirical approach using a set of 60 interviews and concluded that saturation occurred within 12 interviews, with broader themes apparent after merely 6, numbers much lower than some of the suggested estimates of numbers needed that they reviewed. They noted that factors such as heterogeneity of the sam-ple will affect how many interviews are required, but conclude that, ‘For most research enterprises […] in which the aim is to understand common perceptions and experiences among a group of relatively homogeneous individuals, twelve inter-views should suffice’ (Guest et al., 2006, p. 79). A similar approach by Francis et al. (2010) found a higher number of 17. Other studies have reported saturation only after much larger numbers, e.g. 63 (Wright, Maloney, & Feblowitz,2011). One problem with this empirical approach is that it does not provide a straightforward prediction for when to stop; for any given study, the saturation point may vary, making planning difficult. Also it seems true that ‘each life is unique, no data are ever truly saturated’(Wray, Markovic, & Manderson, 2007, p. 1400). One needs to decide how detailed the analysis should be.
The present paper offers a quantitative tool to inform sample size choices for the-matic analysis and related approaches, like content analysis and framework analysis, when used to identify qualitatively different patterns across a typically multiple-par-ticipant data-set. We do not consider the problem in other areas of qualitative research, like discourse analysis or narrative analysis, nor do we argue the model will be suitable for approaches like interpretive phenomenological analysis. As with all models, simplifying assumptions have been made. This model should only be used as part of a broader consideration of sample size taking into account other issues, such as the volume of material to be analysed from each participant and the case selection approach taken. It is hoped that formalizing a model helps progress research on sample size determination for qualitative studies.
qualitative studies (Lin, 1998). ‘Quantitative’ need not mean ‘objective’. Subjective approaches to statistics, for instance Bayesian approaches, assume that probabilities are mental constructions and do not exist independently of minds (De Finetti,1989). Statistical models are seen as inhabiting a theoretical world which is separate to the
‘real’ world though related to it in some way (Kass, 2011). Physics, often seen as the shining beacon of quantitative science, has important examples of qualitative demonstrations in its history that were crucial to the development of theory (Kuhn,
1961).
There has been a move in recent years towards research being more inclusive (Gorard & Taylor, 2004) and pluralist (Barker & Pistrang, 2005). New paradigms favour combining approaches, e.g. mixed methods research (Tashakkori & Teddlie, 2010), the realist approach (Pawson, 2006), and meta-narrative reviews (Greenhalgh, Potts, Wong, Bark, & Swinglehurst, 2009; Wong, Greenhalgh, Westhorp, Buckingham, & Pawson, 2013). In a spirit of pluralism and the belief that different epistemological perspectives can learn from each other, we offer this approach as a pragmatic tool that may help those planning studies using thematic analysis.
The proposed model
Let us assume a particular theme has a certain prevalence in the population of inter-est, for instance the general population, people referred for mental health care, or others. (We use the term ‘population of interest’ as a construct reflecting whatever sampling approach you take.) Given this, we can calculate how many participants are needed to be at least 80% sure (or some other number) of capturing the theme. We will talk about interviews as the commonest method where we see an application for this method, but the approach generalises to observations, the use of existing texts and so forth.
[image:6.493.119.378.456.622.2]Themes are complex and have a hierarchical nature. Suppose we are investigat-ing how people construct their idea of emotional wellbeinvestigat-ing. They may or may not describe something that a clinical psychologist would recognise as a disorder.
Perhaps what they describe may be seen as anxiety or depression, a particular type of depression (with interpersonal concerns or achievement concerns) or anxiety (specific phobia, social situations). See Figure 1 for a graphical depiction. What counts as a theme here?
The probability of anxiety specifically in social situations being mentioned is likely to be less than that of any kind of anxiety (more generally) being mentioned, which is in turn less than that of some clinical condition being mentioned. One might reject the notion of clinical disorder altogether and instead focus on emotions discussed, which will give a difference space of probabilities. With a fully inductive approach, one might refuse to have any expectations about the nature of the themes uncovered before the data have been collected.
To have any hope of developing a model to guide sample size choice, we will need to make simplifying assumptions. These assumptions are a starting point. Later, we will consider what happens when we relax them.
(1) If a theme is present in someone’s views, it will come out in their interview (or other material) and be apparent to the researcher. A theme either occurs or does not.
(2) Themes, or more precisely theme-relevant material such as collections of utterances which inspire themes, are independent of each other. This simplifies calculations and, at present, there is little information on likely correlations between themes.
(3) The depth analysed in theme hierarchies will be constrained by the number of times a theme-relevant event (an utterance, an action) has occurred and the number of similar themes discovered. For instance, if in a study of men-tal wellbeing with 10 participants, one person describes self-criticism and sadness and another being fearful in social situations, then it is likely there will be one theme for either ‘distress’ or ‘sadness/anxiety’ rather than the more specific themes, since it is likely there are other types of negative experience which could have been mentioned.
Sketch of the model
Suppose we are collecting qualitative data from a sequence of participants. We are interested in observing an event that we assume occurs with particular population theme prevalence across participants. Furthermore we would like to observe the theme in a given number of participants. Probability distributions may be used to answer questions like these. We chose the negative binomial probability distribution since this models how long one has to wait for a certain number of‘successes’when observing a sequence of events. Here‘success’means observing a theme. Using this distribution, and assuming random sampling from the population of interest, we can determine:
(1) Power: the probability of observing the desired number of instances of a particular theme, given the population theme prevalence and sample size. (2) Sample size: the number of participants required to be confident at a
Table 1shows the samples sizes required for 80% power, which is a level com-monly used in quantitative studies (Cohen,1992; Kraemer & Kupfer,2006; Senn & Bretz, 2007), and Table2for 90% power to discover themes with a range of values for population prevalence. Tables3 and4 show power for 1 and 5 theme instances, respectively. The Appendix 1 shows how to compute answers for arbitrary parameters using R, a free statistical program (R Core Team,2013).
Using the model
We will first explore the method via a hypothetical study investigating how people construct a concept of mental wellbeing, continuing the idea introduced above. This is more deductive than in typical thematic analyses as we use an external reference for theme prevalence: data for the prevalence of mental health diagnoses. However, the idea here is not simply to rediscover diagnoses but rather to use the prevalence data to get an idea of what is already known about the likelihood of a range of expe-riences. This serves to illustrate the approach. As we shall see later, the approach can also be used when relevant prevalence data are not available and in more inductive analyses.
Searching for themes with known population prevalence
[image:8.493.69.427.103.327.2]We use data from a study of over 2000 adults aged 18–29 which reports the percent-age who have ever experienced a disorder (according to a structured assessment) up to the time of interview (Kessler, Berglund, & Demler, 2005, p. 596). Different answers to estimated population theme prevalence may then be estimated. Suppose
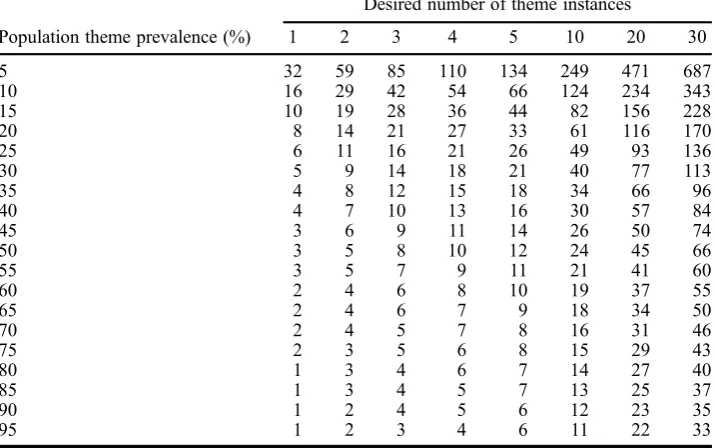
Table 1. Sample size required as a function of the population theme prevalence and how many instances of the theme are desired, with 80% chance of observing the desired number of instances (power).
Population theme prevalence (%)
Desired number of theme instances
1 2 3 4 5 10 20 30
5 32 59 85 110 134 249 471 687
10 16 29 42 54 66 124 234 343
15 10 19 28 36 44 82 156 228
20 8 14 21 27 33 61 116 170
25 6 11 16 21 26 49 93 136
30 5 9 14 18 21 40 77 113
35 4 8 12 15 18 34 66 96
40 4 7 10 13 16 30 57 84
45 3 6 9 11 14 26 50 74
50 3 5 8 10 12 24 45 66
55 3 5 7 9 11 21 41 60
60 2 4 6 8 10 19 37 55
65 2 4 6 7 9 18 34 50
70 2 4 5 7 8 16 31 46
75 2 3 5 6 8 15 29 43
80 1 3 4 6 7 14 27 40
85 1 3 4 5 7 13 25 37
90 1 2 4 5 6 12 23 35
we wish to ensure we have at least two examples for the least common theme and 80% power.
The overall prevalence of any disorder up to the time of interview was around 50%. So if we just want themes about any kind of disorder, then only three participants would be required.
One might be interested in themes concerning combinations of two diagnoses (‘comorbidity’), in which case the prevalence drops to 34% and four partici-pants would be required.
Or perhaps it is seen as important to have a chance of capturing themes related to the least likely subcategory in the anxiety disorders, which is ‘agoraphobia without panic’ with a prevalence of around 1%; now 161 participants would be required to have a good chance of sampling relevant experiences. Here one might decide to use purposive sampling (see Teddlie & Yu,2007), i.e. specifi -cally recruit participants with the relevant characteristics for instance by approaching a relevant mental health service or advertising through social media. The expected prevalence in this group would then be 100%. Then the power analysis may be run again tofind subthemeswithinthis group.
[image:9.493.71.426.104.328.2]The different diagnoses –even if the researcher is opposed to diagnostic catego-ries and diagnoses are never mentioned by participants –may be used as a guide to how many people with particular experiences are likely to be encountered. So for instance an underpowered study would be most likely to discover themes related to specific phobia and social phobia and perhaps miss out a range of important themes arising from experiences of the less common mental health conditions.
Table 2. Sample size required as a function of the population theme prevalence and how many instances of the theme are desired, with 90% chance of observing the desired number of instances (power).
Population theme prevalence (%)
Desired number of theme instances
1 2 3 4 5 10 20 30
5 45 77 105 132 158 282 515 740
10 22 38 52 65 78 140 256 368
15 15 25 34 43 52 93 170 244
20 11 18 25 32 38 69 126 182
25 9 15 20 25 30 55 100 145
30 7 12 16 21 25 45 83 120
35 6 10 14 18 21 38 71 102
40 5 9 12 15 18 33 61 89
45 4 8 10 13 16 29 54 79
50 4 7 9 12 14 26 48 70
55 3 6 8 11 13 23 44 63
60 3 5 7 9 11 21 40 58
65 3 5 7 9 10 19 36 53
70 2 4 6 8 9 18 33 49
75 2 4 6 7 9 16 31 45
80 2 4 5 6 8 15 28 42
85 2 3 5 6 7 14 26 39
90 1 3 4 5 7 13 24 36
There are also data on mental health problems which transcend the need for a categorical diagnosis. Community norms are available, for instance, for the Strengths and Difficulties Questionnaire (Goodman,2001; Goodman & Scott,1999) and could be used as a guide to the likelihood offinding participants with particular levels of distress. For example, around 20% of parents report that their children aged 11–15 experience some level of difficulties in relation to ‘emotions, concentration, behaviour or being able to get on with other people’. Therefore eight participants would be required to get some sense of the themes around having a child experienc-ing these difficulties in a sample of parents in general.
Setting a lower limit on theme prevalence
[image:10.493.69.431.85.430.2]It is a common problem in quantitative studies to be unsure about what effect size is likely to be found. Often a constraint is then what the smallest effect size worthfi nd-ing would be. Similar reasonnd-ing may be used for the present approach to qualitative power analysis. Do we want to be sure to find a theme which occurs in (e.g. is
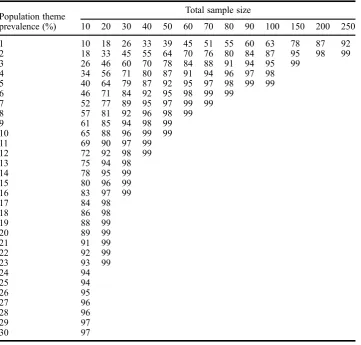
Table 3. Power to detect 1 theme instance, by population theme prevalence and sample size (omitted if 100% to nearest percent).
Population theme prevalence (%)
Total sample size
10 20 30 40 50 60 70 80 90 100 150 200 250 1 10 18 26 33 39 45 51 55 60 63 78 87 92 2 18 33 45 55 64 70 76 80 84 87 95 98 99 3 26 46 60 70 78 84 88 91 94 95 99
4 34 56 71 80 87 91 94 96 97 98 5 40 64 79 87 92 95 97 98 99 99 6 46 71 84 92 95 98 99 99
7 52 77 89 95 97 99 99 8 57 81 92 96 98 99 9 61 85 94 98 99 10 65 88 96 99 99 11 69 90 97 99 12 72 92 98 99
13 75 94 98
14 78 95 99
15 80 96 99
16 83 97 99
17 84 98
18 86 98
19 88 99
20 89 99
21 91 99
22 92 99
23 93 99
24 94
25 94
26 95
27 96
28 96
29 97
mentioned by, observed in the behaviour of ) 1 in 100 participants or would 1 in 10 suffice? Consider a study that is trying to uncover the themes that affect the majority of participants. A suitable lower threshold might then be 30% for theme prevalence. However if a study seeks to uncover as many themes as possible, then a lower threshold might be applied; for instance, one might decide that the study should have a good chance of uncovering themes which affect as few as 5% of the chosen population. Note that it is not necessary to know what the themes are beforehand to make a judgement as to the lowest theme prevalence that is of interest. One can make an estimate and thus determine a sample size while still retaining an entirely inductive approach to what themes may appear.
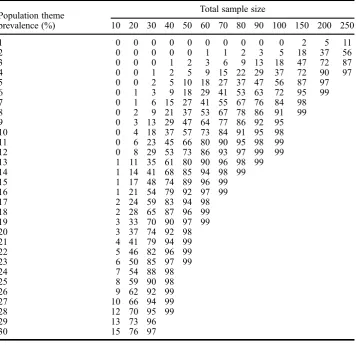
The number of instances can also be decided in this manner. Only one mention would be sufficient for many studies, however in order to aid the recognition of a theme, then at least two or three could be required. Repetition is one of the most common ways to recognise themes in data (Ryan & Bernard,2003).
[image:11.493.70.430.86.431.2]This decision-making process is not uniquely determined by a formula – as is also the case with power analysis for quantitative studies. The advantage is that the
Table 4. Power to detect 5 theme instances, by population theme prevalence and sample size (omitted if 100% to nearest percent).
Population theme prevalence (%)
Total sample size
10 20 30 40 50 60 70 80 90 100 150 200 250
1 0 0 0 0 0 0 0 0 0 0 2 5 11
2 0 0 0 0 0 1 1 2 3 5 18 37 56
3 0 0 0 1 2 3 6 9 13 18 47 72 87 4 0 0 1 2 5 9 15 22 29 37 72 90 97 5 0 0 2 5 10 18 27 37 47 56 87 97 6 0 1 3 9 18 29 41 53 63 72 95 99 7 0 1 6 15 27 41 55 67 76 84 98 8 0 2 9 21 37 53 67 78 86 91 99 9 0 3 13 29 47 64 77 86 92 95 10 0 4 18 37 57 73 84 91 95 98 11 0 6 23 45 66 80 90 95 98 99 12 0 8 29 53 73 86 93 97 99 99 13 1 11 35 61 80 90 96 98 99 14 1 14 41 68 85 94 98 99 15 1 17 48 74 89 96 99 16 1 21 54 79 92 97 99 17 2 24 59 83 94 98 18 2 28 65 87 96 99 19 3 33 70 90 97 99
20 3 37 74 92 98
21 4 41 79 94 99
22 5 46 82 96 99
23 6 50 85 97 99
24 7 54 88 98
25 8 59 90 98
26 9 62 92 99
27 10 66 94 99
28 12 70 95 99
29 13 73 96
consequences of different assumptions are made explicit and can then be considered and discussed by the research team, reviewers and other stakeholders.
Calculating achieved power
Another common question for quantitative studies is to determine the power a com-pleted study had tofind an effect of a particular magnitude, especially to get a sense of how likely it is that an effect has been missed. Something analogous can also be achieved for thematic analysis. Let’s take as an example a thematic analysis of the goals young people set for therapy in child and adolescent mental health services (Bradley, Murphy, Fugard, Nolas, & Law, 2013). Three major themes and 25 sub-themes were found in a sample size of 80 participants. Figure2shows the achieved power by prevalence and desired number of instances of each theme. The study had 80% power to discover at least one instance of themes with 2% population prevalence.
Relaxing assumptions
We developed this model based on a number of assumptions. We now consider what happens if we relax these assumptions. In assumption 1, we presumed that themes would be expressed and are obvious. However, if that is not the case, we can follow the same approach, but adjust the expected prevalence. For example, if a theme only has a 50% chance of being expressed by the participant and noticed by the researcher, then we can treat its prevalence as being half as much.
Themes are not necessarily independent, as we assumed in assumption 2. For instance, a study of experiences of mental health interventions is likely to uncover relationships between the difficulties participants experience and the type of
0.05 0.10 0.15 0.20 0.25
0.0
0.2
0.4
0.6
0.8
1.0
Prevalence
Power
[image:12.493.135.363.407.610.2]Instances 1 5 10 15
intervention. However, if a calculation is based on the least prevalent theme desired to be seen, dependence does not present a problem. We can be sure that we have sufficiently many participants so that at least one instance of the least common theme’s prevalence has been uncovered. Another way to think about this is that we have given at least one minority participant a voice. Allowing additional instances also increases the likelihood that more themes of the same prevalence are uncovered.
We also assumed (assumption 3) that theme hierarchies are constrained by the number of instances of a given theme uncovered in analysis. This assumption may be relaxed by increasing the role of theory when interpreting the material collected in the study. For example, participants’descriptions of mental health difficulties may reveal the use of emotion words which the researcher recognises as basic emotions or combinations of basic emotions (Oatley & Johnson-Laird, 1987; Power & Tarsia,
[image:13.493.84.421.61.408.2]2007). In this way, even given insufficiently many instances, a theory-guided (and justified) theme hierarchy may be constructed.
Summary and conclusions
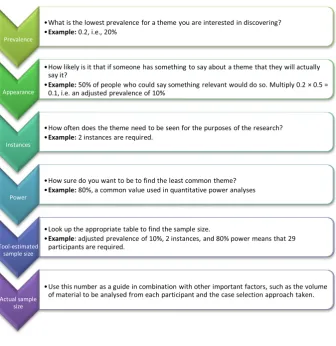
This paper proposed a simple quantitative approach to inform sample size choice for thematic analyses and related qualitative methods. The key parameters used to make the decision are the population theme prevalence for the least prevalent theme desired to be seen, adjusted, if necessary, by the likelihood that a theme will be expressed; the desired number of instances of this theme; and the power of the study, i.e. the probability of obtaining the desired number of instances for the least prevalent theme. The resulting answer may then be used to inform thefinal decision in combination with other sources of advice on sample size. This process is summarised in Figure3.
Existing proposals for sample size in thematic analysis rely on what sample sizes seem to have worked in the past and are limited in their ability to take account of the particular circumstances of a planned study. The concept of theoretical satura-tion, whereby collecting more data does not add further themes, is problematic for prospective study planning and also since new data will always bring more informa-tion. We have argued that a helpful perspective to take is that of how prevalent the themes are that one wants to uncover. We suggest it is intuitively obvious that a lar-ger sample is sensible if wanting to detect less commonly expressed themes, and that a larger sample is sensible if wanting to see a theme expressed more often in the data. We argue that the use of probability theory to understand those relation-ships should not trouble qualitative researchers. We note thefigures produced by our approach are consistent with the suggestions given in the prior literature, but our tool allows researchers to better explore their specific needs and context.
One limitation of the approach is that we have not attempted to address the effect of within-participant sampling. Intuitively a longer interview or repeated interviewing with someone makes it more likely they will produce more theme-relevant material.
We do not claim that this proposal completely determines the chosen sample size. We offer it as a tool to help explore choices and to support decision-making. Other factors such as the cost of data collection, transcription and depth of analysis are also important and are covered in detail elsewhere (e.g. Robinson,2014). These same caveats apply to power calculations for quantitative studies too, but are often ignored (Schulz & Grimes, 2005). Quantitative and qualitative researchers have warned how reviewers and readers can be dazzled by ‘the allure of the number n’
(Emmel, 2013, p. 146) and an apparently precise power calculation (Bacchetti,
2002). Quantitative power calculations can become ‘a ritualistic dance’ (Goodman & Berlin, 1994, p. 203). In proposing this tool to help qualitative researchers, we adamantly do not wish to import the same bad habits.
It is hoped that attempting to formalise the sampling problem for thematic analy-ses and related approaches is a useful step for future research, and thinking explicitly about the possible prevalence of themes will help support justifications for the sample sizes chosen.
Acknowledgements
Notes on contributors
Andrew JB Fugard is a social scientist and lecturer in the UCL Research Department of Clinical, Educational and Health Psychology. He has a background in computer science and psychology. His recent publications focus on understanding mental health interventions, e.g. analyses of national mental health service outcomes (2015, Child and Adolescent Mental Health) and using data from randomised controlled trials to simulate control groups for school counselling evaluations (2015, Counselling and Psychotherapy Research). Ongoing work uses mixed methods to explore reasons for variations in outcomes. He has also pub-lished research on the psychology of reasoning, e.g. using non-classical logics to model the goals people have when they reason (2014,Frontiers in Psychology).
Henry WW Potts is a senior lecturer in the UCL Institute of Health Informatics, with a back-ground in health psychology and statistics, but a broad interest in methods. Recent publica-tions encompass statistical approaches (Predicting length of stay from an electronic patient record system: A primary total knee replacement example, BMC Medical Informatics & Decision Making), qualitative approaches (Motivations for contributing to health-related arti-cles on Wikipedia: An interview study, Journal of Medical Internet Research) and beyond (Assessing the validity of prospective hazard analysis methods: A comparison of two tech-niques,BMC Health Services Research). He co-authored the second meta-narrative review to be published (Tensions and paradoxes in electronic patient record research: A systematic lit-erature review using the meta-narrative method,Milbank Quarterly), a method that explicitly addresses epistemological differences when reviewing the literature on a topic.
References
Bacchetti, P. (2002). Peer review of statistics in medical research: The other problem.British Medical Journal, 324, 1271–1273.
Baker, S. E., & Edwards, R. (2012). How many qualitative interviews is enough? Expert voices and early career reflections on sampling and cases in qualitative research. Retrieved fromhttp://eprints.ncrm.ac.uk/2273/
Barker, C., & Pistrang, N. (2005). Quality criteria under methodological pluralism: Implications for conducting and evaluating research. American Journal of Community Psychology, 35, 201–212. doi:10.1007/s10464-005-3398-y
Barker, C., Pistrang, N., & Elliot, R. (2002). Research methods in clinical psychology
(2nd ed.). Chicester: Wiley.
Borckardt, J. J., Nash, M. R., Murphy, M. D., Moore, M., Shaw, D., & O’Neil, P. (2008). Clinical practice as natural laboratory for psychotherapy research: A guide to case-based time-series analysis.American Psychologist, 63, 77–95. doi:10.1037/0003-066X.63.2.77
Bradley, J., Murphy, S., Fugard, A. J. B., Nolas, S., & Law, D. (2013). What kind of goals do children and young people set for themselves in therapy? Developing a goals framework using CORC data.Child & Family Clinical Psychology Review, 1, 8–18. Braun, V., & Clarke, V. (2006). Using thematic analysis in psychology.Qualitative Research
in Psychology, 3, 77–101.
Braun, V., & Clarke, V. (2013). Successful qualitative research: A practical guide for beginners. London: Sage.
Cocks, K., & Torgerson, D. J. (2013). Sample size calculations for pilot randomized trials: A confidence interval approach. Journal of Clinical Epidemiology, 66, 197–201. doi:10.1016/j.jclinepi.2012.09.002
Cohen, J. (1988).Statistical power analysis for the behavioral sciences. Hillsdale: Lawrence Erlbaum Associates.
Cohen, J. (1992). A power primer.Psychological Bulletin, 112, 155–159.
De Finetti, B. (1989). Probabilism: A critical essay on the theory of probability and on the value of science.Erkenntnis, 31, 169–223.
Emmel, N. (2013).Sampling and choosing cases in qualitative research: A realist approach. London: Sage.
for theory-based interview studies.Psychology and Health, 25, 1229–1245. doi:10.1080/ 08870440903194015
Glaser, B. (1965). The constant comparative method of qualitative analysis.Social Problems, 12, 436–445.
Goodman, R. (2001). Psychometric properties of the strengths and difficulties questionnaire.
Journal of the American Academy of Child and Adolescent Psychiatry, 40, 1337–1345. doi:10.1097/00004583-200111000-00015
Goodman, S. N., & Berlin, J. A. (1994). The use of predicted confidence intervals when planning experiments and the misuse of power when interpreting results. Annals of Internal Medicine, 121, 200–206.
Goodman, R., & Scott, S. (1999). Comparing the strengths and difficulties questionnaire and the child behavior checklist: Is small beautiful? Journal of Abnormal Child Psychology, 27, 17–24.
Gorard, S., & Taylor, C. (2004). Combining methods in educational and social research. Maidenhead: Open University Press.
Greenhalgh, T., Potts, H. W. W., Wong, G., Bark, P., & Swinglehurst, D. (2009). Tensions and paradoxes in electronic patient record research: A systematic literature review using the meta-narrative method. The Milbank Quarterly, 87, 729–788. doi: 10.1111/j.1468-0009.2008.00538.x
Guest, G., Bunce, A., & Johnson, L. (2006). How many interviews are enough?: An experi-ment with data saturation and variability. Field Methods, 18, 59–82. doi:10.1177/ 1525822X05279903
Guest, G., MacQueen, K. M., & Namey, E. E. (2012).Applied thematic analysis. Thousand Oaks, CA: Sage.
Hattie, J. A. C. (2009).Visible learning. London: Routledge.
Isman, E., Ekéus, C., & Berggren, V. (2013). Perceptions and experiences of female genital mutilation after immigration to Sweden: An explorative study. Sexual & Reproductive Healthcare, 4, 93–98. doi:10.1016/j.srhc.2013.04.004
Isman, E., Mahmoud Warsame, A., Johansson, A., Fried, S., & Berggren, V. (2013). Midwives’experiences in providing care and counselling to women with female genital mutilation (FGM) related problems. Obstetrics and Gynecology International, 2013. Article ID: 785148. doi:10.1155/2013/785148
Kass, R. E. (2011). Statistical inference: The big picture. Statistical Science, 26, 1–9. doi:10.1214/10-STS337
Kessler, R., Berglund, P., & Demler, O. (2005). Lifetime prevalence and age-of-onset distributions of DSM-IV disorders in the national comorbidity survey replication.
Archives of General Psychiatry, 62, 593–603.
Kraemer, H. C., & Kupfer, D. J. (2006). Size of treatment effects and their importance to clinical research and practice. Biological Psychiatry, 59, 990–996. doi: 10.1016/j.bio-psych.2005.09.014
Kuhn, T. S. (1961). The function of measurement in modern physical science. Isis, 52, 161–193.
Lin, A. C. (1998). Bridging positivist and interpretivist approaches to qualitative methods.
Policy Studies Journal, 26, 162–180. doi:10.1111/j.1541-0072.1998.tb01931.x
Morris, P. E., & Fritz, C. O. (2013). Effect sizes in memory research.Memory, 21, 832–842. doi:10.1080/09658211.2013.763984
Oatley, K., & Johnson-laird, P. N. (1987). Towards a cognitive theory of emotions.Cognition and Emotion, 1, 29–50. doi:10.1080/02699938708408362
Onwuegbuzie, A. J., & Leech, N. L. (2007). A call for qualitative power analyses.Quality & Quantity, 41, 105–121. doi:10.1007/s11135-005-1098-1
Pawson, R. (2006).Evidence-based policy: A realist perspective. London: Sage.
Power, M. J., & Tarsia, M. (2007). Basic and complex emotions in depression and anxiety.
Clinical Psychology & Psychotherapy, 14, 19–31. doi:10.1002/cpp.515
R Core Team. (2013). R: A language and environment for statistical computing. Vienna. Retrieved fromhttp://www.r-project.org/
Robinson, O. (2014). Sampling in interview-based qualitative research: A theoretical and practical guide. Qualitative Research in Psychology, 11, 25–41. doi:10.1080/ 14780887.2013.801543
Ryan, G. W., & Bernard, H. R. (2003). Techniques to identify themes. Field Methods, 15, 85–109. doi:10.1177/1525822X02239569
Sandelowski, M. (1995). Sample size in qualitative research.Research in Nursing & Health, 18, 179–183.
Schulz, K., & Grimes, D. (2005). Sample size calculations in randomised trials: Mandatory and mystical.The Lancet, 365, 1348–1353.
Senn, S., & Bretz, F. (2007). Power and sample size when multiple endpoints are considered.
Pharmaceutical Statistics, 6, 161–170. doi:10.1002/pst
Spiegelhalter, D. J., & Freedman, L. S. (1986). A predictive approach to selecting the size of a clinical trial, based on subjective clinical opinion.Statistics in Medicine, 5, 1–13. Tashakkori, C., & Teddlie, C. (Eds.). (2010). Handbook of mixed methods in social and
behavioral research(2nd ed.). Thousand Oaks, CA: Sage.
Teddlie, C., & Yu, F. (2007). Mixed methods sampling: A typology with examples.Journal of Mixed Methods Research, 1, 77–100. doi:10.1177/2345678906292430
Whitley, E., & Ball, J. (2002). Statistics review 4: Sample size calculations.Critical Care, 6
(4).
Wong, G., Greenhalgh, T., Westhorp, G., Buckingham, J., & Pawson, R. (2013). Rameses publication standards: Meta-narrative reviews.BMC Medicine, 11, 20. doi: 10.1186/1741-7015-11-20
Wray, N., Markovic, M., & Manderson, L. (2007). Researcher saturation: The impact of data triangulation and intensive-research practices on the researcher and qualitative research process.Qualitative Health Research, 17, 1392–1402. doi:10.1177/1049732307308308
Wright, A., Maloney, F. L., & Feblowitz, J. C. (2011). Clinician attitudes toward and use of electronic problem lists: a thematic analysis. BMC Medical Informatics and Decision Making, 11, 36. doi:10.1186/1472-6947-11-36
Appendix 1. Computing sample size and power
LetNB(x,k,π) denote the negative binomial probability mass function which calculates the probability that there will have beenx failures before k events, each of which occurs with probability π. Now suppose the total sample size is N, the number of theme instances required isi, and the population theme prevalence is PTP. Then the power is computed as
XNi
k¼0
NBðk;i;PTPÞ
Let NB−1(p, k,π) denote the inverse, i.e. the quantile function, where pis the required power. Then the required sample size is computed asN B1ðp;i;PTPÞ þi.
Implementing in R
The following R (R Core Team, 2013) functions computes the power achieved for a given sample size (SampSize), theme prevalence (ThemePrevalence), and number of instances desired (NumInstances). To run the code, simply copy and paste it into the ‘R Console’ window.
powerForQual = function(SampSize, ThemePrevalence, NumInstances) {
To compute the power for N= 30, a theme prevalence of 0.1, and to find 2 instances, run:
powerForQual(30, 0.1, 2)
This gives the answer 0.816305, i.e. about 82% power.
The following function computes the necessary sample size for given power (Power), theme prevalence (ThemePrevalence), and number of instances desired (NumInstances).
sampSizeForQual = function(Power, ThemePrevalence, NumInstances) {
qnbinom(Power, size = NumInstances,
prob = ThemePrevalence) + NumInstances }
To compute the sample size required for a power of 80% to find a theme prevalence of 0.1, and 2 instances, run:
sampSizeForQual(0.8, 0.1, 2)
This gives the answer 29.