Journal of Criminal Law and Criminology
Volume 13 | Issue 3
Article 4
1923
Recent Statistics Relating to Crime in Chicago
Edith Abbott
Follow this and additional works at:
https://scholarlycommons.law.northwestern.edu/jclc
Part of the
Criminal Law Commons
,
Criminology Commons
, and the
Criminology and Criminal
Justice Commons
This Article is brought to you for free and open access by Northwestern University School of Law Scholarly Commons. It has been accepted for inclusion in Journal of Criminal Law and Criminology by an authorized editor of Northwestern University School of Law Scholarly Commons.
Recommended Citation
IN CHICAGO
EDITH ABBoTT
Statistics are now available that make possible a fairly complete
summary of the facts relating to crime in Chicago during the past five
years.
2Such a summary has not been published since the Merriam
Crime Committee issued its report in the spring of 1915,
3and the
following study is, therefore, an attempt to bring the statistical part of
the Merriam report down to the present day.
Unfortunately, there is neither in the City of Chicago nor in the
State of Illinois a central bureau of criminal statistics through which
statistics from the police department, the courts, the probation
depart-ment, the jail, the House of Correction, and the state prisons, are
col-lected and correlated.
It is true that a state bureau of criminal
sta-tistics does exist on our statute books; for by a law approved June
11, 1912, the State Charities Commission was directed to establish
such a bureau with the secretary of the commission as director in
charge. This proposed bureau was charged with the duty of collecting
and publishing annually the statistics of Illinois relating to crime; and
all courts of Illinois, police magistrates, justices of the peace, clerks
of all courts of record, sheriffs, keepers of all places of detention for
crime or misdemeanors or violations of the criminal statutes are to
"furnish said bureau annually such information on request as it may
require for compiling such statistics."
Up to the present time,
how-'Associate Professor of Social Economy in the University of Chicago and Statistician of the Chicago City Council Committee on Crime, 1914-15.
2
The chief sources of criminal statistics in Chicago are the following series of published reports:
1. Annual reports of the Police Department, City of Chicago. (Last pub-lished report is for the year ending December 31, 1920.)
2. Annual reports of the Municipal Court of Chicago. (Last published report, for the year ending November 30, 1920.)
3. Annual reports of the Adult Probation Office, Cook County. (Last published report, for the year ending September, 1920.)
4. Annual reports of the Superintendent of the House of Correction, City of Chicago. (Last published report, for the year ending December 31, 1921.)
I am indebted to two of my students, Miss M. Porritt and Miss E. Ifolcott, for assistance in preparing the tables used in this article.
3See Report of the City Council Committee on Crime of the City of
ever, the commission has published only a preliminary report on this
subject.
4As to Chicago, there has never been any attempt made at an annual "stock-taking" in which the statistics furnished by the various departments and agencies dealing with the problem of crime might be brought together for examination. Such statistics are published for most of the city departments dealing with crime and could be obtained by an official bureau for the departments or institutions that do not publish reports, such as the County Jail and the Criminal Court.
DEFINITIONS OF "CRIME" AND "CRIMINALS"
Before discussing statistics relating to crime it is necessary to explain that the terms "crime" and "crimina" are loosely used. In a legal sense, all persons who are arrested are suspected criminals; and, if they are later convicted they are "criminals." That is, they are persons who are found to have violated a public law. But many of these laws deal with very trivial offenses, and it is important therefore to understand that the vast majority of arrests are arrests of petty offenders and that the vast majority of cases in the criminal branches of the municipal courts are the cases of persons who have only corn-" mitted misdemeanors or violated city ordinances. That is, the great majority of arrests are not for "crimes" at all in the sense that most people understand the word "crime"; they are not arrests of persons suspected of murder or burglary or robbery; on the contrary, most of the persons taken into custody are merely charged with disorderly con-duct, a term which covers a multitude of minor offenses. To call all the persons brought into these courts "criminals" is to use the word only in a legal or technical sense.
In the public mind only the man who has committed a felony is a "criminal." The person who has parked his automobile in the wrong
place or refused to "move on" when ordered to do so by the police is an offender against the law, but he is not a "criminal" in the eyes of the community. The proportions of the real crime problem then are relatively small. The police, the courts, and all the other forms of criminal machinery that go with the enforcing the sanctions of the law are largely for the punishment of small offenses.
LARGE PROPORTION OF CRIMINALS ARE PETTY OFFENDERS
The following table shows the relatively small number of arrests for felonies in comparison with the total number of arrests:
TABLE I
Total Number of Arrests, Number of Arrests for Felonies, and Per Cent of All Arrests, CTicago, 1910-1921
Arrests for
Felonies-Year All Arrests Number Per Cent of All Arrests
1910 ... 81,269 9,376 11.5
1911 . ... 84,840 9,881 11.6 1912 ... ... 86,950 10,276 11.8 1913 ... 109,764 11,203 10.2 1914 ... 116,895 15,101 12.9 1915 ... 121,714 15,286 12.6 1916 ... 111,587 12,314 11.0 1917 ... 137,910 14,044 10.2 1918 ... 110,819 12,080 10.9 1919 ... 96,676 14,171 14.7 1920 ... 94,453 15,273 16.2
1921 ... 125,843 16,912 13.4
Two significant facts appear in this table: (1) that the number of felonies or serious crimes is a very small percentage of the whole number of arrests; (2) that this percentage of serious crimes has been higher during the past three years. Thus from 1910 through 1918 the percentage of arrests on felony charges varied from 10.2 to 12.9 of all arrests. In 1919 this percentage rose to 14.7 and in 1920 to 16.2 of all arrests.
STATISTICS RELATING TO THE EXTENT OF CRIME IN THE COMMUNITY
The volume of crime in any community is a subject about which reliable information should be available. It is important, for example, that we should know whether crime is increasing or decreasing and whether there is, relatively, more crime in this than in other com-munities of the same size and character. But many crimes are con-cealed and remain undetected so that an exact quantitative measure of the volume of crime can never be obtained. Statistics which might, however, serve as the basis for comparisons from year to year and from community to community should be available. These statistics may be based on (1) criminal complaints made to the police; (2) arrests on felony charges; (3) convictions on felony charges in the criminal courts; (4) commitments to the County Jail and to the House of Correction.
HAS CRIME INCREASED IN CHICAGO
TAnE 2
Total Number of Criminal Complaints and the Number per 10,000 Population (Data furnished b the Chicago Chief of Police)
Total Number of Number per 10,000
Year Criminal Complaints Population
1915 ... 25,497 103.5 1916 ... 20,133 79.9 1917 ... 16,495 64.2 1918 ... 11,041 42.9 1919 ... 16,656 62.3 1920 ... 14,007 52.2 1921 ... 11,666 41.9
Statistics of criminal complaints for, the specific
offenses-burg-lary, robbery, larceny-are given in the table that follows:
TABLE 3
Criminal Complaints
(Data furnished by the Chicago Chief of Police)
Year Burglary Robbery Larceny
1915 ... 9,788 2,304 9,751 1916 ... 7,174 1,747 8,846
1917 ... 5,623 1,984 7,234 1918 ... 3,643 1,405 5,210
1919 ... 5,884 2,649 6,795
1920 ... 5,460 2,620 5,251 1921 ... 4,785 2,594 3,700
Unfortunately these statistics of criminal complaints cannot be
accepted as a nmieasure of the tendency of crime to increase or decrease
since there are apparently frequent and sometimes erratic changes in
the method of recording complaints. This subject was discussed in
1915 in the report of the Merriam Crime Committee, in which
sta-tistics were given for a period of nine years. It was pointed out in
that report that, since in some years the arrests on felony charges
actually exceed the number of criminal complaints, the complaint
statistics must be unreliable.
5It will be noted that in 1920 and 1921,
for example, the number of arrests on felony charges exceeds the
number of criminal complaints. It is also significant that there was a
very marked decline in the number of criminal complaints in 1920 and
again in 1921, although the number of arrests on felony charges
increased in each of these years.
5
Recently some further light has been thrown on this subject by the reports of thef present so-called "Crime Commission," an association supported by private funds. The director of this organiza-tion in studying the criminal complaints received from police head-quarters6 came to the conclusion that in a residence territory divided into two precincts comnhanded by two different police captains, there should be approximately the same number of criminal complaints from each if the same class of population was to be found in each precinct.
When one district returned many complaints and the corresponding district very few, it seemed to be clear that there was "laxness or corruption on the part of the commanding officer in the district, or failure to report." A careful study of the question of whether or not some of the captains were not reporting complaints "brought out the fact that the captains were not reporting the complaints made to them to the Bureau of Records of the Police Department. In one instance, for a period of a month a certain captain reported but 37 criminal complaints for his district. Investigation by the commission developed that there had been 141 complaints made to him and he had failed to report 104 of them. In the other instance 40 burglaries and robberies were known to have been committed, which were not reported.
"A detailed report of these was sent to the general superintendent of police and after verification by the department inspector, who found that they had been reported to the local precinct station by victims, but had not been reported to the Bureau of Records, the captain in question was requested to explain his action. He replied in detail. Each excuse for failure to report is practically the, same and one will suffice as an example.
"'Charles Hague, 6501 Yale avenue, reported that he was held up and robbed of $9.45 in front of 340 West 66th street by three boys who strong-armed him. Mr. Hague could not give any description of his assailants and on that account no criminal complaint .was for-warded.'
"The captain was transferred from the district, but strong politi-cal influence has been invoked to keep him in the department."
ARRESTS
Statistics of arrests should also throw some light upon the ques-tion of the increase or decrease in crime. Here again, however, the
statistics are in large measure vitiated by the fact that they are
influ-enced by other factors than the actual number of offenses committed.
That is, an increase in arrests may be due to increased efficiency or
at any rate to increased activity on the part of the police and not to
an increase in crime; and a decrease in arrests may be due to .an
increased laxity or diminished activity or to the fact that the police
are suspending the excessive use of the "drag-net" system and are no
longer making wholesale arrests without adequate evidence of guilt.
That is, statistics of arrests. may serve to show more about the
cir-cumstances of police activity than about the actual changes in the
number of crimes committed in the community.
The following table shows the number of arrests for the period
1910-1921.
Statistics covering a decade are presented because the
changes over this period do not indicate a single w~ll-defined tendency,
but a series of erratic movements upward and then down and then
up again:
TABLE 4
Arrests (Charges); Felonies and Misdemeanors, Ninber and Number per 10,000 Population, Chicago, 1910-1921
(Data from Annual Reports of the Chicago Police Department)
- Felonies- -Misdemeanors-
Total-Number per Number per Number per
10,000 10,000 10,000
Year Number Population Number Population Number Population 1910 ... 9,376 42.9 71,893 329.0 81,269 371.9 1911 ... 9,881 43.9 74,959 333.2 84,840 377.1 1912 ... 10,276 44.6 76,674 333.1 86,950 377.7 1913 ... 11,203 - 47.6 98,561 418.6 109,764 466.2 1914 ... 15,101 62.6 101,794 422.2 116,895 484.8 1915 ... 15,286 62.1 106,428 431.8 121,714 493.9 1916 ... 12,314 48.9 99,273 394.3 111,587 443.2 1917 ... 14,044 54.6 123,866 481.9 137,910 536.5 1918 ... 12,080 46.0 98,739 376.5 110,819 422.5 1919 ... 14,171 52.9 82,505 308.4 96,676 361.3 1920 ... 15,273 56.5 79,180 293.1 94,453 349.6 1921 .... 16,912 60.8 108,931 391.8 125,843 452.6
The significant facts here are (1) an increase in arrests for
felonies since 1918 and (2), until the year 1921, a decrease in arrests
for misdemeanors. There were more arrests for felonies in 1921 than
in any other year in the decade, but not quite so many in proportion
to the population as in the years 1914 and 1915.
the decline both in felony and misdemeanor charges in 1918. In 1919,
however, when felony charges increased, the number of misdemeanor
charges showed a further and marked decline, which, with the
continu-ing decline in 1920, should probably be attributed to the effects of
prohibition. The increase during the past year (1921) in both felony
and misdemeanor charges is more difficult to explain.
INDICTMENTS
The number of indictments should also be examined, although
here again an increase in numbers may be due to increased activity on
the part of the prosecuting officials and a decrease may similarly be
caused by the diminished zeal of sucl, officials.
TABLE 5
Number of Cases Held to the Grand Jury, Number and Per Cent in Which. No Bills Were Returned by the Grand July, 1914-1921
(From Annual Reports of the Chicago Police Department)
Held to the
No Bills by the Grand Jury
Year
Grand Jury
Number
Per Cent of Total
1914 ... 3,582
996
27.8
1915 ... 3,569
845
23.7
1916
...
3,210
1,077
33.6
1917 ... 3,794
925
24.4
1918
...
3,179
657
20.7
1919 ... 4,546
932
20.5
1920 ... 4,962 503 10.1 1921 ... 5,704 579 10.2
CONVICTIONS ON FELONY CHARGES
The statistics given show only the numbers of persons charged
with offenses, the number arrested or tried. More satisfactory for
obvious reasons are statistics showing the number of convictions. The
following table shows the number of convictions upon felony and
mis-demeanor charges and the number per 10,000 population, 1915-1921:
Y
19 1919 19 19 19
TABLE
6
Number of Convictions Upon Felony and Misdemeanor Charges and the Number per 10,000 Population, 1915-1921
(Data compiled from Annual Reports of the Chicago Police Department) -- Felonies-
-Misdemeanors-Number per Number p
10,000 10,000
ear Number Population Number Populatio
915 ... 4,739 19.2 42,248 171.4 916 ... 3,325 13.2 33,441 132.8 '17 ... 4,905 19.1 41,765 162.5 918 ... 4,341 16.6 30,844 117.6 919 ... 4,066 15.2 28,395 106.1 20 ... 4,282 15.8 24,228 89.7 '21 ... 4,224 15.2 36,043 129.9
er
The statistics presented in this table indicate that so far as con-victions on felony charges are concerned, it is clear that there has been a marked downward tendency since 1917. There was, it is true, a slight increase in 1920, but it was an increase of less than one in 10,000
population, and even then the number was very clearly lower than in 1917. There was an increase in misdemeanor convictions last year (1921), but in spite of the increase the number convicted per 10,000 population was greatly below the number convicted in the years 1915,
1916, 1917.
This table should be compared with the number of arrests per 10,000 population (Table 4, p. 10). In 1918 there was a decline in felony arrests and a corresponding decline in convictions. But in 1919, when there was a marked increase in arrests, there was a decline in convictions; again in 1921, although there was an increase in the num-ber of arrests on felony charges from 56.5 to 60.8 per 10,000 popula-tion, there was a decline in the number of convictions on such charges from 15.8 to 15.2 per 10,000 population. In general, of course, sta-tistics of convictions should follow the general trend of arrests or police charges. An increase in charges and a decrease in convictions seems to indicate either (1) that charges are being unwarrantably made without being based on proper evidence of guilt, or (2) that the charges are not being properly prosecuted.
THE WASTE OF NEEDLESS ARRESTS
Are the police making arrests unnecessarily? Are residents of Chicago being subjected, without adequate basis for such charges, to the humiliation, disgrace and expenses connected with an arrest? Not only in this but in many cases there is the further disgrace and demoralization- of detention in the police station and County Jail as well. There is a tremendous social and economic waste if large num-bers of persons are arrested on charges too flimsy to warrant prose-cution and conviction. Statistics making possible a comparison be-tween the number of cases discharged and convicted should throw light on this point.
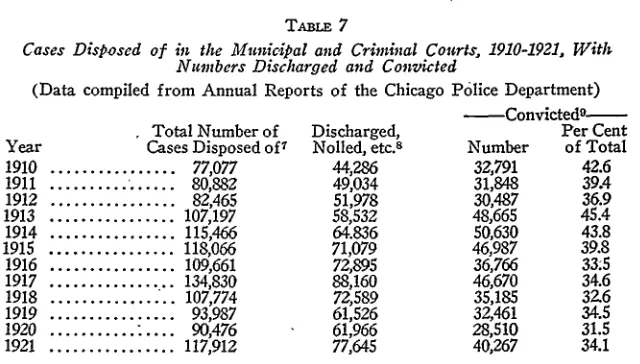
The following table shows the total number of cases disposed of and the number of cases discharged, nolled, etc., together with the num-ber of convictions and the per cent of convictions for the period
TAE 7
Cases Disposed of in the Municipal and Criminal Courts, 1910-1921, With Numbers Discharged and Convicted
(Data compiled from Annual Reports of the Chicago Police Department)
-Convictedg-Total Number of Discharged, Per Cent
Year Cases Disposed of7 Nolled, etc.8 Number of Total 1910 ... 77,077 44,286 32,791 42.6 1911 ... 80,882 49,034 31,848 39.4
1912 ... 82,465 51,978 30,487 36.9
1913 ... 107,197 58,532 48,665 45.4
1914 ... 115,466 64.836 50,630 43.8 1915 ... 118,066 71,079 46,987 39.8 1916 ... 109,661 72,895 36,766 33.5
1917 ... 134,830 88,160 46,670 34.6
1918 ... 107,774 72,589 35,185 32.6
1919 ... 93,987 61,526 32,461 34.5
1920 ... 90,476 61,966 28,510 31.5
1921 ... 117,912 77,645 40,267 34.1
This table shows that only 34 out of every hundred charges dis-posed of in 1921 resulted in convictions and only 32 out of the 100 in 1920 resulted in convictions. The per cent of convictions was small before 1915, but it has fallen very much lower since that time; starting from 40 convictions out of the 100 charges in 1915, the number fell to 34 in the next year, to 33 in 1918, and later fell to the very low figure of 32 per cent in 1920. In 1914, commenting on the fact that the majority of the thousands of persons who are brought into our courts are discharged without conviction, the Merriam Crime Com-mittee said:
The hardships and waste of this system are obvious. Following the assumption that those discharged are innocent, then in 1913, 57 per cent of all the 121,333 persons who were brought into the Municipal Court for felonies, for misdemeanors, or for violations of ordinances were innocent and should not have been brought into court at all; that is, more than 60,000 persons were brought into court needlessly. Nearly all of these persons had been arrested, many thousands of them had spent hours at least in the police stations, many hundreds had spent weeks or months in the County Jail. They had all had the humiliation and expense of being arrested and tried, and the taxpayers had borne the cost of the police who arrested them, of the police stations or jails that had detained them, of the courts and judges and other court officials who had been part of the machinery that tried them. There
7Omitted from the total number of charges are those turned over to U. S. authorities; otherwise disposed of; pending; and held to Juvenile Court.
6Discharged, nolled, etc., includes bonds forfeited; no bills by grand jury;
discharged; nolled.
[image:10.612.37.357.79.261.2]is more than this to be considered. Unjustified arrests and imprison-ment create a disrespect for the law that in turn breeds lawlessness."
The following list of arrests, nearly all of which resulted in dis-charges, has been compiled from the last report of the Municipal Court of Chicago. Most of these arrests were made under Ordinance 2012, which deals with "disorderly conduct"; but it is important to know the precise offenses covered by the disorderly conduct charge. The following series of cases illustrates the "crimes" committed by num-erous petty offenders:
"2012, picked up 4 P. M., discharged army three weeks ago"; "2012, just came from Bridewell, discharged"; "Sitting in vacant flat, discharged"; "2012, no home, discharged"; "On the street 11:30 P. M., $25 and costs (House of Correction)"; "Walked around Chicago all night. Belongs to 7th Regiment, 2012, discharged"; "pool room raid, discharged';; "2012, sleeping in wagon, discharged';; "2012 sleeping in alley, drunk, discharged"; "standing in doorway, 11 P. M., dis-charged"; "2012, loafing in depot, disdis-charged"; "2012, standing on corner 5:30 A. M., discharged"; "2012, sleeping on roof of building at 1 A. M., discharged"; "2012, on railway property, had fight with officer, discharged';; "2012, on street 12:50 A M., discharged. Said 'was picked up because of past arrests' "; "vagrancy, discharged"; "bumming, discharged"; "gang fight, discharged (ran away from Lin-coln)"; "2012, out of work 1 month, probation 6 months"; "smoking cigarette in the park, discharged"; "2012, in a restaurant 6:30 A. M., discharged"; "2012, on street at 2 A. M., not staying home, dis-charged"; "2012, just out of the House of Correction, disdis-charged";
"2012, picked up on su .picion, discharged"; "2012, picked up at 2 A. M., discharged"; "2012, 'goofing on the corner,' discharged"; "2012, climbing up 'L' road to get a free ride, discharged"; "2012, on
'0See Report of the City Council Committee on Crime of the City of Chi-cago (1915), pp. 42-43., Statistician's Report, by E. Abbott. The large percentage of discharges was explained in the earlier report by an account of the precise charges on which arrests had been made. A list of some of the typically trivial charges heard in the Boys' Court was given as follows:
street at 3 P. M., discharged"; "2012, picked up going to work 8:30 A.M., discharged"; "2012, picked up at 10:30A. M., discharged"; "2012. sleeping in a barn, probation 6 months"; "2012, in an alley between 12 and 1 A. M. Fined $10 and costs"; "2012, standing on a corner, discharged"; "2012, picked up standing in front of a restaurant, dis-charged"; "2012, on street at 9 A M., discharged"; "2012, bumming from home 3 weeks, discharged"; "2012, was hit on head by officer, $200 and costs, sent to hospital for treatment, discharged"; "2012, on street at 5:30 A. M., 'going to work,' discharged"; "robbery, C. C., $2,500. Beaten up by policeman. His eye almost knocked out and wrist broken. Pontiac"; "2012, sleeping in a basement, discharged"; "fooling around a Ford on the street at 12 P. M., House of Correction, 2 months"; "2012, fight, discharged"; "city vagrancy. Out of House of Correction 1 month, discharged"; "vagrancy, discharged"; "2012, cranking a car for a boy who said the car belonged to him, discharged"; "picked up late, fined $10 and costs"; "2012, is a bum, feeble-minded, sent to Lincoln"; "2012, discharged, ran away from Lincoln 4 days after commitment"; "2012, discharged."
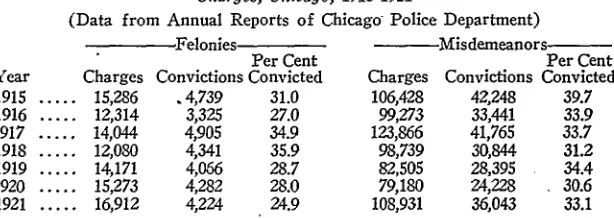
The percentage of convictions for serious offenses (felonies) is even lower than the percentage of convictions for all offenses The following table shows separately for felonies and misdemeanors the total number of charges and the total number of convictions:
TABLE 8
Charges and Convictions and Per Cent Convicted on Felony and Misdemeanor Charges, Chicago, 1915-1921
(Data from Annual Reports of Chicago Police Department)
Felonies -
Misdemeanors-Per Cent Per Cent
Year Charges Convictions Convicted Charges Convictions Convicted 1915 ... 15,286 .4,739 31.0 106,428 42,248 39.7 1916 ... 12,314 3,325 27.0 99,273 33,441 33.9 1917 ... 14,044 4,905 34.9 123,866 41,765 33.7 1918 ... 12,080 4,341 35.9 98,739 30,844 31.2
1919 ... 14,171 4,066 28.7 82,505 28,395 34.4 1920 ... 15,273 4,282 28.0 79,180 24,228 30.6 1921 ... 16,912 4,224 24.9 108,931 36,043 33.1
[image:12.612.43.350.386.495.2]were brought into court are shown, together with the per cent of
con-victions:
TARBLE 9
Convictions on Certain Felony Charges in the Municipal and Criminal Courts, 1920, With Number of Charges and Percentage Convicted
(Data from Annual Reports of Chicago Police Department) Number of Number of Per Cent
Felonies Charges Convictions Convicted
Burglary ... ... 1,902 506 26.6 Burglary, attempted ... 141 40 28.4 Confidence game ... 1,011 138 13.6
Conspiracy ... 240 18 7.5
Crime against children ... 169 50 29.6 Embezzlement and larceny ... 184 31 16.8 Forgery ... 112 17 15.2 Larceny and Larceny by bailee ... 5,471 2,533 46.3 Larceny of automobile ... 458 130 28.4 Malicious mischief ... 304 81 26.6 Murder ... 198 30 15.2 Murder, attempted ... 316 46 14.6
Rape ... 196 29 14.9
Receiving stolen property... 1,150 197 17.0
Robbery ... 1,862 283 15.2
Robbery, attempted ... 187 25 13.3
This table shows that for many felonies the convictions fall below
the 25 per cent for all felonies. For murder, only 15 per cent are
convicted; for robbery, 15 per cent; for embezzlement, 16.8 per cent;
for "confidence game," 13.6 per cent; for attempted murder, 15 per
cent; for receiving stolen property, 17 per cent.
A small percentage of convictions may mean either that a large
number of persons are arrested without proper evidence of guilt and
therefore must be discharged as innocent or that persons who are
really guilty are discharged through some inefficiency of the
prosecut-ing machinery. In either case the result is demoralizprosecut-ing to the
com-munity. Innocent men cannot be treated like criminals without
con-tamination.
Such a system breeds criminals instead of preventing
crime.
SMALL PERCENTAGE OF UNNEcESSARY ARRESTS IN LONDON
AND ENGLAND
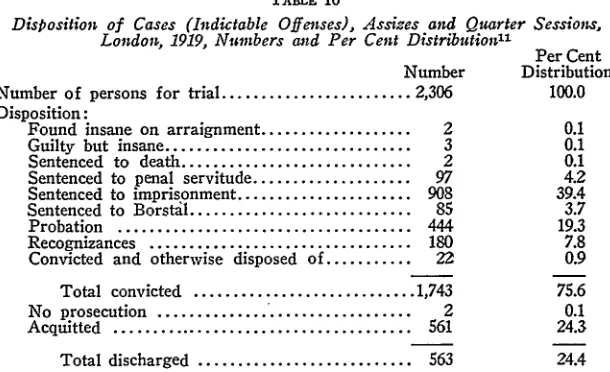
TABLE 10
Disposition of Cases (Indictable Offenses), Assizes and Quarter Sessions, London, 1919, Numbers and Per Cent Distribution Pr
Per Cent Number Distribution Number of persons for trial ... 2,306 100.0
Disposition:
Found insane on arraignment ... 2 0.1
Guilty but insane ... 3 0.1
Sentenced to death ... 2 0.1
Sentenced to penal servitude ... 97 4.2 Sentenced to imprisonment ... 908 39.4 Sentenced to Borst~l ... 85 3.7
Probation ... 444 19.3 Recognizances ... 180 7.8 Convicted and otherwise disposed of ... 22 0.9
Total convicted ... 1,743 75.6 No prosecution ... 2 0.1 Acquitted ... 561 24.3
Total discharged ... 563 24.4
The table given shows that in London in 1919, 76 per cent of the
persons tried for indictable offenses in the higher criminal courts were convicted and 24 per cent were discharged. In the same year in Chicago 29' per cent of the felony cases disposed of resulted in con-victions and 71 per cent were discharged. Last year (1921) in Chi-cago 75 per cent of the felony cases disposed of were discharged and 25 per cent resulted in convictions.
It is of interest, too, that the per cent of convictions in London was below the per cent for the whole of England and Wales. The fol-lowing table shows the disposition of cases of persons tried for indict-able offenses in England and Wales in 1919:
TABLE 11
Disposition of Cases (Indictable Offenses), Assizes and Quarter Sessions, England and Wales, 1919, Numbers and Per Cent Distribution12
I Per Cent
Number Distribution Number of persons for trial ... 7,883 100.0 Disposition:
Found insane on arraignment ... 29
GuiIt but insane ... 29
Sentenced to death ... 24
Sentenced to penal servitude ... 376
Sentenced to imprisonment ... ... 3,914 Sentenced to Borstal ... ... 412
Probation ... 564
IlCompiled from Criminal Judicial Statistics, England Table VI (Cmd. 1424).
'2Compiled from Criminal Judicial Statistics, England Table VI (Cmd. 1424).
0.4 0.4 0.3 .4.8 49.6 52
7.2
and Wales, 1919,
[image:14.612.39.344.77.263.2]TABLE 11-Continued
Per Cent Number Distribution Recognizances ... 775 9.8 Convicted and otherwise disposed of ... 127 1.6
Total convicted ... 6,250 79.3
No prosecution ... 8 0.1 Acquitted ... 1,625 20.6
Total discharged ... 1,633 20.7
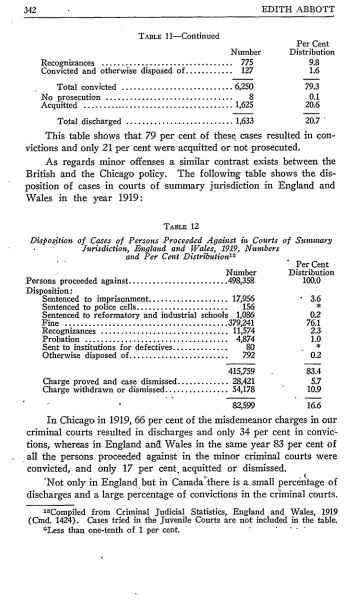
This table shows that 79 per cent of these cases resulted in
con-victions and only 21 per cent were acquitted or not prosecuted.
As regards minor offenses a similar contrast exists between the
British and the Chicago policy. The following table shows the
dis-position of cases in courts of summary jurisdiction in England and
Wales in the year 1919:
TABLE 12
Disposition of Cases of Persons Proceeded Against in Courts of Sumnary Jurisdiction, .F'ngland and Wales, 1919, Numbers
and Per Cent Distributionl3
• "
Per Cent
Number Distribution
Persons proceeded against ... 498,358 100.0
Disposition:
Sentenced to imprisonment ... 17,956 3.6
Sentenced to police cells ... 156 *
Sentenced to reformatory and industrial schools 1,086 0.2
Fine ... 379,241 76.1 Recognizances ... 11,574
2.3-Probation ... 4,874 1.0
Sent
to institutions for defectives ... 80 *Otherwise disposed of ... 792 0.2
415,759 83.4
Charge proved and case dismissed ... 28,421 5.7
Charge withdrawn or dismissed ... 54,178 10.9
82,599
16.6
In Chicago in 1919, 66 per cent of the misdemeanor charges in our
criminal courts resulted in discharges and only 34 per cent in
convic-tions, whereas in England and Wales in the same year 83 per cent of
all the persons proceeded against in the minor criminal courts were
convicted, and only 17 per cent, acquitted or dismissed.
'Not only in England but in Canada there is a small percen'tage of
discharges and a large percentage of convictions in the criminal courts.
IsCompiled from Criminal Judicial Statistics, England and Wales, 1919
(Cmd. 1424). Cases tried in the Juvenile Courts are not included in the table.
[image:15.612.39.392.45.648.2]SMALL PERCENTAGE OF UNNECESSARY ARRESTS IN CANADA
TABLE 13
Disposition of Indictable Offenses in Canada, 1919, Acquittals and Convictions. Numbers and Per Cent Distributiol1 4
- Numbers- Per Cent Distribution
1919 1920 1919 1920
Acquittals ... 4,625 4,770 20.1 20.5 Convictions ... 18,396 18,443 79.9 79.5
Charges ... 23,021 23,213 100.0 100.0 This table shows that in Canada in two successive years there were for indictable offenses approximately 20 per cent of acquittals and 80 per cent of convictions, while in Chicago in the same time there were approximately 71 per cent of dismissals or acquittals and only
28 or 29 per cent of convictions.
These statistics present a challenge to the thoughtful citizen. Has the administration of criminal justice in Chicago become so inefficient or corrupt or both that out of every hundred felony charges, only 28 or 29 result in convictions, whereas in the courts of Canada or in England approximately 75 or 80 out of every hundred persons tried for similar offenses are found guilty.
The statistics show that we have in Chicago a system of dealing with crime that is in itself a cause of crime. For a high percentage of discharges or acquittals means one of two things: Either innocent people are being arrested who must be discharged in court or who cannot even be prosecuted because there is insufficient evidence against them; or persons who are guilty are discharged because of inefficient, incompetent, or corrupt administration of the machinery of criminal justice. In either case, a crime-producing situation exists. For inno-cent men are made criminals through associating with criminals in police stations and jails and courts. And in the other case, the uncer-tainty of punishment, the large chances of escape from conviction tempt men to adopt or continue criminal careers.
The arrest of the innocent and the escape of the guilty are evils indicated by the high percentage of discharges and are evils which lead to an increase in crime and tend to defeat the very purpose for which
the machinery of criminal justice is organized.
A more detailed study of the disposition of criminal cases shows other facts of interest about those convicted. The following table
14
From Forty-fifth Annual Report of Criminal Statistics for Canada, 1920,
shows how cases were actually disposed of during a period of five
years, the quinquennium, 1916-1920:
TABLE 14
Disposition of Cases in the Mlnicipal Courts and Criminal CofrtA, Chicago, 1916-1920
(Data compiled from Annual Reports of the Chicago Police Department) Disposition of Cases: 1916
All cases disposed of ... 109,661 Sentenced to hang ... 2 Sentenced to Joliet arM Chester
peni-tentiaries ... 198 Sentenced to Pontiac Reformatory... 244 Sentenced to County Jail ... 105 Sentenced to House of Correction .... 2,508 Sentenced to other correctiohal
insti-tutions ... ... Fined ... 30,809
Placed on probation ... 1,971 Released on peace bonds ... 135 Ordered to make weekly payments... 794 Bonds forfeited ... 611 Discharged, no bills by grand jury,'
nolled, etc. ... 72,284 1917 134,830 199 326 380 3,655 38,754 2,561 112 683 412 1918 107,774 1 116 221 296 3,045 29,092 1,988 64 372 309
87,748
72,280
1919 93,987 4 235 207 221 2,425 8 25,586 2,947 146 682 612 1920 90,476 7 198 177 370
2,086
24 21,878 2,500 740 5303,206
60,914 58,760
Quinquennial Average, 1916-1920 Per Cent
Disposition of Cases: Number
All cases disposed of ... 107,346 Sentenced to hang ... 3
Sentenced to major prisons (Joliet, Chester, Pontiac) 424 Sentenced to minor prisons (County Jail, House of
Correction) ... 3,023 Fined ... 29,224 Placed on probation ... 2,393 Released on peace bonds and ordered to make weekly
payments ...
852
Bonds forfeited ... 1,030
Discharged, no bills, nolled, etc ... 70,397
Distribution 100.0 0.4 2.8 27.2 Z2 0.8 1.0, 65.6
COUNTY JAIL
Ann)
HOUSE OF CORRECTIONOther statistics whichmight also be expected to throw'some light
on the question of whether there has been an increase or decrease in
crime are the statistics of the County Jail and House of Correction.
The number of persons received in each of these institutions during the
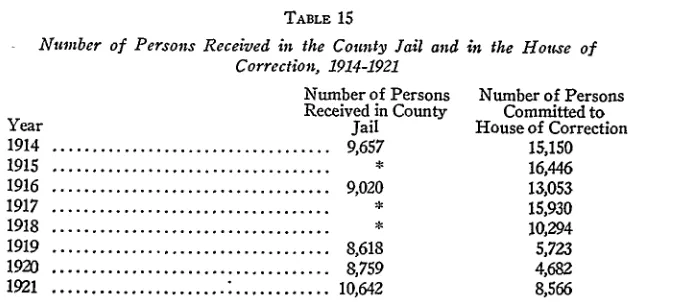
period 1914-1921 are as follows:
[image:17.612.60.372.115.470.2]Yea 1914 1915 1916 1917 1918 1919 1920
TABLE 15
Number of Persons Received in the County Jail and in the House of Correction, 1914-1921
Number of Persons Number of Persc Received in County Committed to
[image:18.612.38.375.74.225.2]r Jail House of Correct
... 9,657 15,150
... * 16,446
... 9,020 13,053
8,618 8,759 1fl rA)?
15,930 10,294 5,723
4,682
Q C:1 )s
ion
12 ... fl
~U~JI
Statistics from the House of Correction are of interest because of
the marked decline in the numbers received there in the years 1919
and 1920. The first conspicuous drop in numbers came in 1918, when
the number committed fell from 15,930 in 1917 to 10,294 in the
follow-ing year. Probably as a result of the prohibition law there was a
further and a very marked decline continuing through the years 1919
and 1920. The commitments in 1921 increased very substantially over
those for 1920, but the number committed in 1921 nevertheless
re-mained 48 per cent below the number committed in 1915.
The statistics of the number of persons lodged in the County Jail
should also be compared with the number of convictions on felony
charges. These two groups of statistics might be expected to follow
the same general trend unless persons are detained in jail
unneces-sarily. However, comparing table 15 with table 8, the extraordinary
fact appears that although the number of persons in the County Jail
increased from 8,759 in 1920 to 10,642 in 1921, an increase of 21 per
cent, the number of convictions on felony charges fell from 4,282 to
4,224, a decrease of 1 per cent.
COMMITMENTS FOR THE NON-PAYmENT OF FINES
The (Merriam) Crime Committee in 1915 reported that the
Chi-cago House of Correction was being supported at great expense to the
taxpayers largely to take care of men who were too poor to pay the
small fines assessed against them. For a series of years more than 80
per cent of the persons committed to the House of Correction had been
committed for the non-payment of fines.
This committee
recom-mended the adoption of the system of allowing poor people to pay
*Figures not available.
1
fines by installments so that men would no longer be committed to prison because of their poverty. The legislature approved this recom-mendation, and in 1915 passed an amendment to the adult probation law (an amendment recommended by the Chief Adult Probation Officer as well as by the City Council Committee) permitting the release on probation of men and women unable to pay fines and provided for the collection of fines by installments through the Adult Probation Department.
Recent statistics show thAt the judges are making little use of the installment fine system. No statistics are available as to the numbers of persons actually released under this system, but the House of Cor-rection statistics, which are given below, show the numbers still com-mitted not for their crimes, but for their poverty.
TABLE
16
Coimmitinents to the House of Correction, 1914-1921
Year 1914 1915 1916 1917 1918 f919 1920 1921
Year S
1914 ...
1915 ...
1916 ...
1917 ...
1918 ...
1919 ...
1920 ; . ... 1921 ...
Sentenced 1,088 1,111 840 1,334 1,045 797 435 672 entenced 7.2 6.7 6.4 8.4 10.2 13.9 9.3 7.8 Numbers Committed for Non-Payment of Fines
12,005 12,841 10,275 12,103 6,963 3,509 2,822 6,005 Percentages Committed for Non-Payment of Fines
79.2 78.1 78.7 76.0 67.6 61.3 60.3 70.1
-
This table shows that both the numbers of those committed to
the House of Correction for all causes fell very sharply in f918 and
Fined and Sentenced 2,057 2,494 1,938 2,493 2,286 1,417 1,425 1,889
Fined and
[image:19.612.55.379.247.551.2]the following years and the numbers of those committed for the
non-payment of fines fell along with all commitments.
The table shows
too that the percentage of those committed for the non-payment of
fines fell from 79 per cent of the total number committed in 1914 to
60 per cent of the total committed in 1920, and then rose again the
year 1921 to 70 per cent of those committed.
That 70 per cent or even 60 per cent of those who are sent to the
Bridewell to be supported at the expense of the taxpayers are sent
there only because they are poor, remains a public scandal and disgrace
to the City of Chicago.
DECLINE IN COMMITMENTS FOR NON-PAYMENT
OF
FINES IN GREAT BRITAINThese facts as to the extent of imprisonment for the non-payment
of fines should be the more carefully considered in our country in view
of the fact that the whole evil system has been practically swept away
in Great Britain since the enactment of the Criminal Justice
Admin-istration Act of 1914. In our supposedly more democratic country it
appears that in the second largest city in the country the judges sent
last year to our city workhouse 6,000 men and women who were too
poor to pay the fines imposed upon them. This evil is not confined
to Chicago; when the last federal census of prisoners was taken,
the returns showed that in the country as a whole more than 290,000
persons were imprisoned in this way for their poverty in a single year.
In the meantime Great Britain has adopted the more efficient and
humane policy of doing away gradually with this last surviving
rem-nant of the out-worn system of imprisonment for debt. Since 1905,
it had been optional with the British courts to give a man time to pay
his fine, but in 1914 it ceased to be optional and became mandatory.
The first section of the Criminal Justice Administration Act of 1914
provided that in all cases time must be given for the payment of fines
and the time must not be less than seven clear days. At the end of
this time further time may be allowed by the court and payment in
installments may be allowed. The act contains the further humane
provision that in imposing a fine the court is to take into consideration
"the means of the offender so far as they appear or are known to the
court." This provision puis an end to what the Prison Commissioners
for Scotland called the "abuse which-.
. .arises from the imposition
off." Reports of the three Prison Commissions of England, Scotland and Ireland all testify to the beneficial results of the Act of 1914 in operation. The new system is not only humane, but economical. The great saving to the taxpayers is indicated by the figures showing the great reduction in the number of persons committed to prison for the non-payment of fines in England and Wales in 1909-10 and 1910-20:
Per Cent
Number of Total
Committed for Non-
Commit-Year Payment of Fine mentsl4a
1909-10 ... 90,753 50 1919-20 ... 9,303 26
Other data relating to the payment of fines are found in the
Criminal Judicial Statistics of England and Wales. In 1913,
before
the passage of the Act of 1914, fines were imposed by courts of
sum-mary jurisdiction in 502,554 cases, and 75,152 persons were committed
for non-payment of fines.
In 1919 fines were imposed in 393,726
cases, but fewer than 10,000 persons were imprisoned for non-payment
of fines. While this reduction has been largely due to the Criminal
Justice Administration Act, the fact should not be overlooked that it is
also due in part to the fact that the fines assessed have remained at
the old pre-war rate and have not increased to correspond with the
higher rates of wages, and a much larger proportion of offenders have
therefore been able to pay the fines imposed.
1That is, the poor and
the rich have been placed more nearly-on a footing of equality before
the law.
34aData from Report of the Commissioner of Prisons and the Directors of Convict Prisons for the year ending March 31, 1920 (Cmd. 972), pp. 9-10.
PERSONS ARE CoiMTTED FOR VERY SmALL FINES
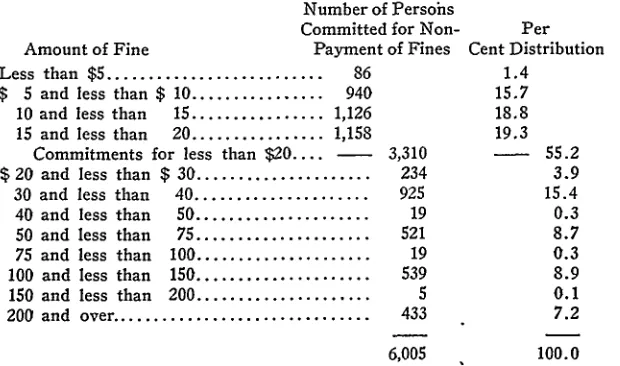
Not only do our statistics show that hundreds of persons are being annually imprisoned for inability to pay fines, but these persons are imprisoned for fines of very small amounts. The following table shows the amount of the fines for which people are committed to the Chicago House of Correction:
TABLE 17
Number of Persons Committed to the House of Correction for Non-Payment of Finws of Specified Amounts, 1921
Number of Persohs
Committed for Non- Per Amount of Fine Payment of Fines Cent Distribution Less than $5 ... 86 1.4
$ 5 and less than $ 10 ... 940 15.7 10 and less than 15 ... 1,126 18.8 15 and less than 20 ... 1,158 19.3
Commitments for less than $20 .... 3,310 - 55.2
$
20 and less than $ 30 ... 234 3.9 30 and less than 40 ... 925 15.4 40 and less than 50 ... 19 0.3 50 and less than 75 ... 521 8.7 75 and less than 100 ... 19 0.3 100 and less than 150 ... 539 8.9 150 and less than 200 ... 5 0.1200 and over ... 433 7.2
6,005 100.0
These statistics of commitment for the non-payment of fines show that in 1921, 86 persons were imprisoned in Chicago for fines of less than $5; 940 for fines ranging from $5 to $10; 1,126 for fines ranging from $10 to $15, and 1,158 for fines ranging from $15 to $20. That is, taking the numbers cumulatively, 3,310 persons, over 55 per cent of the whole number, were sent to prison in Chicago in 1921 for fines of less than $20.
USE OF THE PROBATION SYSTEM:
[image:22.612.41.351.222.405.2]TABLE 18
T~tinber of Persons Convicted, Number Placed on Probation, and Per Cent of Convicted Persons Placed on Probation, Chicago, 1914-1921
Per Cent Total Number Placed Placed Year Number Convicted on Probation on Probation 1914 ... 50,630 4,696 9.3 1915 ... 46,987 3,629 7.7 1916 ... 36,766 3,763 10.2 1917 ... 46,670 4,554 9.7 1918 ... 35,185 3,922 11.1 1919 ... 32,461 4,657 14.2 1920 ... : ... 28,510 3,692 12.9 1921 ... : ... 40,267 2,417 6.0
This table shows that there was a significant decrease in 1921 in the number of persons placed on probation and in the per cent of convicted persons released on probation. This decline is to be deplored in view of the increase in the number of persons committed for the non-payment of fines and in the face of the increasing public confidence in the social value of the probation system which is felt in other communities. As to this point the report of the New York City Magistrates' Courts for 1920 in a discussion of the "value of effective probation work" contains the following statement:
Probation is not only the best way, but also the most economic way of dealing with delinquent§. Every man or woman saved from a life of criminality is a spiritual and economic gain to the community. This "reformatory without walls" saves the city a great deal of money each year and, instead of being an increased expense to the city, is in reality a great tax saver. The economic gain from improved probation will exceed in far greater proportion the increase in the appropriation. Finally, if probation saves men from further crime, it reclaims them from evil to good citizenship, it is, even at much cost, good economy in the truest sense of the word (p. 78).
"And a conservative English Departmental Committee has recently emphasized the same point. Thus, their report says:
It is hardly necessary for us to point out that probation is ex-tremely economical compared with the cost of keeping persons in prison.
. . . We do not advocate the use of probation merely because it is inexpensive, but we wish to lay great- stress on the considerable saving to public funds which is likely to follow from the use of probation in all suitable cases.14b
STATISTICS OF MURDER IN CHICAGO
The number of murders committed from year to year may be
expected to afford some evidence of crime conditions in the com-munity. It is, however, exceedingly difficult to say how many murders have been committed in any one year. That is, it is difficult to say how many cases of homicide should be called murders, how many
should be called cases of manslaughter, how many should be classified
as accidental homicides. Sometimes this cannot be decided until a jury comes to a decision; but, in general, after the prosecuting officials have studied the evidence a reasonably satisfactory conclusion will be
reached.
WHEN IS A MURDER A MURDER?
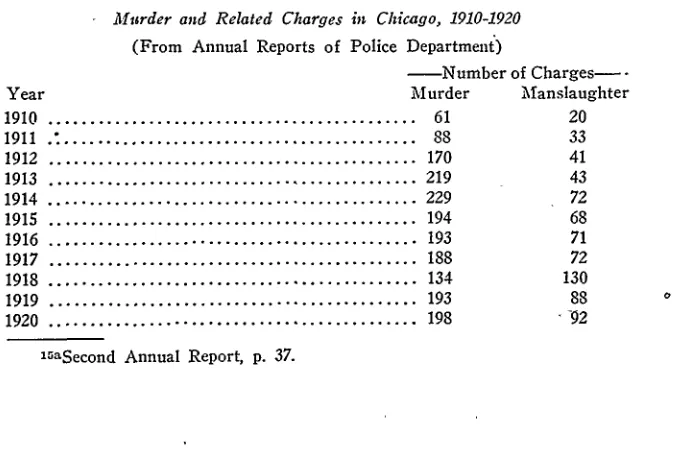
In 1920 the chief of police published in his annual report a list of
116 so-called "premeditated murders" in Chicago. In the same report in the statistics of arrests are 198 charges of murder and the Municipal
Court in 1920 disposed of 107 hearings in murder cases. The present Chicago "Crime Commission" reported 194 -murders in the same year.15a It should be explained that this so-called "Commission" is
not a public commission but merely an organization supported by
pri-vate funds.
TABLE 19
Murder and Related Charges in Chicago, 1910-1920
(From Annual Reports of Police Department)
-Number of
Charges-Year Murder Manslaughter
1910 ... 61 20 1911 .I ... 88 33
1912 ... 170 41 1913 ... 219 43 1914 ... 229 72 1915 ... 194 68
1916 ... 193 71 1917 ... 188 72 1918 ... 134 130 1919 ... 193 88
1920 ... 198 -92
[image:24.612.39.378.403.630.2]TABLE 20
Murder and Related Cases DisPosed of in the Municipal Court, 1910-1920
- Number of Cases Disposed of
Year Murder Manslaughter
1910 ... 137 22 1911 ... 116 25
1912 ... 87 40 1913 ... 103 46 1914 ... 120 43 1915 ... 100 42 1916 ... 131 39
1917 ... 107 38 1918 ... ... 79 78 1919 ... 135 41 1920 ... 107 64
TABLE 21
Premeditated Murders, Sentences to Hang, and Executions, 1915-1921
Premeditated Sentenced
Year ' Murders* to Hang* Hangedt
1915 ... 77 .. 1
1916 ... 105 2 1917 ... 91
1918 ... 95 1 4 1919 ... 154t 4 3
1920 ... 116 7 8 1921 ... 137 1
The murder statistics used by the Chicago "Crime Commission" differ from those just given. The "Crime Commission" has published in its reports statistics of the number of murders in Chicago as follows: In 1919, 330; in 1920, 194; in 1921, 190. The source of these extra-ordinary statistics is not given by the "Commission."
The "Crime Commission" triumphantly announced in 1921 that it was winning its fight against crime and a special bulletin (No.
14) issued October 6, 1920, was headed "Chicago's Murder Rate Drops." In this bulletin statistics were given purporting to show that the number of murders had fallen from 248 in the first eight months of 1919, to 112 in the first eight months of 1920. "The first eight months. of 1920, therefore," said the bulletin, "show 136 less murders than were recorded during the corresponding time last year." Of course, 1919 was the year of the race riots and the Commission did
*Compiled from Annual Police Reports. tFrom Daily News Almanac.
[image:25.612.63.380.90.386.2]not overlook this fact. They deducted 39 of the 1919 murders as
having occurred in connection with the race riots and then claimed
that "1920 still holds a cleaner slate over the 1919 period by 97
murders" (No. 14, p. 1).
This so-called "improvement" the Commission attributed to the
large number of hangings that had occurred and were in prospect.
Murder in Chicago [said the bulletin] is slowly but surely being
transformed from a. safe pleasure pursuit of criminals into an
ex-tremely hazardous occupation. -The legal requirement of "a-life for
a.
life" is at last being regarded in somber seriousness by the
under-world denizens
who
long considered it as merely a spicy risk flavoring
the carrying-out
of
their criminal enterprises. This is disclosed by the
Crime Commission's murder records for the first eight months of this
year. . . . And there are now fourteen convicted murderers
await-ing the hangman's noose in the County Jail, all of them sentenced
dur-ing the 1920 period to pay the extreme penalty for their crimes-a
record unparalleled in all Chicago's previous criminal history:
For this improvement in connection with the crime of murder in
Chicago, the Crime Commission is largely responsible, both because of
its activities in obtaining the machinery which has resulted in so many
convictions with the death penalty and because of its consistent and
con-tinuous efforts on behalf of law enforcement and in aid of public
officials charged with the suppression of crime.
(The day in which this bulletin went to press was described as)
a day which will be long remembered among members of the
profes-sional killer's fraternity of Chicago--a day of sternest warning to
them that the law no longer will tolerate the taking of human life in
this city with the laxity and delay in justice that has marked official
procedure in the past in dealing with murderers. On that day no less
than eight of the convicted murderers in the County Jail are scheduled
to expiate their crime on the gallows.
16HAVE
HANGINGS INCREASED THE NUiBER OF MURDERSAccording to the police statistics of "premeditated murders,""
however, there has been no such decline in the number of murders as
the statistics used by the so-called "Crime Commission" indicate. The
number of "premeditated murders" given in the police report for these
years is given below together with those used by the "Crime
Com-mission":
'
6Bulletin of the Chicago Crime Commission No. 14,
p.
1.
Murders in Chicago (Figures "Premeditated Murders" Used by Chicago
-(Chicago Police Dept.) 'Crime Commission")
1919 ... 154* 330t
1920 ... 116 194 1921 ... 137 190
Omitting the race riot murders, we have the following:
1919 ... 133 291
1920 ... 116 194 1921 ... 137 190
According to the police reports, the number of murders was
greater in 1921 than in 1919
o'r
in 1920. That is, instead of a
spec-tacular decline in murder as a result of the great increase in the
"number of hangings, the number of murders seems actually to have
increased. Eight men were hanged in the single year of 1920, as
many as -had been hanged during all the preceding five years together.
The Chicago "Crime Commission" believed that hanging would "drive
the murderers to cover," but the result was an increase in the number
of murders from 116 in 1920 to 137 in 1921.
In 1917 the Illinois Legislature passed a bill abolishing capital
punishment, which was vetoed by Governor Lowden. It is significant
that as a result the increase in the number of murders in the years
fol-lowing cannot be attributed, as it otherwise certainly would have been
by many people, to the fact that with hanging abolished the criminal
law was no longer sufficiently deterrent. The deterrent feature of the
law has been used to the limit, and murder has still increased. These
facts would seem indeed to reinforce the opposite theory that harsh
and brutal punishments tend to increase rather than to prevent crime.
That harsh punishments and the attending publicity tend to
in-crease crime was discovered 150 years ago by Blackstone and
Ben-tham in the eighteenth century, and in the first quarter of the
nine-teenth century their work was carried forward by Romilly and
Mack-intosh and the younger Peel, who abolished capital punishment for
scores of offenses and established the new principle that crime could
be more successfully prevented by an effective police system than by
hanging or branding or mutilating the criminals. Nearly a hundred
years have passed since Peel established that great organization
known
as the Metropolitan Police. In London life was made safe, property
protected, and crime in general prevented by abolishing the harsh
tions of the law on the one hand and substituting on the other an
efficient body of police.
It is worth while here to recall Blackstone's statement as to the
effect of harsh punishments, a statement that had so profound an
influ-ence upon the English lawyers of the late eighteenth and nineteenth
centuries.
In a well-known paragraph in the Comnmentaries
Black-stone referred to the fact that 160 offenses were then punishable by
death under the English law. Commenting on this, Blackstone said:
So dreadful a list, instead of diminishing, increases the number of
offenders. The injured, through compassion, will often forbear to
prosecute; juries, through compassion, will sometimes forget their
oaths, and either acquit the guilty or mitigate the nature of the
offense; and judges, through compassion, will respite one-half of the
convicts, and recommend them to the royal mercy. Among so many
chances of escaping, the needy and hardened offender overlooks the
multitude that suffer; he boldly engages in some desperate attempt,
to relieve his wants or supply his vices; and, if unexpectedly, the
hand of justice overtakes him, he deems himself peculiarly
unfor-tunate in falling at last a, sacrifice to those laws, which long impunity
has taught him to contemn.
STATISTICS OF MURDER IN LONDON
In the year 1920 there were in London 15 murders of persons
above the age of one year.
18With a population of 4,521,685, this is
at the rate of 3 murders per 1,000,000 population, in comparison with
73 in Chicago.
A further contrast between the London and the Chicago situation
is found in the method of dealing with such cases of murder as occur.
In 4 of the 15 cases of murder in London the murderer committed
suicide. In 9 of the remaining 11 cases, arrests were made, and the
cases were disposed of as follows: Convicted and sentenced, 3; found
insane, 5; acquitted, 1. In the case of the single acquittal, it was
admitted that the person had been guilty of the homicide though not
guilty of murder. There remained only 2 cases of murder in which
the murderer was not discovered by the police.
Contrast this situation with ours of Chicago. In 1920 there were
116 "premeditated murders" reported by the police. In 17 cases the
murderer either committed suicide or was killed himself. In 50 of
the remaining 99 cases no arrests were made, and the police, report
actually describes 53 cases as "unsolved."
In the 49 cases in which
arrests were made, 104 persons were arrested.
The disposition of
these cases during the course of the year was as follows: Hanged, 3;
under sentence to hang, 5; sentenced to Joliet, 21; sent to an insane
asylum, 1; acquitted, 17; no billed, nolle prossed, or stricken off, 32;
pending, 25.19
STATISTICS OF MURDER IN CANADA
Coming nearer home, we find statistics of murder in Canada also
very different from our own. For the years 1918, 1919 and 1920 the
total number of charges of murder in Canada, with the disposition,
were as follows:
TABLE 22
Chamrges of Murder in Canada, 1918-1920
-Number-1918 1919 1920 Acquitted ... 23 44 28
Detained for lunacy ... 7 7 3 Capital sentence ... 19 28 26
49 79 57
-Per Cent
Distribution-1918 1919 1920
46.9 55.7 49.1
14.3 8.9 5.3
38.8 35.4 45.6
100.0 100.0 100.0
Over a period of ten years, the quinquennial averages for murder
in Canada
2°were as follows:
Charges 1911-1915 ... 61.6 1916-1920 ... 58.0
Convictions
25.0 22.0
Executions 12.8
9.0
Percentage of Convictions to Total Number
of Charges 40.6
38.0
HOMICIDES COMMITTED 3Y THE POLICE
Some interesting statistics are published in the Chicago Police
Report showing the number of homicides committed by the police
themselves. These are all called "justifiable and excusable homicides,"
but it is open to question whether or not the shooting of five citizens
"accidentally" by the police officers should be considered "justifiable
and excusable."
The following table shows the classification by the
Police Department of the homicides in Chicago committed by the
members of the police force:
1 9
Data compiled from 1920 Report Chicago Police Department, p. 29.
2 0
[image:29.612.69.385.228.326.2]