BIROn - Birkbeck Institutional Research Online
Ballatore, Andrea (2019) A context frame for interactive maps.
In:
AGILE Conference on Geographical Information Science, 17-20 Jun 2019,
Limassol, Cyprus. (In Press)
Downloaded from:
Usage Guidelines:
Please refer to usage guidelines at
or alternatively
novel way. The source code and a demo of the framework are available online.
Keywords: confirmation of relative position, web mapping, cartography, map context, map interaction, marginalia
Source code & demo: https://github.com/andrea-ballatore/map-context-frame
1
Introduction
Interactive maps are a ubiquitous medium to search for and con-sume geographic information (Ballatore et al. 2016). Web maps, both on web browsers and increasingly on smartphone apps, en-able the visualisation and understanding of the surface of the Earth in a growing number of tasks, ranging from wayfinding to the spatial exploration of data for diverse domains, includ-ing transportation, logistics, urban planninclud-ing, climate science, and environmental management (Roth 2013, MacEachren 2004). Across all platforms, screen sizes, input modes, and technical implementations, the basic operations that enable map use in-clude zooming in, zooming out, and panning.
When interacting with digital maps, it is common to land in an unfamiliar area, for example when opening a Google Maps search result. To understand the location of an unfamiliar target area (e.g. Vicolo del Gallinaccio in Rome), users must refer to some known location (e.g. the Trevi Fountain or the Quirinal Palace). As the context of the area shown in the map remains off-screen, users unfamiliar with an area must perform some op-erations for positioning what they are looking at. In their work on sequences of map operations, Hiramoto & Sumiya (2006) identifyconfirmation of relative positionas a sequence of zoom out and zoom in operations aimed at locating known objects and landmarks.
Figure 1 shows an example of relative positioning of an Ital-ian town with respect to larger and better-known cities. As a way to acquire contextual information, relative positioning is cogni-tively complex and time-consuming. It requires a large scale transition across zoom levels (from urban level to country level and back), as well as a repositioning operation, in which it is possible to lose track of the target area, unless explicitly marked.
The remainder of this article proposes a novel, generic frame-work to support the relative positioning task. The JavaScript source code and a demo of the framework are available online1 under a Creative Commons license. The framework enables the creation of a context frame around the visible part of the map that refers to objects outside of it, allowing for positioning, reducing the need for zooming operations. To populate the context frame, the approach selects and places objects using a hybrid strategy. The approach is illustrated using cities as notable objects on a web mapping prototype.
2
Related work: The map context
The display of information in interactive maps has attracted con-siderable research over the past 20 years in human-computer interaction and GIScience, building on classic work in cartog-raphy (MacEachren 2004, Roth 2013). Much cartographic re-search focusses, understandably, on what is visible in the map. However, representing what is missing is equally important, and attracts attention to the crucial problem of the map’s representa-tional limitations and arbitrary omissions (Robinson 2019).
Some approaches come to mind to tackle the lack of spatial context in maps, whose margins mark an arbitrary end to the continuous surface of the planet. Overview maps are commonly used as navigational aids, showing the context of the target area in a smaller map. While being common in interactive maps, they show limited benefits in empirical evaluations (Hornbæk et al. 2002), also because of the constrained amount of information that can be displayed. Visual cues about targets outsides the
1https://github.com/andrea-ballatore/map-context-frame (All URLs were
AGILE 2019 A Context Frame for Interactive Maps
Figure 1: An example of relative positioning. The target area is on the left (an Italian town called Avigliana), covering about 2.5 km2. The reference area on the right shows a much larger area that contains the target (about 180 km2). When the user is presented with the figure on the left and does not know the location of the target, it is necessary to perform relative positioning: The user (1) zooms out, (2) locates the target with respect to known objects (e.g. Turin, Milan, and Genoa), and (3) zooms back in. Sources: Leaflet (map), ESRI (map tiles).
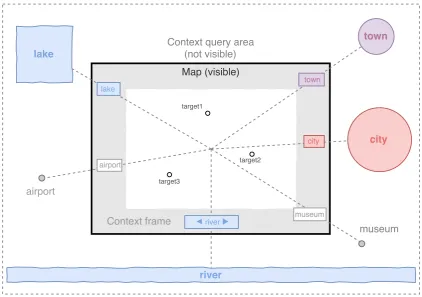
Figure 2: A schematic overview of the context frame, showing the map with some targets of interest (e.g. target1, target2, and
[image:3.595.86.509.374.671.2]the dawn of web mapping, Suzette Miller (1999) classifies ele-ments at the margin of digital maps asspatial marginalia(scale bars, scale, and North arrow),manipulaton marginalia(panning and zooming buttons), andnavigation marginalia (title, cover-age, and time frame). All these marginalia purport to provide spatial, temporal, and thematic context to the map user.
While panning and zooming remain central operations with maps (You et al. 2007), interactive cartography has recently con-verged to two dominant models: (i) mouse to pan and mouse wheel or buttons to zoom, and (ii) touch interfaces, in which pan-ning can be performed with one finger and zooming with a pinch gesture. Without belittling the achievements of ubiquitous, web-based and smartphone-web-based cartography (Gartner et al. 2007), it can be argued that the problem of the lack of context has wors-ened in the last decade. The possibility of rapid movements on the map and constrained screen sizes result in frequent disorien-tation, where small portions of the planet are presented to users without appropriate contextual cues. The context map frame dis-cussed in this article aims at mitigating this old problem. To the best of my knowledge, no example comparable to the proposed approach can be found in commercial mapping systems and in research projects.
3
Computing the context frame
The context frame aims at supporting the positioning of the map content relative to known geographical objects. To enable a smoother relative positioning, this framework is designed to se-lect and displayspatial cuesaround the map, reducing the need for zooming and panning operations. An overview of the frame-work is depicted in Figure 2, showing the visible and non-visible parts of the geographic space.
In order to operationalize this idea, the framework needs a strategy for the selection ofnotable objects. Notable objects conceptually overlap with landmarks, and must be known to the user as spatial anchors (Caduff & Timpf 2008). Unlike land-marks, however, the purpose of these objects is to support map interpretation and interaction, and not wayfinding. Depending on the application domain, notable objects can include diverse geographic features at different scales, such as cities, buildings, and airports, as well as political entities. Using geographic
in-2https://web.archive.org/web/20170309065423/https://www.chazen.wisc.edu/
images/uploads/Files/Marginalia_in_cARTography_F.pdf
forproperty p∈ob jdo
pob j←apply weighting function fp;
//rank objects
forob j∈GSdo
rd←rankob jby decreasing distancedob j;
forproperty p∈ob jdo
rp←rankob jby increasingpob j;
ob joverall rankr←weighted combination ofrdand
allrpusingWdandWp;
//place spatial cues
context frame boundsF←reduceBby factorx; set of cuesC←/0;
forob j∈GSsorted by rdo
linel←trace line betweenob jand map centre;
locc←find intersection betweenFandl;
forcue c∈Cdo
ifdistance(locc,c)>mthen
cob j←new cue forob jatlocc;
add cuecob jtoC;
formation retrieval (GIR) principles, it is possible to estimate the relevance of objects (De Sabbata & Reichenbacher 2012).
The approach starts by selecting all notable objects falling within a query area and not within the map bounds. The ob-jects are then ranked from the most to the least salient, based on a set of properties, such as distance from the map centre and object properties (e.g. object area, city population, or airport passengers). These aspects are combined into a single ranking, prioritising different facets based on weights. The system starts to place a spatial cue in the context frame for each object, avoid-ing collisions. Collisions are detected when two cues are closer than a minimum distance between cues, expressed in screen pix-els. Graphically, the spatial cue includes a line that indicates the specific direction from the map to the notable object. The com-putation stops once the context frame is filled.
AGILE 2019 A Context Frame for Interactive Maps
Figure 3: Context frame around Avigliana, in North-Western Italy, showing cities with the country code. The selection combines city distance and population (wd=.8,wp=.2). When clicking on a contextual cue, the map pans to it. Sources: Leaflet (map),
ESRI (map tiles).
properties (Wd+∑Wp=1). The line lis traced between the
centre of the map and the closest point belonging to the object. A suitable shrinking factor to calculate the context frame bounds isx=.8. Finally, 80 pixels was found to be an appropriate min-imum distancem.
4
An Italian case study
To illustrate the functioning of the framework, this section presents a case study on real-world data, based on the relative positioning example in Figure 1. The set of input geographic objects include cities with more than 30,000 inhabitants,3 repre-sented as points, and countries, reprerepre-sented as polygons.4 The
computation was carried out with the web prototype. The rank-ing of the notable objects was controlled by three parameters: (1) geodesic distance from the map centre, (2) population for cities, and (3) area for countries.
Table 1 shows the top-ranked objects based on these parame-ters, showing the difference between individual parameters and their combination. Empirically, the most meaningful results are obtained with a combination of distance and the other parameter: Distance alone prioritises close objects that might be too small to be known, while population and area alone tend to prioritise known objects that might be very far. An instance of the con-text frame in the user interface is shown in Figure 3, with cities as input objects. The spatial cues include geodesic distance in km. In this instance, meaningful results occur when distance is prioritised over population (wd=.8,wp=.2).
3Source: https://simplemaps.com/data/world-cities 4Source: https://github.com/johan/world.geo.json
5
Conclusion and outlook
This article outlined a generic framework to select and present spatial cues to map users. This approach supports map usage, re-ducing the need for zooming operations for relative positioning. Future research will focus on formal evaluations of the approach, relying on user testing to identify design limitations and possible improvements in the algorithm and user interface. Several tasks and use cases can be explored to ascertain to what extent the con-text frame supports users in the interpretation of the geographic content of the map, also exploiting visual variables that are fixed in the current version, such as cue colour and size.
The selection of notable objects is indeed an application- and task-dependent operation, and more case studies are needed to identify optimal parameters for the core algorithm. While the parameter values in the case study appear to perform reason-ably well, a systematic evaluation is needed to provide scien-tific grounding. The ranking process will be evaluated with different combinations of parameter weights. Testing of algo-rithm variants is needed to ascertain which parameters look more promising across geographical locations. Different, richer input datasets can be harvested through APIs to identify potential no-table objects, such as Wikipedia and GeoNames.
Czech Republic
Countries Turkey, Ukraine, France, Spain,
Area Germany, Poland, United Kingdom, Romania, Belarus, Tunisia
Countries France, Spain, Germany, Austria,
[image:6.595.67.288.98.363.2]Dist.+area Poland, United Kingdom, Switzerland, Czech Republic, Ukraine, Tunisia
Table 1: An example of variants of selection of notable objects. The target area is Avigliana, located in North-Western Italy, with equal weighting between feature distance and properties (wd=
.5,wp=.5).
frame. Do users acquire more configural knowledge about the geographic space with or without the context frame? What are the effects of different weights on the parameters? Are some types of notable objects more effective in spatial learning? In this cognitive direction, personalization (Ballatore & Bertolotto 2015) is likely to improve the effectiveness of the context frame, weighing the prominence of notable objects based on individual preferences.
Acknowledgements. I wish to thank Gavin McArdle (Univer-sity College Dublin) for his feedback on a very early iteration of this idea. The web prototype was built on a number of resources, including the Leaflet JavaScript library (and derived libraries), map tiles from ESRI, and open datasets about coun-tries and cities from https://github.com/johan/world.geo.json and https://simplemaps.com/data/world-cities.
tion Science34(4), 247–257.
Hiramoto, R. & Sumiya, K. (2006), Web information retrieval based on user operation on digital maps,in‘Proceedings of the 14th Annual ACM International Symposium on Advances in Geographic Information Systems’, ACM, pp. 99–106. Hornbæk, K., Bederson, B. B. & Plaisant, C. (2002),
‘Naviga-tion patterns and usability of zoomable user interfaces with and without an overview’,ACM Transactions on Computer-Human Interaction (TOCHI)9(4), 362–389.
Jakobson, G. & Rueben, S. L. (2013), ‘Method and system for displaying navigation information and mapping content on an electronic map’. US Patent 8,478,527.
MacEachren, A. M. (2004),How Maps Work: Representation, Visualization and Design, Guilford Press, New York. Miller, S. (1999), Design of multimedia mapping products,in
W. Cartwright, M. Peterson & G. Gartner, eds, ‘Multimedia Cartography’, Springer, Berlin, pp. 51–63.
Münzer, S., Zimmer, H. D. & Baus, J. (2012), ‘Navigation assis-tance: A trade-off between wayfinding support and configural learning support’,Journal of Experimental Psychology: Ap-plied18(1), 18–37.
Robinson, A. C. (2019), ‘Representing the presence of absence in cartography’,Annals of the American Association of Geog-raphers(in press).
Roth, R. E. (2013), ‘Interactive maps: What we know and what we need to know’, Journal of Spatial Information Science
6, 59–115.