Munich Personal RePEc Archive
Economic Reform and Economic
Performance: Evidence from 20
Developing Countries
White, Howard and Leavy, Jennifer
Institute of Development Studies, University of Sussex
2000
Online at
https://mpra.ub.uni-muenchen.de/6594/
E C O N O M I C R E F O R M A N D E C O N O M I C
P E R F O R M A N C E :
E V I D E N C E F R O M 2 0 D E V E L O P I N G C O U N T R I E S
*I D S D I S C U S S I O N P A P E R 3 7 6
H o w a r d W h i t e a n d J e n n i f e r L e a v y
SUMMARY
Do adjustment policies assist or retard growth? This paper presents data on economic performance
(aggregate and sectoral growth, inflation, investment and external account) for 20 countries. The data are
classified on an annual basis according to the country’s policy stance in that year: controlled economy,
partially or fully liberalised. This approach allows both control-group and before-versus-after analyses which
are combined with a review of growth regressions and an analysis of case study material on adjustment. The
evidence suggests three hypotheses. First, countries with controlled economies have performed badly
compared with those which have moved towards greater market orientation. Second, economic performance
does not differ greatly between fully-fledged market economies and partially liberalised ones: partly because
several countries have pursued liberalisation with no improvement in performance. Third, given that there is
little difference in manufacturing and agricultural growth between full and partial liberalisers yet overall
growth is more rapid for the former, the additional growth must be in the service sector. These hypotheses
suggest that the balance between state and market should be tilted more toward the market than is currently
supported by international development agencies.
* This paper is based on a background report on the impact of adjustment (White and Leavy, 1999) for the global
Copyright © Institute of Development Studies, 2000
CONTENTS
1 Introduction 5
2 Policy Reform in Developing Countries: An Overview 6
3 Economic Impact of Adjustment Policies 8
3.1 Overview 8
3.2 Growth 10
3.3 Inflation 14
3.4 Investment 15
3.5 External account and debt 18
3.6 Agricultural supply response 20
3.7 De-industrialisation? Manufacturing performance under adjustment 24
4 Lessons for the Design of Adjustment Policies 28
TABLES AND FIGURES
Figure 1 Average policy score for 20 countries 7
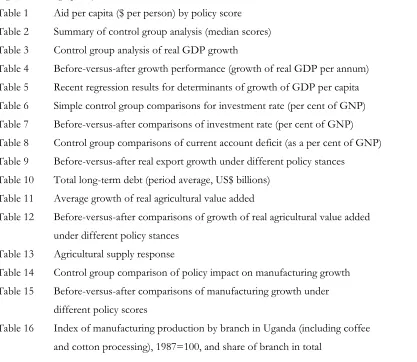
Table 1 Aid per capita ($ per person) by policy score 8
Table 2 Summary of control group analysis (median scores) 9
Table 3 Control group analysis of real GDP growth 10
Table 4 Before-versus-after growth performance (growth of real GDP per annum) 11
Table 5 Recent regression results for determinants of growth of GDP per capita 13
Table 6 Simple control group comparisons for investment rate (per cent of GNP) 16
Table 7 Before-versus-after comparisons of investment rate (per cent of GNP) 17
Table 8 Control group comparisons of current account deficit (as a per cent of GNP) 17
Table 9 Before-versus-after real export growth under different policy stances 18
Table 10 Total long-term debt (period average, US$ billions) 20
Table 11 Average growth of real agricultural value added 20
Table 12 Before-versus-after comparisons of growth of real agricultural value added
under different policy stances 22
Table 13 Agricultural supply response 23
Table 14 Control group comparison of policy impact on manufacturing growth 25
Table 15 Before-versus-after comparisons of manufacturing growth under
different policy scores 26
Table 16 Index of manufacturing production by branch in Uganda (including coffee
1 INTRODUCTION
Over the last two decades adjustment policies - that is a move toward a more market-based development
strategy - have been implemented in virtually all developing countries.1Yet the debate has continued as to the
economic impact of these policies: do they assist or retard growth? Part of the reason for the failure to
resolve the debate has been methodological. In particular, many studies have defined ‘adjustment’ as having
an adjustment loan from the World Bank. Of course, what really matters is policy stance; many countries
which have followed broadly market-based development strategies for many years (such as Botswana and
Mauritius) have had no need of adjustment lending. Other countries, most notably Vietnam but also
Nicaragua in the late 1980s, have introduced reform policies but been denied access to World Bank finance
for political reasons. Meaningful analysis of the impact of economic reform policies must be based on a
country’s policy-orientation rather than its sources of external finance.
A second methodological problem has been the difficulty of establishing the counterfactual. Four
approaches are available: before-versus-after, control group, modelling (including regression analysis) and
case studies. All of these approaches have short-comings2 so that the best that can be done is to combine the
different approaches to examine if they give similar messages.
This paper thus presents evidence from 20 developing countries.3The material presented here is drawn
from the recently completed evaluation of Swedish support for economic reform, being based mainly on the
background paper on the impact of adjustment (White and Leavy 1999), which is in turn based on the eight
country studies4 and additional data gathered on all Swedish programme countries5 (i.e. those on which
Swedish aid is concentrated). This sample has some bias toward Africa, but also a reasonable cross-section of
Asian countries. As explained in the next section, data were collected on macro-economic variables for all 20
countries and classified on an annual basis according to the country’s policy stance in that year.6 These data
were used for control-group and before-versus-after analysis. These results are supplemented by a review of
growth regressions and analysis of case study material on adjustment for each of the 20 countries.
1 There are many works plotting the course of adjustment. The general reader is referred to the excellent introductory text by Lensink (1996). Other recent reviews include Engberg-Pedersen (1996) and Harvey (1996). 2 The definitive discussion of the first two being Goldstein and Montiel (1986), but see also more accessible
treatments in Mosley et al. (1991) and White (forthcoming).
3 Angola, Bangladesh, Botswana, Cape Verde, Eritrea, Ethiopia, Guinea-Bissau, India, Kenya, Lao PDR, Mozambique, Namibia, Nicaragua, South Africa, Sri Lanka, Tanzania, Uganda, Vietnam, Zambia, Zimbabwe. 4 These are Bangladesh (van Donge and Dijkstra 1999), Cape Verde (White and Leefmans 1999), Mozambique
(White 1999b), Nicaragua (Dijkstra 1999a), Tanzania (van Donge and White 1999), Uganda (Ddumba-Ssentamu et al. 1999), Vietnam (van Donge et al. 1999) and Zambia (White 1999c). The main report is White (1999a) and there is also a background paper on conditionality (Dikjkstra 1999b). All reports can be accessed through www.sida.se/programaidevaluation. These reports are not acknowledged throughout the paper although they are drawn on frequently. Other useful sources of background information have been the country reports of the Economist Intelligence Unit.
5 These data are mostly taken from the World Bank’s World Development Indicators CD-Rom.
Section 2 begins with an overview of policy reform in developing countries before moving in Section 3
to a presentation of the results dealing with overall growth, inflation, investment and sectoral growth in
agriculture and manufacturing. Section 4 concludes on the appropriate design of adjustment.
2 POLICY REFORM IN DEVELOPING COUNTRIES: AN OVERVIEW
Adjustment can mean many things7 but in the discourse of international development agencies it means
economic reform toward a market-based development strategy. During the last two decades all developing
countries, with the exceptions of Cuba, Myanmar and North Korea, have taken steps toward economic
liberalisation. But these changes have begun at different times and resulted in a variety of results and
reactions. Nonetheless, based on an analysis of six African countries, Engberg-Pedersen et al. (1996) distinguish three stages of adjustment: (1) stabilisation, agricultural price reform and some trade liberalisation;
(2) internal trade liberalisation, investment promotion and social dimensions of adjustment; and (3) public
sector reform, beginning with the banking sector and civil service, and social expenditure rationalisation.
The experience of the 20 countries analysed in this paper bears out the comments in the last paragraph.
Whilst there is quite a diversity of experience of economic policy reforms, and the main thrust of reform has
begun at different times, all countries have undertaken market-based reform during the last two decades.
Reform has been least in those countries, such as Botswana and Namibia, which already had relatively
non-interventionist policies. Moreover, the sequencing suggested by Engberg-Pedersen et al. (1996) has been roughly followed, though with some departures. It is certainly the case that tariff reform and agricultural price
liberalisation have led the reforms, along with some change in exchange rate policy (devaluation and the
opening of some market-oriented forex windows). Stabilisation is not so straightforward; it has been
attempted at the outset of adjustment but not always successfully, or has been established and then lost. It is
certainly the case that privatisation and public sector reform come at the tail end of the reforms and have not
been carried out in all countries (especially public sector reform).
As for the timing of reform there is something of a regional pattern, albeit with significant exceptions.
Asian countries have begun reform earlier (Sri Lanka in 1977 and Vietnam two years later; both Bangladesh
and India relaxed controls somewhat in the 1980s, although in both cases more intensive reform began in
1991). Many African countries have begun serious reform only in the 1990s, but again there are many
exceptions (Kenya, Mozambique, Tanzania and Uganda, plus the aborted reform attempted by Zambia in the
mid-1980s). A point which has perhaps received insufficient attention is that many countries began reforms
under their own initiative prior to the involvement (certainly prior to the formal involvement) of the
international development community. Part of the importance of this point is that it highlights the centrality
of domestic political forces to policy dynamics. Of the eight countries studied in more detail this was the case
in six: Bangladesh has received little formal adjustment lending during much of its period of reform; in both
Cape Verde and Nicaragua a formerly-socialist government began the move to the market which was later
intensified after a change in government (the shift was in response to crisis in Nicaragua, but in Cape Verde it
was motivated by both domestic political pressures and those from the substantial Cape Verdian diaspora); in
Mozambique, Tanzania and Vietnam formerly socialist governments began liberalisation and have continued
with it when external support was finally received. The exceptions are Uganda and Zambia (though the
former is often noted for the extent of domestic political commitment to reform). Although these early
programmes are sometimes characterised as half-hearted or failed reform (e.g. Tanzania 1984-86), they did
undertake the early stages of reform such as agricultural liberalisation, which can be argued to have laid the
basis for later efforts.
Policy scores have been devised based on the degree of reform of the exchange rate, trade, price policy,
finance, fiscal policy, private sector development, privatisation and public sector: 0 corresponding to no
reform (controlled economies), 1 to weak reform (partially liberalised) and 2 to strong reform (more
market-based, though not in all respects a fully-fledged market economy) for each country. Whilst there will be some
element of arbitrariness in any such scoring system the use of a small number of categories reduces this
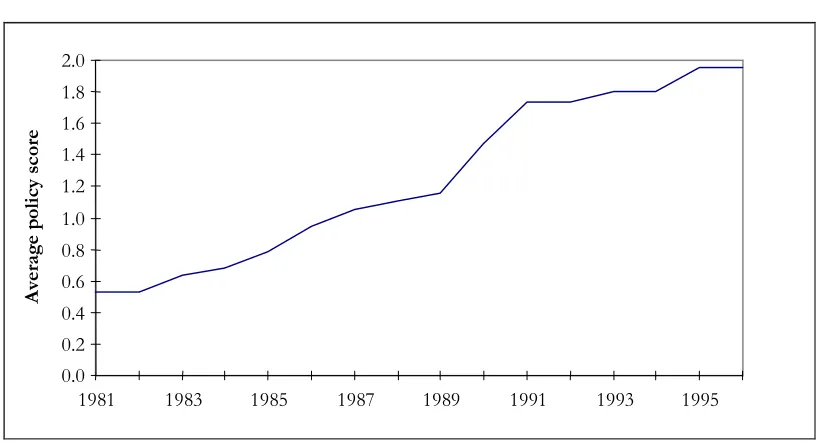
problem. Figure 1 shows the average score across the 20 countries since 1981, giving a strong pictorial
confirmation of the trend toward reform. There has been a continuous increase in the average policy score,
with a sharp incline in 1990 and 1991, when several countries intensified their reform efforts. We are not
implying that a higher score is ‘better’ - that is subject for analysis in this paper - only that countries have
become more market oriented.
F i g u r e 1 A ve r a g e p o l i c y s c o r e f o r 2 0 c o u n t r i e s
0.0 0.2 0.4 0.6 0.8 1.0 1.2 1.4 1.6 1.8 2.0
1981 1983 1985 1987 1989 1991 1993 1995
A
ve
ra
ge
p
o
li
cy sc
o
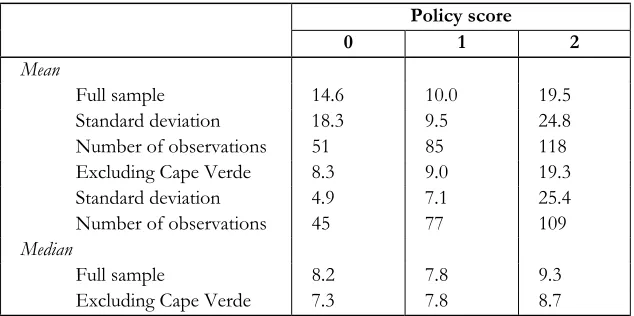
[image:8.595.93.503.416.637.2]T a b l e 1 A i d p e r c a p i t a ( $ p e r p e r s o n ) b y p o l i c y s c o r e
Policy score
0 1 2
Mean
Full sample 14.6 10.0 19.5
Standard deviation 18.3 9.5 24.8
Number of observations 51 85 118
Excluding Cape Verde 8.3 9.0 19.3
Standard deviation 4.9 7.1 25.4
Number of observations 45 77 109
Median
Full sample 8.2 7.8 9.3
Excluding Cape Verde 7.3 7.8 8.7
This paper will often compare indicators for countries with different policy scores. Table 1 provides the
example of aid per capita. The averages (both mean and median) shown here are calculated across all
available observations, so a country can enter the data set up to 16 times (the data cover 1981-96) though, of
course, it will appear in a different column depending on its policy score for that year. Where the mean and
median differ too greatly then the median is the better measure, alternatively influential points may be
dropped from the data, as is also done in the case of Cape Verde here. Given the higher aid per capita of
Cape Verde it is perhaps best to focus on the mean aid excluding that country. It can be seen that countries
with a policy score of 2 receive on average over twice as much aid as those with policy scores of 0 or 1,
though the median shows a much lower progression. It may be surprising that average aid is higher for 0 than
for 1. This result is partly explained by the fact that bilateral conditionality came in during the 1980s, so that
poor performers could still get high aid in the early part of the decade. But once conditionality started, many
of the home grown reform efforts (e.g. Cape Verde 1987-91, Mozambique 1983-86, Tanzania 1984-86 and
Nicaragua 1988-89, which all receive a policy score of 1) were not rewarded by the international community.
Aid flows only resumed once an International Financial Institution (IFI)-backed programme was started.
3 ECONOMIC IMPACT OF ADJUSTMENT POLICIES
3.1 Overview
Table 2 presents a summary of the main results from the control groups analysis, which are explored in more
detail below. Three hypotheses suggest themselves from these data. First, countries with controlled
economies have performed badly in comparison with those that have moved to greater market orientation.
Countries ranked with a policy score of 0 perform worse on all indicators, other than agricultural growth,
than those with scores of 1 or 2.8 Second, economic performance does not differ greatly between
fully-fledged market economies and partially liberalised ones. With the exception of exports and, to a lesser extent,
[image:9.595.140.457.87.245.2]
overall growth, there is no difference in performance between countries ranked with policy scores of 1 and 2.
This finding is partly explained by the fact, documented below, that some countries which have carried out
quite far-reaching reforms have seen little impact on their growth rates. The third hypothesis follows from
noting that there is little difference in agricultural or manufacturing growth between group 1 and group 2.
Since overall growth has been more rapid under policy score 2, this additional growth must have come from
the service sector. Analysis of the contribution to growth of the different sectors in liberalising economies
bears this out: Sowa and White (1996) show that half of Ghana’s growth in the decade from 1983 was
attributable to the service sector.
T a b l e 2 S u m m a r y o f c o n t r o l g r o u p a n a l ys i s ( m e d i a n s c o r e s )
Policy score
0 1 2
Growth 1.7 3.8 4.9
Inflation 30.2 13.0 11.8
Investment rate 15.3 21.8 21.4
Export growth -1.1 4.9 7.8
Agricultural growth 3.4 3.1 2.9
Manufacturing growth 0.0 4.5 4.7
Surprisingly little attention has been paid to whether this dominance of the service sector is a ‘good
thing’ or not. Following liberalisation, growth in services follows on naturally from, and is a reflection of,
development of the retail sector. A growth in market-based services such as trading networks is a necessary
part of the establishment of a liberalised economy. But it may be a cause for concern for two reasons. One is
that economies at this level of development need growth from the productive sectors. If an economy is only
trading and not producing, then such growth is not likely to be sustainable. Second, the pattern of growth
matters greatly for the distribution of the benefits of that growth. In most developing countries the majority
of the poor live in rural areas9so it may well be thought that agricultural growth is a necessary component of
poverty reduction. On the other hand, Bryceson (1999) argues there has been a de-agrarianisation of rural
areas,10 so that the growth of services may well be a good thing.
[image:10.595.124.471.257.366.2]
3.2 Growth
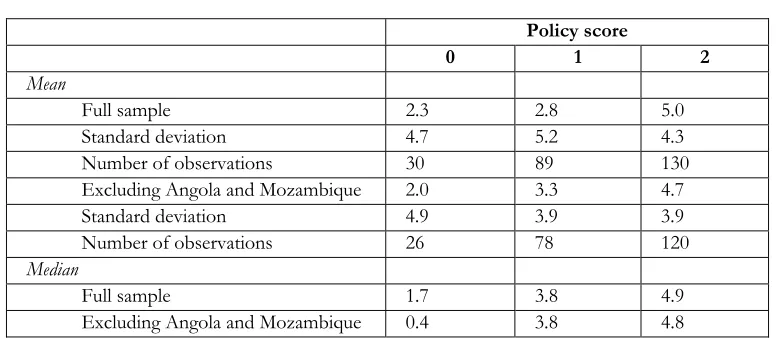
The data presented in Table 3 show that growth performance has been stronger the greater the degree of
reform in the programme countries. This result holds for both the full sample of 20 countries (or, more
precisely, all countries for which data are available) and once the ‘conflict countries’ - Angola and
Mozambique - are dropped from the sample. Moreover, the result is found whether the mean or the median
is used as the measure of average performance. Moreover, countries with policy score 2 perform significantly
better than non-reformers: the t-statistic for the difference in means between 2 and 1 is 3.31 and that for 2
and 0 is 2.88. Non-reforming countries grew at around 2 per cent, i.e. close to, but for most countries just
below, population growth, thus indicating declining per capita income. By contrast strong reformers grew at 5
per cent.
T a b l e 3 C o n t r o l g r o u p a n a l ys i s o f r e a l G D P g r o w t h
Policy score
0 1 2
Mean
Full sample 2.3 2.8 5.0
Standard deviation 4.7 5.2 4.3
Number of observations 30 89 130
Excluding Angola and Mozambique 2.0 3.3 4.7
Standard deviation 4.9 3.9 3.9
Number of observations 26 78 120
Median
Full sample 1.7 3.8 4.9
Excluding Angola and Mozambique 0.4 3.8 4.8
A related issue is the employment effects of reform: the UNDP has raised the question of ‘jobless
growth’. Whilst such growth is just another way of stating higher productivity some authors have raised
concerns at how little employment is being generated. Krishnan et al. (1998) argue that the labour market in Ethiopia has been unresponsive to reforms despite impressive GDP growth and that there are queues of
educated unemployed. South Africa has been experiencing negative employment elasticities as employment
has fallen, despite rising output.11
The data in Tables 2 and 3 are simple control group comparisons; we are comparing adjustment with
non-adjustment (between different countries and different periods for the same country) without any
reference to other factors. Table 4 presents a before-versus-after analysis, which does control for country
specific, but not other, factors. Here a less strong picture emerges, though there are several countries -
Mozambique, Uganda, Vietnam - which are experiencing stronger growth with reform (add to this list
Botswana, which has had sustained high growth having maintained relatively liberal policies throughout). But
the South Asian countries - Bangladesh, India and Sri Lanka - have all maintained comparable growth rates
[image:11.595.104.493.288.457.2]
regardless of policy stance, indeed they are lower in the case of Bangladesh and India12 (the same is true of
Lao PDR). Nicaragua has experienced only modest recovery (compared to the 1980s as a whole, not the
crisis at the end of the decade), Cape Verde and Zimbabwe show little change in performance and Zambia
has declined (relatively and absolutely). Thus it seems that some countries have experienced growth with
reform, whereas others have not. The regression literature offers some explanation as to why this may be so.
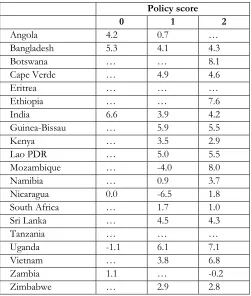
T a b l e 4 B e f o r e - ve r s u s - a f t e r g r o w t h p e r f o r m a n c e
( g r o w t h o f r e a l G D P p e r a n n u m )
Policy score
0 1 2
Angola 4.2 0.7 …
Bangladesh 5.3 4.1 4.3
Botswana … … 8.1
Cape Verde … 4.9 4.6
Eritrea … … …
Ethiopia … … 7.6
India 6.6 3.9 4.2
Guinea-Bissau … 5.9 5.5
Kenya … 3.5 2.9
Lao PDR … 5.0 5.5
Mozambique … -4.0 8.0
Namibia … 0.9 3.7
Nicaragua 0.0 -6.5 1.8
South Africa … 1.7 1.0
Sri Lanka … 4.5 4.3
Tanzania … … …
Uganda -1.1 6.1 7.1
Vietnam … 3.8 6.8
Zambia 1.1 … -0.2
Zimbabwe … 2.9 2.8
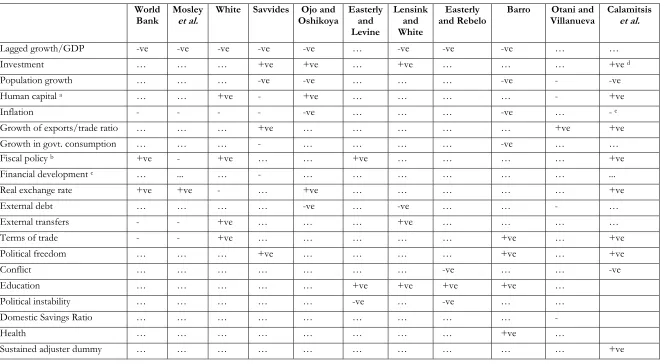
Studies broadly confirm the view that policy reforms are beneficial to growth (see Table 5). However, so
are other factors such as human capital. Moreover, as elaborated in Lensink and White (1999a), some
reservations must be made with respect to such studies. One of these is that there are reasons for thinking
that inflation has a non-linear relationship with growth:13 whilst high inflation is bad for growth, it is likely
that once it reaches a certain level then further reductions in inflation may even be bad for growth. Empirical
support for this view depends on how ‘a certain level’ is defined:14 Levine and Zervos (1993) find this effect
with a cut off of 40 per cent (but the opposite if it is put at 80 per cent). The mechanisms by which excessive
12 Guhan and Nagaraj (1995) examine the employment impact of stabilisation by looking at sectoral or GDP growth rates and assumed employment elasticities, suggesting that over the years 1992-93 the unemployment increase of 8 million was double that than if the pre-stabilisation growth rate had continued (1995: 10).
13 See Roemer (1996: 432-43).
[image:12.595.173.424.220.516.2]stabilisation damages growth are quite clear: deflation drives down demand for domestic output15and lack of
investment in human and physical capital undermines the supply response. Some countries that have enjoyed
a good response (Ghana and Sri Lanka) have done so by expanding spending at the same time as
liberalisation, whereas in several countries (Zambia and Mozambique in the first part of the 1990s) it has
been argued that spending limits have constrained growth. Uganda has recently persuaded the IMF to relax
its spending limits, which many would agree is a necessary step to sustaining that country’s growth.
T a b l e 5 R e c e n t r e g r e s s i o n r e s u l t s f o r d e t e r m i n a n t s o f g r o w t h o f G D P p e r c a p i t a
World Bank
Mosley et al.
White Savvides Ojo and Oshikoya
Easterly and Levine
Lensink and White
Easterly and Rebelo
Barro Otani and Villanueva
Calamitsis et al.
Lagged growth/GDP -ve -ve -ve -ve -ve … -ve -ve -ve … …
Investment … … … +ve +ve … +ve … … … +ve d
Population growth … … … -ve -ve … … … -ve - -ve
Human capital a … … +ve - +ve … … … … - +ve
Inflation - - - - -ve … … … -ve … - e
Growth of exports/trade ratio … … … +ve … … … +ve +ve
Growth in govt. consumption … … … - … … … … -ve … …
Fiscal policy b +ve - +ve … … +ve … … … … +ve
Financial development c … ... … - … … … … … … ...
Real exchange rate +ve +ve - … +ve … … … … … +ve
External debt … … … … -ve … -ve … … - …
External transfers - - +ve … … … +ve … … … …
Terms of trade - - +ve … … … … … +ve … +ve
Political freedom … … … +ve … … … … +ve … +ve
Conflict … … … … … … … -ve … … -ve
Education … … … … … +ve +ve +ve +ve …
Political instability … … … … … -ve … -ve … …
Domestic Savings Ratio … … … … … … -
Health … … … … … … +ve …
Sustained adjuster dummy … … … … … … +ve
Key: +ve significant positive effect; -ve significant negative effect; - insignificant; … not included in regression.
Notes: Dependent variable is growth turnaround for first three studies and growth for the remainder; (a) see papers for definitions of variables; (b) measure of fiscal balance and revenue collection, +ve indicates deficit is harmful for growth; (c) Ratio of quasi liquid liabilities of the financial system to GDP; (d) public and private investment included separately and both significant; (e) regression also includes standard deviation of inflation, which is also insignificant.
[image:14.842.93.759.85.449.2]However, these findings do not lead us to an unambiguous support for adjustment policies
for four reasons. First, ‘good policies’ are being measured largely by stabilisation rather than
adjustment (i.e. market-based reforms). The sustained adjuster dummy used by Calamitsis et al.
(1999) represents staying on track with an IMF programme. Openness is shown to be a good
thing, but openness is not equivalent to market liberalisation, as the experience of the East Asian
economies shows. Second, the expanded regression equations illustrate the importance of human
capital and the relationship between adjustment policies and human capital is contentious.
Similarly, all studies (which include it) find investment to be important, but as the World Bank
has admitted in several places and is discussed below, there is no positive impact between
adjustment policies and investment. Third, the use of period averages does not help get at the
issue of whether the observed growth is short or long run. The examination of the latter using
growth regressions would require a model which utilised long lags, whilst controlling for short
run determinants of current growth. Alternatively, the impact of adjustment on variables
considered crucial for long run growth may be examined. Of these factors stabilisation and
investment are considered below. Finally, there has been a long-standing critique of cross-country
regression, based on problems of simultaneity (e.g. inflation may depend on growth), lack of
robustness and structural instability. Hence, whilst the results may be of some interest, they
should not be the sole source of guidance on policy issues.
3.3 Inflation
Stabilisation is considered a pre-requisite for growth, as high levels of inflation create uncertainty
by confusing price signals; the negative impact of inflation on growth is borne out by the
regression results (though as noted above it is almost certainly non-linear). Most studies find that
inflation has been brought down when stabilisation has been pursued. As shown in Table 2, this
view is supported by the experience of our sample of 20 countries. Median inflation in reforming
countries is half that in non-reforming ones16 though with little difference between strong and
weak reformers.
In interpreting these results it should be remembered that high aid inflows can either be
inflationary or deflationary and have in several countries (such as Nicaragua, Tanzania and
Uganda) played an important part in bringing about stabilisation; in the Kenyan case Levin (1994:
33-34) argues that stabilisation was undermined by the donors withholding aid. More generally
the case study evidence is more mixed with regards to the aid–inflation relationship.
Large aid inflows to Mozambique led to an appreciation of the exchange rate and an exacerbation
of inflation. Despite a fall in aid during the 1990s, inflation in Bangladesh dropped from double
to single digits because of a reduction in the budget deficit resulting from a rise in tax revenue
and increased foreign financing. The introduction of a cash budget in Tanzania in 1995 meant
that government finances were brought more firmly under control. Inflows of aid led to the
budget deficit becoming a surplus thus contributing to macro-economic stabilisation, and the
availability of forex resulted in exchange rate stabilisation. In Zambia a tight fiscal policy reined in
monetary growth and reduced inflation, which was further reinforced by the introduction of a
cash budget in 1993 - made possible as aid covered external debt payments. Nicaragua has
maintained control of inflation since March 1991 through the use of the exchange rate as a
nominal anchor, which was underpinned by substantial aid inflows. First, there was a devaluation
of the exchange rate, which was then fixed, and wage and price controls were maintained in order
to ‘break inflationary expectations’. Increases in some prices however, led to a gradual
appreciation and overvaluation. In the wake of further devaluation in 1993 inflation increased and
can be seen to have followed closely the rate of nominal devaluation.
But as already indicated, what is not often discussed is the trade-off between stabilisation
and restoring long-run growth (which has its strongest effect through the squeeze on government
capital budgets), when the policy emphasis should shift from stabilisation to growth (when
inflation is 40 per cent, 10 per cent, zero?) and the possibility that growth is in fact necessary to
maintain a stable economy. Clearly, the relationship between stabilisation and growth depends at
least in part on whether the budget is balanced by increasing revenue or reducing expenditure. In
many countries the latter has been the case; for example, in India “fiscal contraction … has been
achieved almost wholly through expenditure curtailment without any improvement at all in
revenue mobilisation” (Guhan and Nagaraj 1995: 5). However, during the 1990s a number of
African countries (e.g. Tanzania, Uganda and Zambia) have instituted revenue authorities which
have had success in increasing revenue collection in Tanzania and Zambia, although not in
Uganda.
3.4 Investment
The link between investment and growth is well established.17 The failure of adjustment policies
to revive investment is acknowledged in Adjustment in Africa (“no quick response in
investment or savings”, World Bank 1994: 153), which is an unsurprising result because
governments have cut back on public investment (even where overall expenditure levels have
been maintained) and private investment has not risen.18
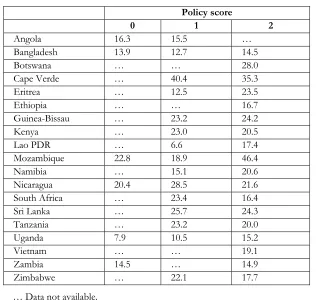
In fact the data from the countries studied present a slightly different picture, showing that
the investment rate is significantly higher in reforming countries than non-reforming ones,
although with no difference between strong and weak reformers. (Table 6 suggests a slightly
higher rate amongst the former, but this difference disappears once Angola and Mozambique are
excluded, and Table 7 confirms that Mozambique accounts for much of the difference between
the two sets of results.) Based on both the mean and the median, the investment rate appears to
be about 15 per cent in non-reformers and a little over 20 per cent in reformers, and this
difference is significant.19Table 7 shows a really very mixed picture comparing policy scores 1 to
0 and 2 to 1, although most of these can be explained (e.g. Nicaragua’s was high under policy
score 1, which was when the government of the late 1980s undertook some reform but also fiscal
expansion, and Mozambique fell from 0 to 1 as the latter was the period during which the war
intensified): but all the 2 to 0 comparisons are positive.
T a b l e 6 S i m p l e c o n t r o l g r o u p c o m p a r i s o n s f o r i n ve s t m e n t r a t e
( p e r c e n t o f G N P )
Policy score
0 1 2
Mean
Full sample 15.3 21.1 23.3
Standard deviation 5.1 7.0 9.7
Number of observations 33 98 118
Excluding Angola and Mozambique 14.5 21.6 21.2
Standard deviation 5.1 7.2 6.9
Number of observations 26 87 108
Median
Full sample 15.3 21.8 21.4
Excluding Angola and Mozambique 14.2 22.6 20.5
18 Matin and Wasow (1992) argue that failure to implement adjustment in Kenya greatly reduced private investment, but this argument ignores the fact that it has not risen in many countries which have
implemented adjustment.
T a b l e 7 B e f o r e - ve r s u s - a f t e r c o m p a r i s o n s o f i n ve s t m e n t r a t e
( p e r c e n t o f G N P )
Policy score
0 1 2
Angola 16.3 15.5 …
Bangladesh 13.9 12.7 14.5
Botswana … … 28.0
Cape Verde … 40.4 35.3
Eritrea … 12.5 23.5
Ethiopia … … 16.7
Guinea-Bissau … 23.2 24.2
Kenya … 23.0 20.5
Lao PDR … 6.6 17.4
Mozambique 22.8 18.9 46.4
Namibia … 15.1 20.6
Nicaragua 20.4 28.5 21.6
South Africa … 23.4 16.4
Sri Lanka … 25.7 24.3
Tanzania … 23.2 20.0
Uganda 7.9 10.5 15.2
Vietnam … … 19.1
Zambia 14.5 … 14.9
Zimbabwe … 22.1 17.7
… Data not available.
Thus, using more recent data than in previous studies, we get something of a positive
picture, though since the results do not distinguish between strong and weak reformers the
evidence is in favour of reforming away from a control-based regime, rather than indicating
precisely the extent to which reforms should be fully market based. Moreover, concerns remain
over the lack of a private sector response and the extent to which this may require public sector
inputs.
T a b l e 8 C o n t r o l g r o u p c o m p a r i s o n s o f c u r r e n t a c c o u n t d e f i c i t
( a s a p e r c e n t o f G N P )
Policy score
0 1 2
Mean
Full sample -12.6 -7.7 -8.8
Standard deviation 12.1 10.1 13.3
Number of observations 34 90 120
Excluding Angola and Mozambique -14.0 -6.9 -7.0
Standard deviation 12.1 10.2 12.3
Number of observations 27 81 111
Median
Full sample -7.9 -5.5 -5.9
[image:18.595.141.457.107.407.2] [image:18.595.106.490.600.764.2]3.5 External Account and Debt
Trade liberalisation measures encompass exchange rate liberalisation (usually devaluation), reform
of the system of distributing foreign exchange, liberalisation of domestic factor markets, import
liberalisation and moves from non-tariff restrictions towards tariffs. All these are designed to
create incentives by improving the profitability of tradables relative to non-tradables, thus
rewarding exporters and penalising importers. Analysis of the external account is made difficult
by the fact that reform efforts are often accompanied by an aid inflow, which necessarily worsens
the current account. Nonetheless, we find a significant improvement in the current accounts of
reforming countries compared to non-reformers (Table 8).20These results suggest that there may
have been some improvement in exports and this is indeed shown by data on export
performance (Tables 2 and 9).
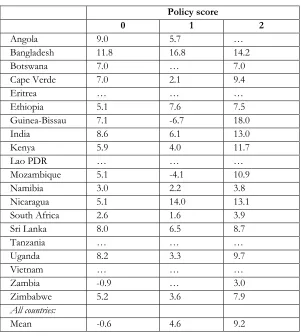
T a b l e 9 B e f o r e - ve r s u s - a f t e r r e a l e x p o r t g r o w t h u n d e r
d i f f e r e n t p o l i c y s t a n c e s
Policy score
0 1 2
Angola 9.0 5.7 …
Bangladesh 11.8 16.8 14.2
Botswana 7.0 … 7.0
Cape Verde 7.0 2.1 9.4
Eritrea … … …
Ethiopia 5.1 7.6 7.5
Guinea-Bissau 7.1 -6.7 18.0
India 8.6 6.1 13.0
Kenya 5.9 4.0 11.7
Lao PDR … … …
Mozambique 5.1 -4.1 10.9
Namibia 3.0 2.2 3.8
Nicaragua 5.1 14.0 13.1
South Africa 2.6 1.6 3.9
Sri Lanka 8.0 6.5 8.7
Tanzania … … …
Uganda 8.2 3.3 9.7 Vietnam … … … Zambia -0.9 … 3.0
Zimbabwe 5.2 3.6 7.9
All countries:
Mean -0.6 4.6 9.2
… Data not available.
[image:19.595.148.449.329.665.2]
Analysis of average real export growth across the 20 countries since 1981 given in Table 9
shows that export growth performance is significantly stronger the greater the degree of reform
across the sample as a whole. The t-statistic at the 10 per cent level for the difference in means
between 0 and 1 is 1.88 and that for 1 and 2 is 2.06. The country-specific comparisons of export
growth in periods of non-reform with weak and strong reform, gives a slightly conflicting picture.
For 10 of the countries (Cape Verde, Guinea-Bissau, India, Kenya, Mozambique, Namibia, South
Africa, Sri Lanka, Uganda and Zimbabwe), export growth appears to be greater during periods of
no reform than during weak reform, and strongest during strong implementation of reform
(partly as scores of 1 often correspond to periods of crisis). Only Nicaragua and Ethiopia exhibit
stronger export growth rates during periods of weak reform than when reform is absent, with
growth rates between weak and strong reform periods remaining fairly even. Use of the exchange
rate as a nominal anchor in Nicaragua from 1991 almost certainly led to overvaluation and
subsequently hampered exports.
A main argument of this review is that the control regime resulted in bad performance, but
while the evidence that market-based reform is the best alternative is scanty, this is not so in
relation to export performance. Control group analyses - e.g. Adjustment in Africa (World Bank
1994) andKirkpatrick and Weiss (1995) - find that countries engaging in macro-economic policy
reform, and in particular trade liberalisation, experience faster growth in real exports. But these
simple control-group analyses cannot in fact adequately control for other factors, and so the
results cannot clearly demonstrate the positive impact of reforms. However, the case studies also
find positive effects. Husain and Faruqee (1994) report strong export growth in the case studies
in the companion volume, despite declining terms of trade, and all but Burundi have achieved
some success in diversification. Husain and Faruqee (1994: 5-6). On the other hand, Sahn et al.
(1994: 375-6) find mixed results from the case studies where reforms have been implemented;
Ghana and Guinea are cited as successes, but Tanzania as less so.
On the other hand the picture is far less positive with respect to debt, the debt burden
having increased in many countries. Large aid inflows have tended to increase the debt burden
rather than reduce it; although bilateral aid is virtually all grant aid, the substantial inflows from
the IFIs are not. Table 10 shows that the total debt burden has risen in all countries, except
Nicaragua where very substantial debt relief has resulted in some reduction. The
Ddumba-Ssentamu et al. (1999: 35) study of the impact of Sida programme aid on Uganda argues that “the conclusion of structural adjustment programmes with the IFIs led to a huge increase in external
debt outstanding. It increased from US$ 209 million in 1975 to US$ 1,232 million in 1985, and
then to US$ 2,868 million in 1991. More than three quarters of current (1996) debt of Uganda is
multilateral debt, to World Bank (IDA), IMF and other multilateral institutions, in particular,
African Development Bank”.
( p e r i o d a ve r a g e , U S $ b i l l i o n s )
1980–84 1985–89 1990–94 1995–96
Angola 0.5 4.7 8.3 9.5
Bangladesh 4.4 8.6 13.3 15.4
Botswana 0.2 0.5 0.6 0.6
Cape Verde 0.1 0.1 0.1 0.2
Ethiopia 2.6 6.7 9.0 9.6
India 21.8 46.8 81.3 84.4
Kenya 2.6 4.3 5.9 6.2
Lao PDR 0.4 1.1 1.9 2.1
Mozambique 0.4 3.5 4.7 5.4
Nicaragua 2.8 6.3 9.2 6.8
Sri Lanka 1.8 3.9 5.9 7.0
Tanzania 2.5 4.5 5.9 6.2
Uganda 0.6 1.4 2.5 3.1
Vietnam 0.0 4.0 21.7 22.2
Zambia 2.4 4.0 4.9 5.2
Zimbabwe 1.2 2.2 3.2 3.8
Source: World Development Indicators
3.6 Agricultural Supply Response
Economic performance at the sectoral level, particularly in agriculture and industry, is crucial to
success of the economy in coping with changing economic circumstances brought about by
macro-economic reform. There is also a gender aspect to this analysis since in many low-income
countries, particularly in sub-Saharan Africa and parts of South Asia, women are responsible for
the vast majority of agricultural labour. The impact of adjustment policies on agriculture is
therefore an issue of great importance for gender relations and a proper analysis and appreciation
of gender relations should inform the design of agricultural policy.
Historically, developing countries have tended to tax their agricultural sectors through trade
and pricing policies, often to keep food prices low for the benefit of the urban population and to
generate export tax revenue. Schiff and Valdes (1992) have shown that these policies resulted in a
slowdown in agricultural sector growth and in overall economic growth, with industrial and
macro-economic policies often having a greater impact than more direct, sector-specific
measures.
T a b l e 1 1 A ve r a g e g r o w t h o f r e a l a g r i c u l t u r a l va l u e a d d e d
Policy score
0 1 2
Mean 2.8 2.7 3.0
Standard deviation 8.6 10.7 13.6
Number of observations 46 92 122
[image:21.595.130.465.89.325.2]One of the objectives behind adjustment is to reduce the level of indirect taxation of
agriculture through trade liberalisation and removing price controls. The success or failure of
orthodox adjustment programmes could be said to hinge on the supply response of agriculture to
adjustment measures given the significance of agriculture in these economies for exports,
domestic food supply and hence for inflation. Measures such as currency devaluation, reduced
export taxes and lower input prices (through reduced domestic industrial protection, although a
countervailing effect can come from the removal of subsidies) have attempted to increase the
relative prices and profitability of agricultural and other tradable goods.
Table 11 gives an analysis of average growth of real agricultural value added across the
countries. From the results shown, it is evident that there is no significant difference in growth
rates between non-reform, weak and strong reform periods. Looking at the country specific
results in Table 12, Sri Lanka, South Africa, Mozambique, Kenya, India, Guinea Bissau and Cape
Verde all exhibit strongest growth rates in real agricultural value added during periods of reform
which are classified as weak. For Ethiopia, Uganda and Zambia, the stronger the reform
implementation the greater the rate of growth. Zimbabwe, Vietnam and Namibia also have
stronger growth with stronger reform but growth in agricultural value added is least during
periods of weak reform. Table 13 classifies the countries according to the degree of agricultural
supply response in the production of both export crops and those for domestic consumption.
With few exceptions, the supply responses of agriculture in the economies concerned appear
to have been weak or limited to certain sub-sectors. An analysis of production and export figures
suggests that there have been no significant across-the-board increases in agricultural production
following periods of reform that can be attributed directly to the liberalisation process. There
have been large increases in output in Uganda and Vietnam, though in the former case the extent
to which this is policy related (rather than peace and weather related) is disputed. This does not
suggest however, that there has been no improvement whatsoever in agricultural production
T a b l e 1 2 B e f o r e - ve r s u s - a f t e r c o m p a r i s o n s o f g r o w t h o f r e a l
a g r i c u l t u r a l va l u e a d d e d u n d e r d i f f e r e n t p o l i c y s t a n c e s
Policy score
0 1 2
Angola -1.0 -1.9 …
Bangladesh 2.5 2.4 1.4
Botswana 1.8 … 1.8
Cape Verde -4.7 2.0 -8.0
Eritrea … … …
Ethiopia 1.8 1.8 9.0
Guinea-Bissau 5.6 6.0 3.9
India 3.4 3.6 2.9
Kenya 2.6 2.7 2.3
Lao PDR … … …
Mozambique 4.1 6.1 3.1
Namibia 1.1 0.6 3.0
Nicaragua 1.2 -0.5 3.3
South Africa 3.1 3.7 2.4
Sri Lanka 2.3 2.7 1.8
Tanzania … … …
Uganda 2.9 2.9 4.2
Vietnam 4.7 3.8 4.8
Zambia 4.1 … 6.3
Zimbabwe 5.3 3.2 8.7
… Data not available.
Of the countries featured in the table, only Guinea-Bissau and Vietnam seem to have
increased agricultural production in all their main crops. In the former case, self-sufficiency in
food is one of the government’s top priorities and over the last five years there have been modest
increases in cereal and food production. There has been no increase in agricultural exports,
however, and food imports more than doubled in value between 1995 and 1996 (EIU 1999a).
Poor infrastructure and equipment have been identified as obstacles to increased productivity.
Supply response to reform in the remainder appears to be concentrated solely in the
production of export crops, with varying degrees of success. Substantial increases in the
production and export of export crops in some cases go hand-in-hand with complementary,
sector-specific policies.
Ethiopia, for example, has had near-total deregulation of agricultural marketing and
increased competition has improved farm-gate prices for grains and coffee. Nevertheless, revival
of commercial agriculture, with the exception of coffee exports, has been slow and food
insecurity is persistent. For Angola, however, where agricultural production had been devastated
by war, even agricultural production in coffee, their main export crop, has seen little increase over
the last 10 years despite price liberalisation, though rural access to credit is poor. Export earnings
[image:23.595.143.452.110.425.2]and employment for 70 per cent of the population. Production of the main food crops has been
increasing: wheat and millet production has doubled between 1993 and 1997, barley production
has tripled over the same period (EIU 1999b). There has also been direct investment in
horticultural projects.
T a b l e 1 3 A g r i c u l t u r a l s u p p l y r e s p o n s e
Country Response
Africa
Angola None
Botswana Weak, none in food crops but some in export crops (meat products, food and tobacco)
Cape Verde Very weak
Eritrea Weak, some in food crops
Ethiopia Moderate to strong, with growth in coffee production Guinea-Bissau Weak, uneven in export crops
Kenya Moderate to strong, notably tea and horticultural products
Mozambique Moderate to strong response across range of crops (especially since end of war)
Namibia Weak, none in cereals and uneven in livestock
South Africa Weak, mainly in maize
Tanzania Strong in food and some export crops (but not others)
Uganda Strong, particularly in export crops (coffee, cotton, tobacco and horticultural) and less so for food crops
Zambia None in main crop (maize), but some in tobacco and horticultural products
Asia
Bangladesh Moderate, becoming strong for some export crops in 1990s India None
Laos Weak, none in main crop (rice), some in cotton and coffee
Sri Lanka Mostly weak though improved in tea in 1990s
Vietnam Strong across all regions and most crops
Latin America
Nicaragua Strong since 1993, particularly in export crops
Expansion in cash crop production is most evident for Sri Lanka, Kenya and Zimbabwe
although external factors above and beyond domestic economic reform have clearly been
influential. Sri Lanka’s tea output has increased and doubled in value since 1993 (EIU 1999c).
Whilst this coincides with private management of the tea industry, world market conditions have
been more favourable with increased demand from the Soviet market and overall a global fall in
supplies. By contrast Sri Lanka’s domestic agriculture is generally lacklustre, and inconsistent
trade and pricing policies hamper growth. The value of tea production has also increased in
Kenya, although production volume has actually fallen. Production fell from 257,000 tonnes in
1996 to 222,000 tonnes in 1997 yet the value of production in K£ actually increased from K£1m
to K£1.18m. Horticulture is the best performer, with the liberalised trade regime making it
possible to benefit from the high world price (EIU 1999d).
Exchange rate devaluation coupled with improved research and development, extension
[image:24.595.85.513.182.515.2]although the government protects the market for processors through price and market guarantees
and tariff barriers. As trade is still not fully liberalised, especially for key agricultural products,
expansion in tobacco, the most valuable crop and leading export, can largely be put down to
increased land area in cultivation.
Women play a significant role in the agricultural sector in developing economies, particularly
in African countries (Lensink 1996), where they tend to make up the majority in rural areas.
Furthermore, female-headed households, which are more likely to occur in rural areas and which
tend to be low-income, are often hit hardest by negative impacts of reform programmes
(Riphenburg 1997; Kanji 1995). In the rural household, women generally have responsibility for
the production of food crops, food processing and, to a lesser extent, cash crop production, as
well as domestic chores such as cooking and childcare. Adjustment-led price reform and other
liberalisation measures tend to lead to major changes in relative prices in favour of export crops.
They can also cause a shift in the amount of time spent by men and women in cultivating
different types of crops, possibly increasing time spent overall on farming activities to the
detriment of family responsibilities with knock-on effects on family health and nutrition
(Beinefeld in Jamal 1995). Furthermore, gender divisions of labour can impede supply response
to improved price signals.
3.7 De-Industrialisation? Manufacturing Performance under Adjustment
Pre-adjustment policies gave support to a heavily protected manufacturing sector, much of which
was in state hands, through heavy tariffs, sometimes so high as to allow the firm a domestic
monopoly, and both direct and implicit subsidies, such as receiving foreign exchange allocations
at overvalued exchange rates. In general, state-owned firms faced a soft budget constraint.21
As adjustment is about achieving a more efficient allocation of resources, the process should
entail moving resources out of such activities, i.e. a reduction of output and employment. So
when is a contraction in manufacturing output ‘de-industrialisation’22(which sounds like a bad
thing) and when is it part of an efficient resource reallocation? For the purposes of this review,
we analyse trends in manufacturing performance, though it will remain difficult from these results
to say much about de-industrialisation as properly defined.
21 See, for example, Eriksson Skoog (1998) on Tanzania.
T a b l e 1 4 C o n t r o l g r o u p c o m p a r i s o n o f p o l i c y i m p a c t
o n m a n u f a c t u r i n g g r o w t h
Policy score
0 1 2
Simple mean
Full sample -0.1 2.5 4.4
Standard deviation 9.1 12.5 8.8
Number of observations 35 89 96
Excluding Angola and Mozambique 1.8 3.4 5.0
Standard deviation 5.9 8.9 8.7
Number of observations 29 78 86
Median
Full sample 0.0 4.5 4.7
Excluding Angola and Mozambique 0.3 4.5 4.9
The results of the analysis are presented in Tables 14 and 15. Table 14 reports the simple
mean and median values of manufacturing growth in the countries for which data are available
using the classification by policy episodes described earlier. At first glance these results appear to
lend support for the view that market-based reform in fact has a positive impact on
manufacturing growth: for both the full sample and that excluding the conflict countries of
Angola and Mozambique, both the mean and median increase the higher the policy score. Hence
it would seem that any concerns about de-industrialisation are in fact ill grounded. In fact the
picture is a bit more complicated than that, since there is no significant difference in mean growth
comparing the means for 1 and 0, or comparing those for 2 and 1.23 In the case of the median
(which is the better measure for these data) then the values for policy scores 1 and 2 are virtually
identical. On the other hand there is a significant difference in mean manufacturing growth
comparing 2 with 0.
A more mixed picture emerges from the country-level before-versus-after analysis in Table
15:
from surveys of manufacturing firms do not support the hypothesis that structural adjustment programs have led to de-industrialisation in Africa”. (World Bank, 1994: 150).
[image:26.595.125.470.141.302.2]• Countries with a positive message: Bangladesh (where growth has come from liberalisation
permitting rapid growth in textiles, rather than successful restructuring of the old
state-owned sector), Botswana (which has had a fairly liberal regime throughout the period and
enjoyed sustained high growth), and Uganda (where there has been high growth across most
of the sector, including clearly import-substituting ones). Sri Lanka may perhaps be added to
this list, having had high growth throughout the period, which may be characterised by an
increasingly liberal regime.
• Countries with a seemingly positive message, though care should be exercised in
interpretation: there has also been growth in Mozambique, though this must also be
attributed to the end of the war, and the high growth for Ethiopia is based on only two years.
India has experienced good growth, but also did so before the 1991 liberalisation.24
• Countries with no improvement or a worsening performance: in the case of Nicaragua there seems to be a large turnaround between 2 and 1 policy scores, but the former refers only to a
couple of years during a deep economic crisis at the end of the 1980s. The poorest picture
emerges from Zambia and Zimbabwe, which have seen very poor performance, with Cape
Verde and Kenya being milder versions of this story.
T a b l e 1 5 B e f o r e - ve r s u s - a f t e r c o m p a r i s o n s o f m a n u f a c t u r i n g g r o w t h
u n d e r d i f f e r e n t p o l i c y s c o r e s
Policy score Change between regimes
0 1 2 2-1 2-0
Angola -9.2 3.1 … … …
Bangladesh 1.0 4.2 6.8 2.5 5.8 Botswana … … 8.3 … …
Cape Verde … 3.8 1.5 -2.4 …
Ethiopia 1.9 -1.4 8.3 9.7 6.4
India … 7.6 6.8 -0.8 …
Kenya … 4.4 2.8 -1.6 …
Mozambique -10.7 -16.1 -1.0 15.1 9.7
Namibia … 3.2 3.5 0.3 …
Nicaragua 0.7 -13.6 0.8 14.4 0.1
South Africa … 0.6 0.0 -0.6 …
Sri Lanka … 6.0 8.1 2.1 …
Uganda -1.1 9.6 12.7 3.1 13.8
Zambia 4.4 … 0.7 … -3.7
Zimbabwe … 2.2 -5.9 -8.1 …
Notes: Data for Mozambique refers to growth in industry; … indicates not available or not applicable (no years for that country under that policy regime).
[image:27.595.100.497.432.660.2]
From this analysis we can conclude that it is clearly not the case that the domestic
manufacturing sector collapses in the face of liberalisation. But we can also conclude that there is
no necessary increase in manufacturing output. In several countries (Bangladesh, Botswana and
Sri Lanka) growth has been partly based on the creation of new enterprises in more
labour-intensive sectors rather than successful restructuring of existing enterprises, though there has
been some of that in the Sri Lankan case. African countries seem not to have been able to follow
the low-cost export route, given infrastructural constraints and the fact that labour is not that
cheap (especially allowing for skill levels). But the Ugandan case shows that growth can continue,
even in import-substituting sectors. Table 16 indicates that between 1987 and 1997 the index of
total manufacturing production has increased by 63 per cent, with all branches reported showing
increases of over 60 per cent with the exception of textiles and clothing, where production has
fallen substantially.
T a b l e 1 6 I n d e x o f m a n u f a c t u r i n g p r o d u c t i o n b y b r a n c h i n U g a n d a
( i n c l u d i n g c o f f e e a n d c o t t o n p r o c e s s i n g ) , 1 9 8 7 = 1 0 0 ,
a n d s h a r e o f b r a n c h i n t o t a l
Share (%)
1989 1990 1991 1992 1993 1994 1995 1996
Food processing 21 154 175 227 246 246 310 362 414
Tobacco and beverages 26 144 155 176 155 171 228 309 371
Textiles and clothing 16 133 116 111 112 93 68 63 48
Leather and footwear 2 63 75 60 80 68 97 164 288
Timber and paper 9 169 184 198 221 251 300 383 563
Chemicals 12 163 184 193 252 340 383 512 510
Bricks and cement 4 109 154 163 203 261 249 367 640
Steel and products 5 99 108 149 191 259 390 491 481
Miscellaneous 4 204 181 251 272 381 487 599 628
Total 100 145 156 178 191 216 260 331 387
Source: Taken from Ddumba-Ssentamu et al. (1999).
This mixed picture is confirmed by the review of adjustment in Africa by Engberg-Pedersen
et al. (1996), who also do not find a uniform picture of a sector in decline. They argue that impact has differed by branches, those with a local resource base doing better (which is hardly surprising
given the impact of devaluation on cost structures), though there are exceptions (notably leather
and textiles). They also point out that issues of concern to small enterprises have not generally
been addressed in reform programmes, however the informal sector appears to be doing well.
The question is thus why some countries have been successful and others have not.
There are two views here. The first argues that success depends upon having a government
that can restore investor confidence by being firmly committed to reform, establishing
macro-economic stabilisation and carrying through liberalisation. Analysing the success of some
liberalising countries suggests that the role of programme aid cannot be ignored, which has clearly
[image:28.595.90.506.370.515.2]allocative schemes, benefited larger firms) will have raised capacity utilisation, although the
evidence here is mixed.
But others, drawing on the East Asian experience, argue that an industrial strategy is
required. They point to the potential efficiency from small-scale production and the need to
develop technical capability; their argument is that policies should allow for a smoother transition
from one structure to another by, for example, selective rather than blanket trade liberalisation
and by a phased transition25. In the Indian context, Guhan and Nagaraj (1995) argue that, whilst
deregulation is to be welcomed, industrial controls had several objectives, such as regionally
balanced development, that should not be wholly discarded.
Closer examination shows that countries such as Botswana and Sri Lanka have indeed had
some semblance of an industrial strategy, and paid careful attention to issues such as effective
protection and the use of protection as a tool for promoting industry.
4 LESSONS FOR THE DESIGN OF ADJUSTMENT POLICIES
Market-oriented policy reform has undoubtedly taken place in the 20 countries under
consideration. Have these changes had beneficial effects on economic performance? For a very
large number of indicators reviewed, performance has been better in reforming economies than
non-reforming ones. Although there are shortcomings in both control-group and
before-versus-after analysis, these results are both strong and consistent, suggesting that there is something
going on here. But care must be exercised in deciding what that something is. In nearly all cases
the improvement is found when comparing reformers with non-reformers, with no significant
difference in the performance of weak and strong reformers. This finding is consistent with the
view that there is a need to move away from excessive government control of the economy, but
that once that has been done then full-scale liberalisation may not yield further benefits, or may
not be the best way to promote long-run growth (about which we can still say little). The fastest
growing economy in our sample, Vietnam, is probably the least liberalised in many respects.
There are some grounds for thinking that some form of intervention may still be desirable. One
reason is to ensure a good distribution of the benefits of growth. Another is the importance of
market failures, which have been mentioned only in passing in this largely empirical review.
These findings are consistent with the newly emerging ‘post-Washington consensus’ and
with the views recently expressed by two of the currently most influential economists writing on
development issues. Rodrik has stated that:
Countries that have done well in the post-war period are those that have been able to
formulate a domestic investment strategy to kick-start growth and those that have had the
appropriate institutions to handle adverse external shocks, not those that have relied on
reduced barriers to trade and capital flow. The evidence from the last two decades is quite
clear: the countries that have grown the most rapidly since the mid-1970s are those that have
invested a high share of GDP and maintained macro-economic stability … Policy makers
therefore have to focus on fundamentals of economic growth - investment,
macro-economic stability, human resources and good governance - and not let international
economic integration dominate their thinking on development (1999: 4).
Stiglitz has argued that:
… many of the most successful countries (representing the largest part of growth within the
low income countries) have not actually followed the ‘recommended’ policies … the
Washington consensus failed (owing to) a failure to understand the subtleties of the market
economy, to understand that private property and ‘getting the prices right’ (that is,
liberalisation) are not sufficient to make a market work. An economy needs institutional
structure … Perhaps had (the East Asian) countries followed all the dictums of liberalisation
and privatisation, they would have grown faster, but there is little evidence for that
proposition (1998: 5, 9 and 10).
Our findings thus come in support of the view of two prominent development economists. It
would be immodest of us to suggest these authors need our intellectual support. But at the policy
level there has been at best slow movement in the direction they suggest. The argument continues
over the appropriate balance between state and market, with the international community
continuing to support a stronger orientation to the market alone than the evidence presented here
REFERENCES
Barro R. J., 1997, Determinants of Economic Growth: a cross-country empirical study,
Lionel Robbins Memorial Lecture, Cambridge, Mass: MIT Press
Beinefeld, M., 1995, Structural Adjustment and Tanzania's Peasantry: assessing the likely
long-term impact, pp88-130 in Jamal 1995
Bhaduri, A. and Skarstein R., 1996, ‘Short-Period Macro-economic Aspects of Foreign Aid’,
Cambridge Journal of Economics, Vol 20 No 2: 195-206
Bryceson, D., 1999, ‘African Rural Labour, Income Diversification and Livelihood Approaches: a
long term development perspective’, Review of African Political Economy, Vol 80: 171-89
Bryceson, D., Kaye, C. and Mooij, J. (eds), 1999, Disappearing Peasantries? Rural Labour in
Africa, Asia and Latin America, London: Intermediate Technology Publications
Calamitsis, E., Basu, A. and Ghura, D., 1999, ‘Adjustment and Growth in sub-Saharan Africa’,
IMF Working Paper WP/99/51, Washington DC: IMF
Cornia, G. A and Helleiner, G. K, 1994, Adjustment to Development in Africa: conflict,
controversy, convergence, consensus? United Nations Children’s Fund
Ddumba-Ssentamu, J., Dijkstra, G. and Donge, J. K. van, 1999, ‘Swedish Programme Aid to
Uganda; An Evaluation’, Global Evaluation of Swedish Programme Aid, Working Paper
No5, Kampala: Makerere University / The Hague: ISS
Dijkstra, A. G., 1999a, ‘Debt, Dependence and Fragile Development. Programme Aid to
Nicaragua’, Sida Evaluation 99/17: 4, Stockholm: SIDA
1999b, ‘Programme Aid, Policies and Politics: Programme Aid and Conditionality’, SIDA
Evaluation 99/17: 10, Stockholm: SIDA
Easterly, W. and Levine, R., 1997, ‘Africa’s Growth Tragedy: Policies and Ethnic Divisions’,
Quarterly Journal of Economics,Vol CXII No 4: 1,203-50
Easterly, W. and Rebelo, S., 1993, ‘Fiscal Policy and Economic Growth: An Empirical
Investigation’, Journal of Monetary Economics,Vol 32 No 3: 417-58
Economist Intelligence Unit, 1999a, Country Profile Guinea-Bissau 1998/1999, London: EIU
1999b, Country Profile Eritrea, Somalia, Djibouti 1998/1999,London: EIU
1999c, Country Profile Sri Lanka 1998/1999,London: EIU
1999d, Country Profile Kenya 1998/1999,London: EIU
Engberg-Pedersen, P., Gibbon, P., Raikes, P. and Udholt, L. (eds), 1996, Limits of Adjustment
in Africa, Oxford: James Currey / Portsmouth: Heinemann: 141-214
Eriksson Skoog, G., 1998, The Soft Budget Constraint: the emergence, persistence and
logic of an institution. The case of Tanzania 1967-1992, Stockholm: the Economic
Research Institute, Stockholm School of Economics
Goldstein, M. and Montiel, P., 1986, ‘Evaluating Fund Stabilisation Programmes with