http://dx.doi.org/10.4236/ojmi.2015.52009
Visualization of Magnetic Nanofibers Using
Magnetic Particle Imaging
Kenya Murase, Atsushi Mimura, Natsuo Banura, Kohei Nishimoto, Hiroshige Takata Department of Medical Physics and Engineering, Division of Medical Technology and Science, Faculty of Health Science, Graduate School of Medicine, Osaka University, Osaka, Japan
Email: [email protected]
Received 30 April 2015; accepted 30 May 2015; published 2 June 2015
Copyright © 2015 by authors and Scientific Research Publishing Inc.
This work is licensed under the Creative Commons Attribution International License (CC BY).
http://creativecommons.org/licenses/by/4.0/
Abstract
Purpose: Magnetic nanofibers (MNFs) are nanofibers impregnated with magnetic nanoparticles (MNPs). Magnetic particle imaging (MPI) is a recently introduced imaging method that allows im-aging of the spatial distribution of MNPs. The purpose of this study was to develop MNFs and to investigate the feasibility of visualizing them using MPI and of heating them using an alternating magnetic field (AMF). Materials and Methods: First, chitosan nanofibers were cross-linked with glu-taraldehyde vapor in a sealed vial for 24 hours. Next, they were mixed with various concentrations of MNPs and the mixture was stirred for 1 hour using a magnetic stirrer. After the mixture was re-frigerated at –80˚C for 24 hours, it was freeze-dried for 24 hours. The morphology of the resultant MNFs was characterized by scanning electron microscopy, and the magnetic properties were meas-ured using a vibrating sample magnetometer. After these measurements, we imaged the MNFs us-ing our MPI scanner, and investigated the correlation between the pixel values of the MPI image and the concentration of MNPs or the number of MNF sheets. We also heated the MNFs using AMF, and measured the temperature rise using an infrared thermometer. Results: The MNFs were suc-cessfully visualized using our MPI scanner, and the pixel values of the MPI image showed excellent correlation with the concentration of MNPs (r = 0.992) and the number of MNF sheets (r = 0.997). A significant temperature rise was observed under AMF, and the initial slope of the time-dependent temperature rise showed excellent correlation with the concentration of MNPs (r = 0.994) and the number of MNF sheets (r = 0.979). Conclusion: The MNFs developed in this study can be visua-lized using MPI and can be applied to magnetic hyperthermia. They will be useful in biomedicine including cancer therapy and tissue regeneration.
Keywords
1. Introduction
The use of scaffolds in tissue engineering is constantly increasing, because these materials have become funda-mental tools to help the body rebuild damaged or diseased tissues [1]. Of the scaffolds, the magnetic scaffold has attracted increasing attention because it can attract and take up angiogenic proteins such as growth factors (GFs) or other bio-agents such as stem cells in vivo via a driving magnetic force. This concept involves the use of magnetic nanoparticles (MNPs) which are functionalized with GFs or other bio-agents to be taken up by the magnetic scaffold [1]. These functionalized MNPs act as carriers transporting the bio-agents towards and inside the magnetic scaffold under the effect of a magnetic field [1].
Some mechanical stimulators such as stress and strain have been shown to enhance bone regeneration and fracture healing [2]. Besides these mechanical stimuli, magnetic stimulation originating from static or alternating magnetic fields has also attracted researchers’ interest [3]. Weak magnetic or pulse electromagnetic fields of Gauss order have been reported to be effective for promoting bone fracture healing and spinal fusion [3]. Strong static magnetic fields of 5 to 10 Tesla have also been reported to potently regulate the orientation of matrix proteins and cells in vitro and in vivo [3]. Meng et al. [3] reported that the magnetic scaffold under a static magnetic field enhanced osteogenesis and provided a novel strategy for scaffold-guided bone repair.
It is well known that MNPs can induce heat when placed in an alternating magnetic field. On the basis of this behavior, the use of bone cement containing MNPs has been proposed for the hyperthermic treatment of bone tumors [4]. Matsumine et al. [5] prepared calcium phosphate cement containing Fe3O4 and conducted clinical trials to treat patients with metastatic bone lesions by hyperthermia, and reported that the patients treated by hyperthermia showed better radiographic outcomes than those treated by palliative operation.
Magnetic nanofibers (MNFs) are a magnetic scaffold, comprising nanofibers impregnated with MNPs. MNFs have huge potential in biomedical applications such as cancer therapy including hyperthermia [6] and tissue re-generation [5]. Visualization of MNFs as well as accurate knowledge about the quantity of MNPs within the MNFs is crucial for effective and safe treatment planning of cancer therapy or tissue regeneration using them [5] [6]. Thus, the development of a readily available, noninvasive, and quantitative imaging technique will be ne-cessary if cancer therapy or tissue regeneration using MNFs is to succeed.
Recently, a new imaging method called magnetic particle imaging (MPI) has been introduced [7]. MPI allows imaging of the spatial distribution of MNPs with high sensitivity, spatial resolution, and imaging speed [7]. MPI uses the nonlinear response of MNPs to detect their presence in an alternating magnetic field, which is referred to here as the drive magnetic field. Spatial encoding is accomplished by saturating the MNPs over most of the imaged region using a static magnetic field (selection magnetic field), except in the vicinity of a special position called the field-free point [7] or field-free line [8]. We have developed a system for MPI with a field-free-line encoding scheme, in which the field-free line is generated using two opposing neodymium magnets, and trans-verse images are reconstructed from the third-harmonic signals received by a gradiometer coil using the maxi-mum likelihood-expectation maximization (ML-EM) algorithm [9] [10].
The purpose of this study was to develop MNFs and to investigate the feasibility of visualizing them using MPI and of utilizing them as a source of magnetic hyperthermia.
2. Materials and Methods
2.1. Preparation of Magnetic Nanofibers
In this study, we used chitosan nanofibers (Sugino Machine Co., Ltd., Uozu, Toyama, Japan) as the source of MNFs, prepared from dry chitosan powder using a high-pressure water jet system [11]. First, chitosan nanofi-bers were cross-linked with glutaraldehyde (Wako Pure Chemical Industries Co., Ltd., Osaka, Osaka, Japan) vapor in a sealed vial for 24 hours to strengthen the structure of nanofibers and to gain degradation resistance (Figure 1(a)). Next, they were mixed with M-300 (magnetite, Fe3O4) (Sigma Hi-chemical Inc., Chigasaki, Ka-nagawa, Japan) [12] at various concentrations (0, 25, 50, 100, and 150 mM Fe). The mixture was stirred at 450 rpm for 1 hour using a magnetic stirrer (Figure 1(b)). After the mixture was stirred, it was refrigerated at –80˚C
for 24 hours, and then it was freeze-dried at –50˚C and 1.8 mbar for 24 hours using a freeze dryer (Free Zone 2.5, Labconco Co., Kansas, MO, USA) (Figure 1(c)).
2.2. System for Magnetic Particle Imaging
Figure 1. (a) Chitosan nanofibers cross-linked with glutaraldehyde vapor in a sealed vial for 24 hours, (b) magnetic nanofibers (MNFs) fabricated by mixing the cross-linked chitosan nanofibers with magnetic nanoparticles
(MNPs), and (c) MNFs freeze-dried for 24 hours.
Figure 2. Photograph of our scanner for magnetic particle imaging (MPI).
paper [9] [10]. In brief, the field-free line was generated by two opposing neodymium magnets. The drive mag-netic field was generated using an excitation coil (solenoid coil 100 mm in length, 80 mm in inner diameter, and 110 mm in outer diameter). AC power was supplied to the excitation coil by a programmable power supply (EC1000S, NF Co., Yokohama, Kanagawa, Japan), and was controlled using a sinusoidal wave generated by a digital function generator (DF1906, NF Co., Yokohama, Kanagawa, Japan). The frequency of the drive magnet-ic field was 400 Hz, and the peak-to-peak strength of the drive magnetmagnet-ic field was 20 mT. The MNP-generated signal was detected by a gradiometer coil (50 mm in length, 35 mm in inner diameter, and 40 mm in outer di-ameter) and the third-harmonic signal was extracted using a preamplifier (T-AMP03HC, Turtle Industry Co., Tsuchiura, Ibaragi, Japan) and a lock-in amplifier (LI5640, NF Co., Yokohama, Kanagawa, Japan). The output of the lock-in amplifier was converted to digital data using a personal computer connected to a multifunction data acquisition device with a universal serial bus port (USB-6212, National Instruments Co., Austin, TX, USA). The sampling time was taken as 10 ms. When measuring signals using the gradiometer coil, a sample was placed 12.5 mm (i.e., one quarter of the coil length) from the center of the gradiometer coil and the coil, includ-ing the sample, was moved such that the center of the sample coincided with the position of the field-free line. The selection magnetic field was generated by two opposing neodymium magnets (Neomax Engineering Co., Takasaki, Gunma, Japan). The field-free line can be generated at the center of the two neodymium magnets.
[image:3.595.226.371.247.395.2]2.3. System for Magnetic Hyperthermia
The details of our system for magnetic hyperthermia are described in our previous paper [14]. In brief, an alter-nating magnetic field was generated with use of an external coil comprising 19-turned loops (6.5 cm in diameter and 10 cm in length) of copper pipe (5 mm in diameter) and was cooled by water to ensure a constant tempera-ture and impedance. The coil was connected to a power supply (T162-5723BHE, Thamway Co., Fuji, Shizuoka, Japan) through an impedance tuner (T020-5723AHE, Thamway Co., Fuji, Shizuoka, Japan). This system in-duced an alternating magnetic field with a maximum amplitude of 3.7 kA/m at an output power of 500 W. The amplitude of the alternating magnetic field can be controlled by changing the output of the power supply. In this study, the frequency and amplitude of the alternating magnetic field were taken as 600 kHz and 3.1 kA/m, re-spectively.
2.4. Evaluation of Magnetic Nanofibers
The morphology of the resultant MNFs was characterized by a scanning electron microscope (SEM) (Hitachi High-Technologies Co., Ltd., Chiyoda, Tokyo, Japan). The magnetic properties were measured using a vibrating sample magnetometer (VSM) (Riken Denshi Co., Ltd., Meguro, Tokyo, Japan). After these measurements, we imaged the MNFs (10 mm in diameter and 2 mm in thickness) with various concentrations of MNPs (0, 25, 50, 100, and 150 mM Fe) and various numbers of MNF sheets with a concentration of 100 mM Fe (1, 2, and 3 sheets) using our MPI scanner [9] [10]. We then calculated the average MPI value by drawing a circular region of interest (ROI) with a diameter of 10 mm on the MPI image. In this study, we defined an MPI value as the pixel value of the transverse image reconstructed from the third-harmonic signals. We then investigated the cor-relation of the average MPI value with the concentration of MNPs and the number of MNF sheets.
We also heated the MNFs for 10 min using our apparatus for magnetic hyperthermia [14] at a frequency of 600 kHz and an amplitude of 3.1 kA/m, and measured the time course of the temperature rise during heating us-ing an infrared thermometer (FLIR E4, FLIR Systems Inc., Wilsonville, OR, USA) every 30 s durus-ing the first 2 min and every 1 min during the next 8 min after the beginning of heating. The time-dependent temperature rise (ΔT(t)) thus measured was fitted by use of the phenomenological Box-Lucas equation given by [15]
( )
( )
( )
0(
1 e Bt)
T t T t T A −
∆ = − = − (1)
where T t
( )
and T( )
0 are the temperatures at time t and 0, respectively, and A and B are constants. This eq-uation is often used to describe the heating of MNPs using an alternating magnetic field [16]. The product of the fitting parameters, A × B, is equivalent to the initial slope of the time-dependent temperature rise(
∆ ∆T t)
0, i.e.,0
T A B
t ∆
= × ∆
(2) We investigated the correlation of
(
∆ ∆T t)
0 with the concentration of MNPs and the number of MNFsheets.
2.5. Magnetic Particle Imaging of Magnetic Nanofibers Implanted in the Bone
To simulate therapy of a bone tumor or bone regeneration using MNFs, we created a hole with a diameter of 4 mm in the bone of a chicken, and implanted MNFs with a concentration of 150 mM Fe into the hole. To inves-tigate whether MNFs implanted in the bone can be visualized by MPI, the bone implanted with the MNFs was imaged using our MPI scanner [9] [10]. After the MPI study, X-ray CT images were obtained using a 4-row multi-slice CT scanner (Asteion, Toshiba Medical Systems Co., Odawara, Tochigi, Japan) with a tube voltage of 120 kV and a tube current of 210 mA. The MPI image was co-registered with the X-ray CT image using the pa-rameters for magnification and rotation, which were obtained using a phantom with 3 point sources with a di-ameter of 0.5 mm and filled with 100 mM MNPs.
2.6. Statistical Analysis
calcu-lated. The correlations of
(
∆ ∆T t)
0 with the concentration of MNPs and the number of MNF sheets were also analyzed using linear regression analysis. A P value less than 0.05 was considered statistically significant.3. Results
Figure 3 shows the SEM images of MNFs. As shown in Figure 3, chitosan nanofibers were seen when the con-centration of MNPs was low. In contrast, globular aggregations like cocoons were observed when the concentra-tion of MNPs was high.
[image:5.595.149.451.284.466.2]Figure 4 shows the magnetization of the MNFs with various concentrations of MNPs, which was measured using VSM. As shown in Figure 4, the MNFs had a nonlinear response to a magnetic field, and the saturation magnetization increased with increasing concentration of MNPs.
[image:5.595.206.390.518.695.2]Figure 5 shows the MPI images of MNFs (upper row) and the thermal images obtained by an infrared ther-mometer 10 min after the start of magnetic hyperthermia (lower row), with various concentrations of MNPs. Figure 6 shows the case when the number of MNF sheets was varied. As shown in the upper row of Figure 5, the pixel value of the MPI image increased with increasing concentration of MNPs. It also increased with in-creasing number of MNF sheets as shown in the upper row of Figure 6. The temperature of MNFs 10 min after
Figure 3. Scanning electron microscope (SEM) images of the MNFs with various concentrations of MNPs. (a) 0 mM Fe, (b) 25 mM Fe, (c) 50 mM Fe, (d) 100 mM Fe, and (e) 150 mM Fe. Scale bar = 1 µm; magnification 40,000×.
Figure 4. Magnetization of the MNFs with various concentrations of MNPs (25,
Figure 5. MPI images of the MNFs (10 mm in diameter and 2 mm in thickness) with various concentrations of MNPs (upper row) and the thermal images obtained by an infrared thermometer 10 min after the start of magnetic hyperthermia (lower row). (a) 25 mM Fe, (b) 50 mM Fe, (c) 100 mM Fe, and (d) 150 mM Fe. Scale
bar = 10 mm.
Figure 6. MPI images of the MNFs (10 mm in diameter and 2 mm in thickness) with various numbers of MNF sheets (upper row) and the thermal images obtained by an infrared thermometer 10 min after the start of magnetic hyperthermia (lower row). (a) one sheet, (b) two sheets, and (c) three sheets. In these cases, the
concen-tration of MNPs was 100 mM Fe. Scale bar = 10 mm.
the start of magnetic hyperthermia also increased with increasing concentration of MNPs (lower row in Figure 5) and increasing number of MNF sheets (lower row in Figure 6).
Figure 7 shows the time courses of the temperature rise in MNFs, which were measured by an infrared ther-mometer. Figure 7(a) shows the case when the concentration of MNPs was varied as 25 mM (closed circles), 50 mM (open circles), 100 mM (closed squares), and 150 mM (open squares), whereas Figure 7(b) shows the case when the number of MNF sheets was varied as one (closed circles), two (open circles), and three (closed squares).
(
∆ ∆T t)
0 was calculated from Equation (2) by fitting these time courses to Equation (1) (solid lines).Figures 8(a)-(b) show the relationships between the concentration of MNPs and the average MPI value and between the number of MNF sheets and the average MPI value, respectively. Figures 9(a)-(b) show the rela-tionships between the concentration of MNPs and
(
∆ ∆T t)
0 and between the number of MNF sheets and [image:6.595.148.449.316.522.2]Figure 7. Time courses of the temperature rise in MNFs, measured by an infrared thermo-meter. (a) Concentration of MNPs varied as 25 mM Fe (closed circles), 50 mM Fe (open circles), 100 mM Fe (closed squares), and 150 mM Fe (open squares). (b) Number of MNF
[image:7.595.137.462.313.479.2]sheets varied as one (closed circles), two (open circles), and three (closed squares).
Figure 8. (a) Relationship between the concentration of MNPs and the average MPI value.
(b) Relationship between the number of MNF sheets and the average MPI value.
Figure 9. (a) Relationship between the concentration of MNPs and the initial slope of the time-dependent temperature rise ((ΔT/Δt)0) calculated from Equation (2). (b) Relationship
[image:7.595.136.461.519.684.2]centration of MNPs (r = 0.992, P < 0.05) and the number of MNF sheets (r = 0.997, P < 0.05). As shown in Figure 9,
(
∆ ∆T t)
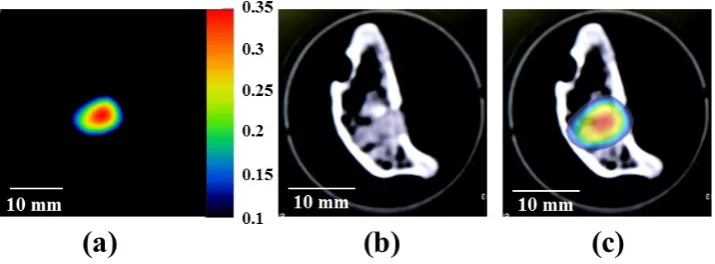
0 had also excellent correlations with the concentration of MNPs (r = 0.994, P < 0.05) and the number of MNF sheets (r = 0.979, P < 0.05).Figures 10(a)-(c) show the MPI image of the MNFs implanted in the bone of a chicken, the X-ray CT image of the bone in which the MNFs were implanted, and the fusion image between the MPI and X-ray CT images, respectively. As shown in Figure 10(a), MPI could clearly visualize the MNFs implanted in the bone, and the position of the MNFs in the MPI image coincided with that in the X-ray CT image (Figure 10(b)), as confirmed by the fusion image between them (Figure 10(c)).
4. Discussion
Chitosan has a cationic linear polysaccharide structure and has great potential for many uses including food, cosmetic, biomedical, and pharmaceutical applications, because it is biocompatible and biodegradable and has cellular-binding, wound-healing, anti-bacterial, and anti-fungal properties [11]. In this study, we developed MNFs by mixing cross-linked chitosan nanofibers with MNPs. This procedure is very simple and easy to im-plement.
As shown in Figure 3, the SEM images clearly indicated that MNPs aggregated like cocoons on chitosan na-nofibers especially when the concentration of MNPs was high. The magnetization measured by VSM (Figure 4) demonstrated that the MNFs developed in this study have a nonlinear response to a magnetic field and the satu-ration magnetization increases with increasing concentsatu-ration of MNPs. These magnetic properties appear to be appropriate for MPI to image these MNFs, and the MNFs could be successfully visualized using our MPI scan-ner (Figure 5, Figure 6, and Figure 10). Furthermore, the average MPI value showed excellent correlation with the concentration of MNPs (r = 0.992, P < 0.05) (Figure 8(a)) and the number of MNF sheets (r = 0.997, P < 0.05) (Figure 8(b)), indicating that MPI can quantify the quantity of MNPs in the MNFs.
As shown in Figure 7, a temperature rise was obtained from the MNFs under an alternating magnetic field, suggesting that the MNFs can be used as a source of magnetic hyperthermia. Furthermore,
(
∆ ∆T t)
0 showed excellent correlation with the concentration of MNPs (r = 0.994, P < 0.05) (Figure 9(a)) and the number of MNF sheets (r = 0.979, P < 0.05) (Figure 9(b)). These results suggest that it is possible to perform local tem-perature control in magnetic hyperthermia by changing the concentration of MNPs in the MNFs and the number or thickness of MNF sheets. Such local temperature control will be important for reducing the side effects and risks of heating surrounding healthy tissues in magnetic hyperthermia.In addition to the fact that MNFs can be visualized using MPI and can be heated using an alternating magnetic field (Figures 5-10), and that the concentration of MNPs and the number or thickness of MNF sheets can be easily changed, the advantage of the MNFs is that the MNFs can be freely transformed into a desired shape ac-cording to the purpose or the shape and/or size of the targeted region, as shown in Figure 10. This aspect also appears to be useful for realizing reliable and safe cancer therapy or tissue regeneration using MNFs.
[image:8.595.122.480.554.686.2]As previously described, MPI could successfully visualize the MNFs as a positive contrast (Figure 5, Figure 6, and Figure 10). This excellent visibility of MPI appears to be useful for in vivo monitoring of the effective-
Figure 10. (a) MPI image of the MNFs (150 mM Fe) implanted in the bone of a chicken, (b) X-ray CT image of the bone implanted with MNFs, and (c) the fusion image between the MPI and X-ray
ness of cancer therapy or tissue regeneration using MNFs. Another imaging method to detect MNPs is magnetic resonance imaging (MRI). When we attempted to image MNPs using MRI with a conventional transverse relax-ation time ( *
2
T )-weighted imaging sequence, it was almost impossible due to large susceptibility-induced MR signal loss and image distortions in the regions near the MNPs. Recently, however, MRI pulse sequences capa-ble of preserving the signal from spins with ultrashort *
2
T , such as ultrashort echo time (UTE) [17] and sweep imaging with Fourier transformation (SWIFT) sequences [18], have been developed. With these pulse sequences, MNPs can be detected and quantified based on the shortening of the longitudinal relaxation time of water (T1) [18]. Zhang et al. [19] reported that the reciprocal of T1 measured using the SWIFT sequence combined with the Look-Locker method has a linear relationship with MNPs concentration up to 53.6 mM Fe. Although their me-thod also appears to be promising and useful for detecting MNPs, significant research and technology develop-ment will be necessary before establishing the effectiveness of their method when translated to animal and/or human studies [20].
Recently, multifunctional nanofibers have been developed by electrospinning polymers mixed with an addi-tional compound such as biomolecules or by surface modification with peptides or proteins [21]. These func-tional nanofibers are promising for more diverse applications such as drug delivery, tissue engineering, and wound healing [21]. Functionalizing MNFs by mixing with an additional compound or by surface modification would yield more diverse applications of MNFs and MPI might provide a new imaging strategy for monitoring the effectiveness of the functionalized MNFs in these applications.
Although the present study is limited to phantom and ex vivo studies, we will perform in vivo studies using small animals in the near future in order to investigate the feasibility of practical application of the MNFs de-veloped in this study.
5.
Conclusion
In this study, we developed MNFs by mixing cross-linked chitosan nanofibers with MNPs, and investigated the feasibility of visualizing them using MPI and of heating them using an alternating magnetic field. Our results demonstrate that the MNFs developed in this study can be visualized using MPI and can be used as a source of magnetic hyperthermia, and suggest that MNFs will be useful in biomedicine including cancer therapy and tis-sue regeneration.
Acknowledgements
This work was supported by a Grant-in-Aid for Scientific Research (B) (Grant Number: 25282131) from the Ja-pan Society for the Promotion of Science (JSPS).
Declaration of Interest
The authors report no conflicts of interest. The authors alone are responsible for the content and writing of the paper.
References
[1] Bock, N., Riminucci, A., Dionigi, C., Russo, A., Tampieri, A., Landi, E., Goranov, A.A., Marcacci, M. and Dediu, V. (2010) A Novel Route in Bone Tissue Engineering: Magnetic Biomimetic Scaffolds. Acta Biomaterialia, 6, 786-796. http://dx.doi.org/10.1016/j.actbio.2009.09.017
[2] Giannoudis, P.V., Einhorn, T.A. and Marsh, D. (2007) Fracture Healing: The Diamond Concept. Injury, 38, S3-S6. http://dx.doi.org/10.1016/S0020-1383(08)70003-2
[3] Meng, J., Xiao, B., Zhang, Y., Liu, J., Xue, H., Lei, J., Kong, H., Huang, Y., Jin, Z., Gu, N. and Xu, H. (2013) Su-per-Paramagnetic Responsive Nanofibrous Scaffolds under Static Magnetic Field Enhance Osteogenesis for Bone Re-pair in Vivo. Scientific Reports, 3, Article No. 2655. http://dx.doi.org/10.1038/srep02655
[4] Li, G., Feng, S. and Zhou, D. (2011) Magnetic Bioactive Glass Ceramic in the System CaO-P2O5-SiO2-MaO-CaF2- MnO2-Fe2O3 for Hyperthermia Treatment of Bone Tumor. Journal of Materials Science: Materials in Medicine, 22, 2197-2206. http://dx.doi.org/10.1007/s10856-011-4417-1
Generating an Alternating Electromagnetic Field. Clinical and Experimental Metastasis, 24, 191-200. http://dx.doi.org/10.1016/j.actbio.2012.03.045
[6] Lin, T.C., Lin, F.H. and Lin, J.C. (2012) In Vitro Feasibility Study of the Use of a Magnetic Electrospun Chitosan Na-nofiber Composite for Hyperthermia Treatment of Tumor Cells. Acta Biomaterialia, 8, 2704-2711.
http://dx.doi.org/10.1016/j.actbio.2012.03.045
[7] Gleich, B. and Weizenecker, J. (2005) Tomographic Imaging Using the Nonlinear Response of Magnetic Particles. Nature, 435, 1214-1217. http://dx.doi.org/10.1038/nature03808
[8] Goodwill, P.W., Konkle, J.J., Zheng, B., Saritas, E.U. and Conolly, S.M. (2012) Projection X-Space Magnetic Particle Imaging. IEEE Transactions on Medical Imaging, 31, 1076-1085. http://dx.doi.org/10.1109/TMI.2012.2185247 [9] Murase, K., Hiratsuka, S., Song, R. and Takeuchi, Y. (2014) Development of a System for Magnetic Particle Imaging
Using Neodymium Magnets and Gradiometer. Japanese Journal of Applied Physics, 53, Article ID: 067001. http://dx.doi.org/10.7567/JJAP.53.067001
[10] Murase, K., Song, R. and Hiratsuka, S. (2014) Magnetic Particle Imaging of Blood Coagulation. Applied Physics Let-ters, 104, Article ID: 252409. http://dx.doi.org/10.1063/1.4885146
[11] Dutta, A.K., Kawamoto, N., Sugino, G., Izawa, H., Morimoto, M., Saimoto, H. and Ifuku, S. (2013) Simple Prepara-tion of Chitosan Nanofibers from Dry Chitosan Powder by the Start Burst System. Carbohydrate Polymers, 97, 363- 367. http://dx.doi.org/10.1016/j.carbpol.2013.05.010
[12] Murase, K., Konishi, T., Takeuchi, Y., Takata, H. and Saito, S. (2013) Experimental and Simulation Studies on the Be- havior of Signal Harmonics in Magnetic Particle Imaging. Radiological Physics and Technology, 6, 399-414.
http://dx.doi.org/10.1007/s12194-013-0213-6
[13] Murase, K., Banura, N., Mimura, A. and Nishimoto, K. (2015) Simple and Practical Method for Correcting the Inho-mogeneous Sensitivity of a Receiving Coil in Magnetic Particle Imaging. Japanese Journal of Applied Physics, 54, Ar-ticle ID: 038001. http://dx.doi.org/10.7567/JJAP.54.038001
[14] Murase, K., Oonoki, J., Takata, H., Song, R., Angraini, A., Ausanai, P. and Matsushita, T. (2011) Simulation and Ex-perimental Studies on Magnetic Hyperthermia with Use of Superparamagnetic Iron Oxide Nanoparticles. Radiological Physics and Technology, 4, 194-202. http://dx.doi.org/10.1007/s12194-011-0123-4
[15] Box, G.E.P. and Lucas, H.L. (1959) Design of Experiments in Nonlinear Situations. Biometrika, 46, 77-90. http://dx.doi.org/10.1093/biomet/46.1-2.77
[16] Murase, K., Takata, H., Takeuchi, Y. and Saito, S. (2013) Control of the Temperature Rise in Magnetic Hyperthermia with Use of a Static Magnetic Field. Physica Medica, 29, 624-630. http://dx.doi.org/10.1016/j.ejmp.2012.08.005 [17] Robson, M.D., Gatehouse, P.D., Bydder, M. and Bydder, G.M. (2003) Magnetic Resonance: An Introduction to
Ultra-short TE (UTE) Imaging. Journal of Computer Assisted Tomography, 27, 825-846. http://dx.doi.org/10.1097/00004728-200311000-00001
[18] Idiyatullin, D., Corum, C., Park, J.Y. and Garwood, M. (2006) Fast and Quiet MRI Using a Swept Radiofrequency. Journal of Magnetic Resonance, 181, 342-349. http://dx.doi.org/10.1016/j.jmr.2006.05.014
[19] Zhang, J.J., Chamberlain, R., Etheridge, M., Idiyatullin, D., Corum, C., Bischof, J. and Garwood, M. (2014) Quantify-ing Iron-Oxide Nanoparticles at High Concentration Based on Longitudinal Relaxation UsQuantify-ing a Three-Dimensional SWIFT Look-Locker Sequence. Magnetic Resonance in Medicine, 71, 1982-1988.
http://dx.doi.org/10.1002/mrm.25181
[20] Hoopes, P.J., Petryk, A.A., Tate, J.A., Savellano, M.S., Strawbridge, R.R., Giustini, A.J., Stan, R.V., Gimi, B. and Gar- wood, M. (2013) Imaging and Modification of the Tumor Vascular Barrier for Improvement in Magnetic Nanoparticle Uptake and Hyperthermia Treatment Efficacy. Proceedings SPIE Energy-Based Treatment of Tissue and Assessment VII, 8584, Article ID: 858403. http://dx.doi.org/10.1117/12.2008689