Munich Personal RePEc Archive
Human Development in Northeastern
Region of India: Issues and Challenges
Nayak, Purusottam
North Eastern Hill University
10 August 2012
Online at
https://mpra.ub.uni-muenchen.de/41582/
Human Development in Northeastern Region of India: Issues and Challenges
Purusottam Nayak
Abstract
The paper is a brief account of findings of various human development reports and studies undertaken by individual researchers on the states of northeast India. The findings reveal that achievement of northeastern region is quite satisfactory in comparison to all India average achievements in some dimensions of human development but it has miserably failed in bringing commensurate economic growth and equitable distribution. There exists wide spread disparity of socioeconomic achievements across different states and within, from urban to rural areas and between male and female. If the problems of poor economic growth, poverty, gender disparity and general health of the people are not properly addressed the region may fall into the trap of vicious quadrant instead of moving to a virtuous one. The way out from this trap is through achievement of a productive, balanced and sustainable economy with appropriate intervention in health sector and poverty alleviation programs.
Introduction
UNDP for the first time took initiative in preparing human development report at the
global level in 1990. Since then it has been a regular exercise to produce reports on an annual
basis, of course, with emphasis on different themes. Similar such exercises have also been
undertaken by various countries including India with the help of UNDP. The National Human
Development Report (NHDR) is an outcome of the Central Government in this regard (GoI,
2002). Subsequently, six out of eight northeastern states joined the race in publishing human
developments reports for their individual states at different points of time in the first decade of
21st century. Although for the other two states, namely, Manipur and Mizoram, reports are yet to
be published some information, however, is available from the works of individual researchers.
To have an idea about the region let us have a glance over these reports, research works of some
individual authors and recent available data on development indicators of different states in the
region.
The Region
The NHDR provides us information about the status and growth of human development
in different states in the country including various states in the northeastern region of India.
However, data for the northeast are somewhat outdated. Though report was published in 2002 it
states in the country beyond 1991. The report reveals that the region comprising of the eight
states of Arunachal Pradesh, Assam, Manipur, Meghalaya, Mizoram, Nagaland, Sikkim (the last
to be included in the region) and Tripura, constitutes a land surface of 262,230 square kilometers
where a population of 38.9 million belonging to different ethnic and cultural groups inhabits.
Topographically the region is a mixture of hills and plains. While Arunachal Pradesh,
Meghalaya, Mizoram, Nagaland and Sikkim are almost entirely hilly, about four fifths of Assam
is plain. Manipur and Tripura have both plain areas and hilly tracts. The hills account for about
70 per cent area and accommodate about 30 per cent of population of the region and the plains
constituting the remaining 30 per cent of area hold about 70 per cent of its population. Wide
variation in altitude coupled with abundance of rainfall has given rise to wide variations in
climatic conditions within the region which in turn has endowed the region with rich
bio-diversity. The richness of bio-diversity of the region is almost matched by its ethnic bio-diversity.
The region is a meeting place of large number of races, creeds, cultures and languages. The
impingement of the diversity of physical and cultural environment is naturally found in the
organization of economic life of the people of the region.
According to the report, the Human Development Index (HDI) during 1981 in the region
varied from the lowest figure of 0.242 in Arunachal Pradesh to the highest of 0.461 in Manipur
as against national average of 0.302. Similarly in 1991 the lowest and highest figures were 0.328
(Arunachal Pradesh) and 0.548 (Mizoram) as against 0.389 at the national level. Some of the
states in the region in this regard were much ahead of India. However, there was a yawning gap
between urban and rural areas. The rural-urban disparity index varied from the lowest figure of
0.113 in Manipur to the highest of 0.234 in Tripura in 1981. The situation did not improve much
in 1991. Instead it got deteriorated in Meghalaya. Contrary to popular perceptions, the status of
women in the region was far from being on an equal footing with that of men. Particularly
gender disparities were consistently very high in Tripura and Assam and varying widely from
one state to another. It was lower in four states, namely, Manipur, Meghalaya, Nagaland and
Sikkim in the year 1981 as compared to all India average situations. In 1991, however, five states
such as Manipur, Meghalaya, Arunachal Pradesh, Mizoram and Nagaland went ahead of the
country.
The UNDP (2003) in its human development report devoted for the first time an entire
the recent past the area in which the region seems to have had done better than the nation as a
whole was the social sector and more particularly in the spread of literacy. Though the region
somewhat lagged behind the country in terms of literacy during seventies, by the beginning of
the twenty first century it surpassed the average national achievements in this regard. Individual
states such as Mizoram, Tripura, Manipur and Nagaland marched ahead of the country average,
Assam more or less kept pace with the national average, and starting from relative backwardness
in 1971, by 2001 Meghalaya and Arunachal Pradesh closed gaps with the country average.
Considering that Arunachal Pradesh had a literacy rate of only 11.30 per cent in 1971, the
attainment to 54.34 per cent by 2001 constituted a huge progress in just three decades. Besides,
female literacy in the region surpassed the corresponding female literacy rate in the country. The
infant mortality rate came down well below the country average in all the states of the region
barring Assam. While identifying yawning gap between urban and rural areas in human
development, the report mentioned that educational, health care and other welfare services were
heavily concentrated in the urban areas. Though the region achieved significant progress in
literacy, it was “marred” by rural-urban disparities, inter-district variations and a high dropout
rates in schools. Barring Manipur, the dropout rate in schools exceeded 60 per cent. A striking
feature of the health sector was that there was a wide inter-state disparity. For instance, while
Mizoram had just a single nurse for every 22,000 persons, it was 5353 persons in case of Assam.
The incidence of rural poverty was far greater in the region. More than 39 per cent of the rural
population was living below the poverty line. The report also busted some popular myths of
higher status of women in the northeast, particularly on their education and empowerment.
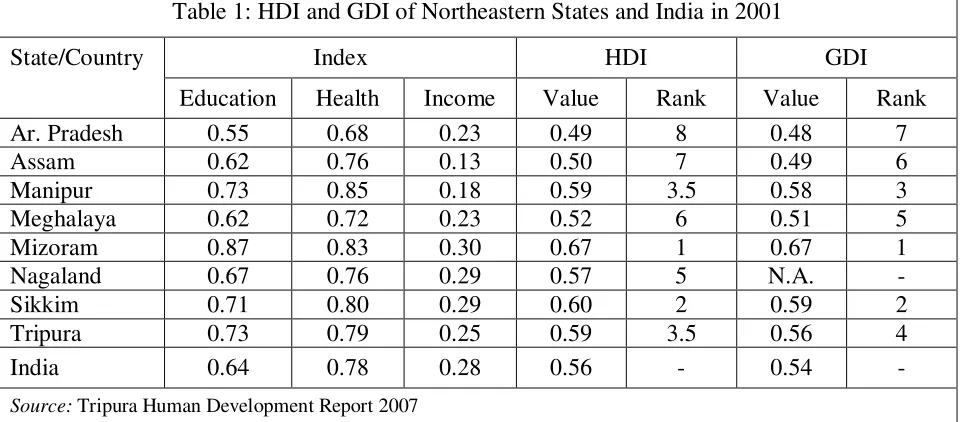
The latest information on estimated HDI available for all the northeastern states is for the
year 2001 in the Human Development Report published by the Tripura state government (GoT,
2007). According to this report the performance of human development across states in the
region varied significantly (Table 1). Mizoram and Arunachal Pradesh witnessed the highest and
lowest HDI of 0.67 and 0.49 respectively as against the all India average of 0.56. Only three
states of northeast, namely, Arunachal Pradesh, Assam and Meghalaya lagged behind all India
average whereas performance of other five northeastern states surpassed India. Similar situations
prevailed in different components of human development such as in education, health and
income indices. Mizoram not only got the first rank in terms of HDI but also first rank in GDI.
HDI and GDI. It is to be noted that Meghalaya in spite of having a matrilineal society performed
[image:5.612.67.547.148.359.2]very poorly in terms of GDI and got 5th rank among all the northeastern states.
Table 1: HDI and GDI of Northeastern States and India in 2001
State/Country Index HDI GDI
Education Health Income Value Rank Value Rank Ar. Pradesh 0.55 0.68 0.23 0.49 8 0.48 7
Assam 0.62 0.76 0.13 0.50 7 0.49 6
Manipur 0.73 0.85 0.18 0.59 3.5 0.58 3 Meghalaya 0.62 0.72 0.23 0.52 6 0.51 5 Mizoram 0.87 0.83 0.30 0.67 1 0.67 1 Nagaland 0.67 0.76 0.29 0.57 5 N.A. - Sikkim 0.71 0.80 0.29 0.60 2 0.59 2 Tripura 0.73 0.79 0.25 0.59 3.5 0.56 4
India 0.64 0.78 0.28 0.56 - 0.54 -
Source: Tripura Human Development Report 2007
State Human Development Reports
During the last few years human development reports in the region have also been
prepared for six individual states like Sikkim (GoS, 2001), Assam (GoA, 2003), Nagaland (GoN,
2004), Arunachal Pradesh (GoAP, 2005), Tripura (GoT, 2007) and Meghalaya (GoM, 2008)
with the sponsorship of UNDP and the Planning Commission, Govt. of India whereas for the
other two states like Manipur and Mizoram, the reports are yet to be published.
Sikkim
Sikkim is the first state in the region to produce state human development report.
According to the report it is a landlocked state being bounded on the north and north-east by
Tibet, on the east by Bhutan, on the west by Nepal and on the south by the Darjeeling district of
West Bengal. It became the twenty-second state of the Indian Union in 1975 and recently it has
been included as the eighth and last state in the North Eastern Region of India with a population
of 5.4 lakhs according to 2001 Census. The state has a mixed performance in the area of
development and growth. The per capita Net State Domestic Product (NSDP) in real terms in the
state witnessed a substantial increase, i.e. from Rs. 1571 in 1980–81 to Rs. 9472 in 1995–96.
cent in 1951 to almost 70 per cent in 2001. In 1998–99, as against the national average of 47 per
cent, only 21 per cent of children below 3 years were malnourished—the lowest among all the
Indian States and Union territories.
Physical indicators of the quality of life suggested reasonable provisioning of many basic
amenities in the state. According to the National Family Health Survey-II over 80 per cent of
households had electricity as against 60 per cent in the country. Almost 85 per cent of
households had drinking water as against 78 per cent in India. Close to 73 per cent of households
had a toilet or latrine facility as against 36 per cent for the whole country. It had a HDI value of
0.532 as against all India average of 0.563 in 1998 (Table 2). Though the state recorded several
significant gains in human development, particularly in terms of education and health indicators,
it failed miserably in terms of per capita income indicator (0.292). North Sikkim remained as the
worst performer with lowest rank both in HDI and GDI. In contrast to this, East Sikkim got the
first in HDI whereas South Sikkim got first rank in GDI.
Table 2: HDI and GDI of Sikkim in 1998
District/State Index HDI GDI
Education Health Income Value Rank Value Rank
North 0.607 0.512 0.282 0.467 4 0.467 4 East 0.694 0.730 0.310 0.578 1 0.567 2 West 0.589 0.687 0.271 0.576 2 0.518 3 South 0.613 0.692 0.282 0.529 3 0.571 1 Sikkim 0.641 0.663 0.292 0.532 - 0.528 -
Source: Sikkim Human Development Report 2001
The proportion of population living below income poverty went up from 36 per cent in
1987–88 to 41 per cent in 1993–94. There was, however, a large disparity in the prevalence of
income poverty between rural and urban areas. In 1993–94, for instance, only 8 per cent of the
urban population lived below the poverty line as against 45 per cent in rural areas. In 1998–99,
61 per cent of women and 77 per cent of children below 3 years of age were reported to be
suffering from anemia. Progress on the industrial front had been constrained by many factors
including lack of appropriate infrastructure and trained manpower. The benefits of growth and
human development in the state had not been equitably distributed across districts. Although the
1996–97 to 1997–98 and the technology used was often obsolete. The service sector, particularly
health, education and eco-tourism has a huge potential to absorb the workforce of the state
through employment generation.
Assam
At the time of independence of the country the entire northeastern region consisted of
only three administrative units of which two were princely states, namely Manipur and Tripura,
and the rest of the region was undivided Assam province. In the post independence period
Arunachal Pradesh, Meghalaya, Mizoram, and Nagaland were carved out from Assam at
different points of time. Presently Assam is the biggest and most important state in the region
having border with Arunachal Pradesh in the east, West Bengal, Meghalaya and Bangladesh in
the west, Arunachal Pradesh and Bhutan in the north and Manipur, Meghalaya, Mizoram,
Nagaland and Tripura in the south with a total population of 2.66 crores according 2001 Census
of India. The economy of the state is mainly based on agricultural activities and exploration of
oil. It produces a significant percentage of the total tea production in the globe and more than
half of India’s petroleum. A close examination of the report of Assam reveals that in spite of
abundant natural resources, the state is lagging behind the rest of the country and the gap is
increasing. Per capita income of the state during independence period was only marginally less
than that of the average for the country. In 1998 per capita income for the country was over 1.8
times that of Assam. Industrial diversification and growth were constrained by the inadequacy
and quality of complementary infrastructure, the geographical isolation of the region, and the
lack of well developed markets.
There is also inter-district inequity. The per capita income of the district with the highest
income is more than three times that of the district with the lowest per capita income. In
1994-95, seven districts accounted for nearly half of the State Domestic Product and the remaining
sixteen districts contributed to the other half. Kamrup district contributed almost a fifth of the
state’s Gross Domestic Product (GDP) originating in the tertiary sector, and over a sixth of
state’s GDP in the secondary sector. At the other end of the scale, the North Cachar Hills district
contributed only one per cent of the state’s GDP in the secondary sector, and about 1.5 per cent
in the primary and tertiary sectors.
The incidence of unemployment, measured as a per cent of the labor force, has been
dominate the sectoral composition of workers although the share has been declining. The
substantial increase has been in the tertiary sector. Throughout the state the rate of work
participation for men is higher than that for women. The female work participation rate is higher
in rural areas than in urban areas. While female marginal workers are almost negligible in urban
areas, a sizeable proportion of women in the rural areas participate in work in a marginal
capacity. The per cent of women workers in the primary sector actually increased during
1971-2001, indicating that more women are now entering the work force in the agriculture sector.
Unemployment increased during 1983–2000, both in rural and urban areas. The unemployment
per cent in urban area was extremely high, 9.8 per cent in 1999-2000, and as much as 20.5 per
cent for women.
Assam has an extremely high proportion of its population living in poverty. Despite a
decline in the proportion, more than a third of its people are below the poverty line. The per cent
of poor in the state is the highest (36.03 per cent) among the seven states of the North East.
There is a rural-urban divide; two out of five people in rural areas are likely to be under the
poverty line, while in urban Assam, the incidence is less than one in ten. Rural poverty was much
higher (40.04 per cent) than urban poverty (7.47 per cent) in 1999-2000 and the incidence of
rural poverty was higher than the all India figure of 27.09 per cent.
There are several positive features of the education sector, and its development over the
last two decades. There has been impressive growth of the elementary education. This is
reflected in the significant increase in the number of primary and middle schools, the number of
teachers at the primary and middle levels, in enrolments and in improved school infrastructure.
Enrolment in schools, measured by gross and net enrolment ratios has increased.
Assam has been moving towards the attainment of the goal of ‘health for all’. The State
Government has emphasized not only the adequate provision of primary health care, but
education and awareness of health issues, dissemination of information on prevention, hygiene
and healthy practices, food security and nutrition, safe drinking water and good sanitation,
maternal and child health and family welfare. People in the state now live longer than their
parents did, and health profiles have improved. Yet, health indicators in the state reveal inequity
– between districts, between income and other groupings. There is a rural – urban divide, and a
gender gap reflected across almost all indicators. Life Expectancy at Birth (LEB) is below that of
could expect to live longer than women. This has since been reversed; women can now expect to
live longer than men. This is a trend that began to take place initially in urban areas, but is now
true of rural areas as well. There is still a very significant gap between the LEB for rural and for
urban areas. There is rural–urban gap and a gender gap here too; males have a better chance of
surviving beyond forty years of age.
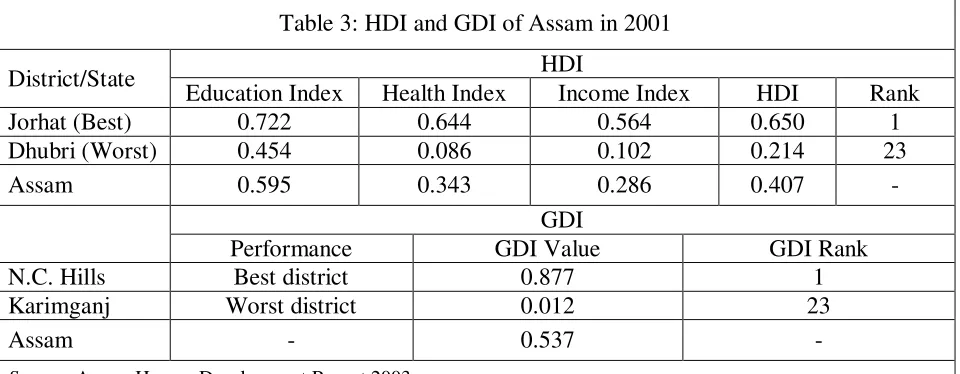
As regards human development, HDI value was as low as 0.407 in the state as against the
lowest value of 0.214 in Dhubri and highest value of 0.650 in Jorhat (Table 3). Thus there was a
widespread variation in the performance of human development across districts in the state. Out
of 23 districts in the state 16 of them were having below the average performance of the state.
While the state witnessed educational index as high as 0.595, it performed poorly in income
(0.286) and health (0.343) fronts. Performance in terms of GDI also varied widely across
districts. The best district was N.C. Hills having a GDI value as high as 0.877 as against the
[image:9.612.68.548.343.530.2]worst performance in Karimganj where the corresponding figure was as low as 0.012.
Table 3: HDI and GDI of Assam in 2001
District/State HDI
Education Index Health Index Income Index HDI Rank Jorhat (Best) 0.722 0.644 0.564 0.650 1 Dhubri (Worst) 0.454 0.086 0.102 0.214 23
Assam 0.595 0.343 0.286 0.407 -
GDI
Performance GDI Value GDI Rank
N.C. Hills Best district 0.877 1
Karimganj Worst district 0.012 23
Assam - 0.537 -
Source: Assam Human Development Report 2003
Nagaland
According to the state human development report, Nagaland emerged as a state out of the
Naga Hills district of Assam and North-East Frontier Agency (NEFA) province in 1963. It is a
land of diverse tribes, systems of governance, cultures, and variety. The state has been
confronting insurgency on a continuous basis, committing much of its scarce resources to
The NSDP of Nagaland showed an increase from Rs. 10,547 lakh in 1980–81 to Rs.
57,898 lakh in 1990–91 (at constant 1980–81 prices) and further to Rs. 223,042 lakh in 2000–01
(at constant 1993–94 prices). The per capita income also increased from Rs. 1361 in 1980–81 to
Rs. 5520 in 1990–91. During 2000–01, per capita income was Rs. 11,473 (at constant 1993–94
prices) as against Rs. 10,306 for the country as a whole.
There has been a phenomenal increase in the levels of literacy in the state. Literacy rate
which was 20.4 per cent in 1961 increased to 67.11 per cent in 2001. However, against a national
increase of 21.39 per cent during the period from 1991 to 2001, the state witnessed an increase of
only 8.86 per cent. A positive aspect of the state is the increase in the female literacy, which was
13 per cent in 1961 but steadily increased to 39.9 per cent in 1981 and further to 61.92 per cent
in 2001. Women literacy rate and the enrolment rates for girls in the state were higher than the
national average.
Despite various challenges the indicators for health in the state are impressive. The
positive achievements are improving sex ratios, absence of female foeticides and low maternal
mortality rate. There are almost no cases of malnourishment among women and children. The
life expectancy at birth were calculated at 73.4 years, way above the national average of 62.3
years, and much closer to the figures in developed countries. Infant mortality rate at 42.2 per
1000 was also much better than the national average of 68 per 1000 live births. Similarly,
under-five mortality rate, per 1000 live births, was 63.8 as against the national figure of 96. In terms of
maternal mortality rate, the state’s figure of less than 1 per 1000 live births, against the national
average of 5.4, was much closer to the figures in developed countries. However, the total fertility
rate at 3.77 has been a cause for concern.
The HDI of the state was estimated to be as high as 0.623 as compared to 0.472 for the
country as a whole in 2001 (Table 4). The state’s good performance and ranking can be best
understood by looking at the constituents of the indices and the factors that influence them
including literacy, health status and income levels. According to per capita indicator it was
almost at par with the national average. Literacy rate in the state was higher by 1.8 per cent over
the national average of 65.2 per cent. However it witnessed wide variations in terms of HDI
across districts. HDI was estimated to be highest in Dimapur (0.733) as against the lowest figure
of 0.450 in Mon district. Mon district was the worst performer both in HDI and GDI. While
Table 4: HDI and GDI of Nagaland in 2001
District/State HDI Rank GDI Rank
Dimapur 0.733 1 0.472 1
Mokokchung 0.705 2 0.460 3
Wokha 0.699 3 0.448 5
Kohima 0.674 4 0.580 1
Phek 0.652 5 0.450 4
Zunheboto 0.611 6 0.414 6
Tuensang 0.512 7 0.299 7
Mon 0.450 8 0.220 8
Nagaland 0.623 - 0.420 -
Source: Nagaland Human Development Report 2004
Arunachal Pradesh
Arunachal Pradesh is one of the remotely located border states of the region. The state,
according to its human development report, had a primitive economy with a low level of
development and meager infrastructural facilities at the time of independence of the country;
however, the people living in the state did have enormous traditional skills which have been
passed down through the generations. During the beginning of 1970s, the per capita income was
63.38 per cent of the per capita national income and by the end of that decade it was increased to
75 per cent. During the 1980s the state moved faster than that that of the country as a whole. By
the beginning of the 1990s, it surpassed the national average and from 1991-92 to 1995-96, it
continued to remain higher. After 1995-96, however, the growth of income slowed down. In
1999-2000, it stood at 84.64 per cent of the national average. An examination of the relative per
capita Net District Domestic Product (NDDP) showed substantial variation across districts. The
per capita income of Lower Subansiri was less than half of the richest district, Dibang Valley.
A poverty estimate made by the Directorate of Rural Development of the state showed
that 54 per cent of families in rural Arunachal Pradesh were poor in 1992-93 which increased to
78 per cent in 1997-98. The estimates also showed a high degree of inter-district variation in
both the periods. In 1997-98, East Kameng had the lowest incidence of poverty (49 per cent)
In the beginning of the 20th century, the state did not have a single school. The first
school was established in Pasighat in 1918, and the second in 1922 at Dambuk. At the time of
Independence, there were only three schools in the entire state and that too only up to the
primary level. In 1951, as many as 67 Lower Primary (LP) schools were set up including one
middle school. The big spurt in the expansion of schools was during 1981-91 after which the
growth has been more gradual. The literacy rate increased from 25.55 per cent in 1981 to 54.34
per cent in 2001. In spite of a steady increase in literacy, it remained low as compared to the
national average of 64.80 per cent. The rate varied from the highest of 34.94 per cent in Lohit
district to as low as 9.39 per cent in East Kameng district. In East Kameng and Upper Subansiri
districts the female literacy rates were as low as 3.52 and 6.48 per cent respectively. During
1991-2001, enrolment in middle and secondary schools doubled, and in the primary schools it
went up by a little over 50 per cent.
Though health status of the people in the state improved it was not able to keep pace with
the spread of literacy or the growth of income. There were no estimates available for life
expectancy during 1950-51. It was estimated to be 54.05 years in 2000 which was not only 9.25
years less than the national average but also being one of the lowest in the country and 4.56 years
less than that of the neighboring state Assam. People who lived in districts situated in the upper
hill ranges had lower life expectancies than those who lived in districts located in the plains and
plateaus. The state had an infant mortality rate (IMR) of 77 per 1,000 live births as against 14 in
Kerala and 75 in Assam. Though IMR did not vary between sexes, considerable inter-district
variation existed. Kurung Kumey had the highest IMR of 133 as against the lowest of 53 in
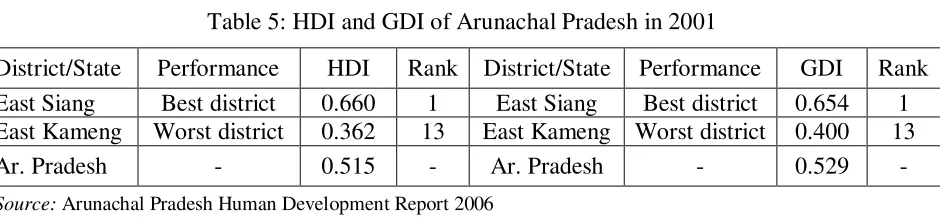
[image:12.612.75.545.530.640.2]Lower Dibang Valley.
Table 5: HDI and GDI of Arunachal Pradesh in 2001
District/State Performance HDI Rank District/State Performance GDI Rank
East Siang Best district 0.660 1 East Siang Best district 0.654 1 East Kameng Worst district 0.362 13 East Kameng Worst district 0.400 13 Ar. Pradesh - 0.515 - Ar. Pradesh - 0.529 -
Source: Arunachal Pradesh Human Development Report 2006
The HDI for the state for the year 2001 was estimated to be 0.515 and the education
index, health index and income index were respectively 0.566, 0.484 and 0.495 (Table 5).
Siang district had the first rank with an HDI of 0.660 as against the lowest of 0.362 in East
Kameng. East Siang was not only best performer in HDI but also in GDI. Similarly East Kameng
was worst performer both in HDI and GDI. Variations across districts were more acute in terms
of income index followed by education and health index. The GDI for the state was estimated to
be as high as 0.529. GDI rankings of various districts in the state followed a similar ranking
pattern as HDI implying the fact that the districts having relatively better HDI did better in GDI
and the districts with relatively lower HDI values had higher gender inequity.
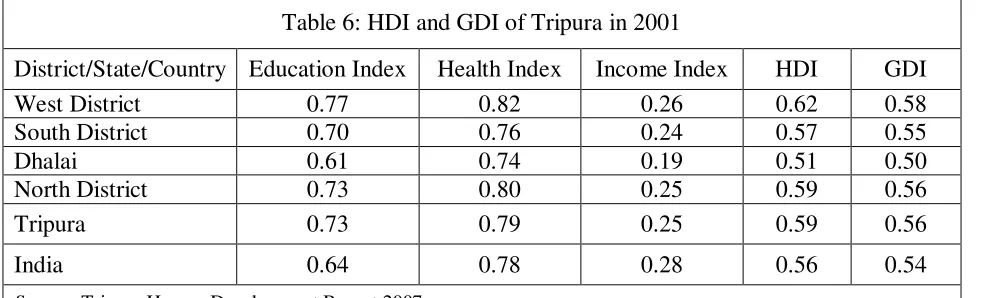
Tripura
Human development report of Tripura observes that it is a land-locked state of three
million populations of which 31 per cent are tribal people. Overcoming the odds inherited by the
state caused by the partition of the Country on the eve of freedom, the people of the state
experienced significant progress in the social, economic and political spheres. The state made
substantial progress in the expansion of literacy and schooling in the 1990s. In 2001, it witnessed
a literacy rate of 73 per cent as against 65 per cent in the region and 63 per cent in India. Among
the N.E. states, Tripura ranked second after Mizoram, and its rank improved during 1991-2001.
Estimates showed that in 2001, life expectancy at birth for males and females in the state
was 71 years and 74 years respectively. In terms of life expectancy, attainments in the state were
higher than the national average, which was 61 for males and 62.5 for females. There was,
however, inter-district variations. Women in West District lived five years longer than women in
Dhalai; men in West District lived four years longer than men in Dhalai. Infant mortality rate in
the state was as high as 52 as against 30 in Manipur and 57 in India in 2005-06. IMR instead of
declining increased from 44 in 1998-99 to 52 in 2005-06. District-level estimates indicated that
Dhalai had the highest IMR followed by South, North and West Districts. IMR for girls in Dhalai
district even was lower than the all-India IMR.
In 2001–02, the per capita income of the state was Rs 18,759. In terms of access to
resources, the average person in Tripura had fewer resources than the average person in India.
The growth record of incomes, however, has been remarkable. The compound annual growth
rate of NSDP was 5.2 per cent in the 1980s and 6.7 per cent in the 1990s. In fact, in several
years, the annual rate of growth of SDP exceeded 10 per cent. Moreover, when India had a
All the districts showed a good performance in terms of growth rates, although with variations,
being lowest in Dhalai (6.1 per cent) and highest in North District (7.9 per cent).
The estimated HDI for the state was 0.59 in 2001 and following the classification used by
the UNDP, the achievements correspond to the ‘medium’ level (Table 6). While education and
health indices were as high as 0.73 and 0.79 respectively, income index was too low at 0.25
implying a very poor performance in per capita income. The estimated value of GDI was 0.56.
The ranks of the districts in terms of GDI and its components were similar to the ranking of
districts with respect to HDI other than in terms of the ‘equally distributed income index’. West
District, which ranked first in terms of the income index, ranked second in terms of the equally
distributed income index. The noteworthy feature of these estimates is that the HDI and GDI for
the state were higher than the corresponding values for India. Among the N.E. States, Tripura
shared third rank with respect to the HDI and fourth rank with respect to the GDI. The state
ranked second with respect to the education index and fourth with respect to the health and
[image:14.612.65.559.364.513.2]income indices.
Table 6: HDI and GDI of Tripura in 2001
District/State/Country Education Index Health Index Income Index HDI GDI West District 0.77 0.82 0.26 0.62 0.58 South District 0.70 0.76 0.24 0.57 0.55
Dhalai 0.61 0.74 0.19 0.51 0.50
North District 0.73 0.80 0.25 0.59 0.56
Tripura 0.73 0.79 0.25 0.59 0.56
India 0.64 0.78 0.28 0.56 0.54
Source: Tripura Human Development Report 2007
Meghalaya
The latest human development report among all the northeastern states is that of
Meghalaya. According to the report, Meghalaya emerged as a full-fledged state within Indian
Union on 21st January 1970. The state is bounded by the Brahmaputra valley of Assam in the
north and northwest, the Cachar area of Assam in the east, and Bangladesh in the south and
southwest. The report while examining certain key components of human development in the
state highlighted the achievements and described what else needed to be done to consolidate the
weaknesses of the state, it presented some of the unique socioeconomic features of the state. It
also highlighted the problems of development of the state as perceived by the indigenous people
living in the state. The report mentioned population of the state to be predominantly tribal. 81 per
cent of its people living in rural areas were dependent on agriculture for their livelihood. In spite
of having rich natural resources the state had not been able to provide stimulus for its growth and
development. The state has a long way to go in respect of basic services to improve its health
status, level of education and overall economy. In 2005 the state ranked 26th in HDI, 21st in the
index of social and economic infrastructure, 16th in per capita consumption of electricity, 25th in
road density, 21st in per capita income, 30th in per capita utilization of credit, 27th in literacy rate
[image:15.612.67.546.301.491.2]and 28th in infant mortality rate among all the states and union territories in the country.
Table 7: HDI of Meghalaya in 2001
District.State IMR Literacy Per Capita NSDP (Rs.)
HDI GDI HDI/GDI Rank
East Khasi Hills 34.51 76.98 24793 0.676 0.640 1 West Garo Hills 18.13 51.03 13782 0.571 0.550 2 Ri Bhoi 60.63 66.07 14752 0.496 0.478 3 South Garo Hills 102.01 55.82 23321 0.484 0.477 4 Jaintia Hills 77.34 53.00 20405 0.469 0.437 5 East Garo Hills 86.17 65.64 9926 0.405 0.392 6 West Khasi Hills 90.60 61.70 12047 0.396 0.321` 7 Meghalaya 52.28 63.31 17595 0.550 0.534 -
Source: Meghalaya Human Development Report 2008
In terms of HDI Meghalaya performed poorly (Table 7). From a rank of 21st in 1981, its
position deteriorated to 24th in 1991 and further to 26th in 2005. The state had a HDI value of
0.585 as against a value of 0.858 in Himachal Pradesh. Instead of witnessing a declining urban
infant mortality rate it increased from 44 in 2003 to 46 in 2007. It also witnessed a declining
gross enrolment ratio from 92.19 per cent in 1999-2000 to 87.75 per cent in 2004-05. Though
health and educational status of women were no better than their counterparts in the rest of the
country, because of their higher work participation rate, the state witnessed a better index of GDI
showing women being better off in the state. While West Garo Hills performed poorly in HDI,
widespread disparity of human development and gender development among different districts in
the state.
In terms of health indicators the state had been lagging behind. Different health programs
such as full immunization of children, antenatal care for pregnant mothers, etc had miserably
failed. The literacy rates were marginally lower in the state as compared to all India average. But
the gender gap in the state was not prominent unlike other states in the country. According to a
household survey conducted by the state government in 2002 about 50 per cent of the people
were poor.
Findings of Individual Authors
Study undertaken by Singh (2010) throws some light on the status and trend of
socioeconomic development of the state of Manipur. Geographically Manipur is characterized
into two distinct physical regions– an outlying area of rugged hills and narrow valleys, and the
inner area of flat plain, with all associated land forms. The state is bounded by Nagaland to the
north, Mizoram to the south, Assam to the west and Myanmar to the east. It covers an area of
22,347 square kilometres. The Meiteis, who live primarily in the valley region of the state, form
the majority ethnic group constituting 60 per cent of the total population but occupying only 10
per cent of the total land. The Muslims (Meitei-Pangal) also live in the valley; the Kukis, Nagas,
Hmars and other smaller groups form about 40 per cent of the population but occupy the
remaining 90 per cent of the total land of the state.
According to Singh the state had the highest HDI among all the north-eastern states and it
occupied the 4th position in the all India ranking in 1981. Despite having substantially a low and
erratic per capita income, the overall performance of the state was much better than most of the
Indian states mainly due to its remarkable achievements in respect of literacy, enrolment, and life
expectancy. Though, HDI of the state increased by 11.43 per cent during 1981–91, her all India
rank dropped to 9th position, and in the region the state was 2nd to Mizoram. The state has the
distinction of having the lowest infant mortality rate in the country. It declined from 32 in 1961
to 11 in 2006. Low infant mortality rate indicates better child care emanating from sound child
care practices and awareness among mothers about hygiene and nutrition. Life expectancy at
birth for the state was 68.64 for males and that of 72.42 for females in 1991, as against the
corresponding figures of 62.3 and 63.9 at the national level during 2001–05. As per 2001 census,
per cent increase in NSDP, the state witnessed an increase of employment by 0.67 per cent.
Poverty ratio of the state declined by 65.37 per cent as against the decline of 49.94 at the national
level during the period from 1973–74 to 2004–05. While urban poverty ratio declined by 91.06
per cent in the state in contrast to the decline by 57.66 per cent in rural areas. While national
poverty ratio increased both in the rural and urban areas, there was no such reversal in the state
of Manipur during the period from 1999–2000 to 2004–05.
Agarwal (2010) in his work highlights some of the achievements and weaknesses of the
state of Mizoram. Mizoram became the 23rd state of India in February 1987. The state is located
in the remote north-east corner of the country, sandwiched between international borders of
Myanmar and Bangladesh. As a state it witnessed remarkable progress in terms of literacy rate,
i.e., from 59.90 per cent in 1981 to 88.49 per cent in 2001 and was next only to Kerala having 90
per cent literacy. Gender-based differential in literacy was the lowest in the country at 90.7 per
cent for males as against 86.7 per cent for females. Rural-urban disparities in terms of literacy
rates were as high as 15.5 per cent. Enrolment rate for primary schools in the age group of 6–11
years was 119, while it was substantially lower around 80 for the age group 11–14 years. While
compared to other north-eastern states and all India average, the figure seems to be quite
satisfactory. The figures on dropout rates, however, suggest a worrisome trend for some time.
Along with high enrolment ratios, the state witnessed high dropout rates. In 1994–95, 63 per cent
of students belonging to class I to V left studies before completing class V. In 2006–07, the
dropout rates for the primary and secondary education were 3.93 and 10.54 respectively while
for high schools and higher secondary schools it remained at 23 and 70 respectively. Another
noticeable feature is the high incidence of dropouts in rural areas as compared to urban areas.
The reasons for drop out may be traced in engagement of children in household work and farms
besides poverty, especially in rural areas. According to the report of National Family Health
Survey-3 fertility rate was as high as 2.86 but has been declining over time due to women’s
education and a better standard of living. Besides attaining a high level of literacy it has
performed better on the health front, too. Absence of manufacturing activities and shortage of
skilled manpower has limited the scope of employment opportunities in the state. Another
weakening force in the education system is the non-availability of qualified manpower and other
supportive infrastructural facilities. The major concern is high growth rate of population due to
greater concern is the rural areas where more hospitals equipped with adequate infrastructural
support are required. The state is in dire need of an appropriate delivery mechanism for a
balanced development of human resources.
Current Status of the Region
The information presented and the analysis based on these in the previous paragraphs
mostly refers to outdated data on various human development indicators. Till date attempts have
not been made by any individual researcher, agency/organization or government to construct
HDI for any northeastern state or for the country as a whole based on recently available data.
This is mainly because of the fact that data on all the components of human development are not
yet available. Keeping in view these limitations we have simply presented in this section some
[image:18.612.66.551.329.573.2]available recent data which can throw some light on the status of development in the region.
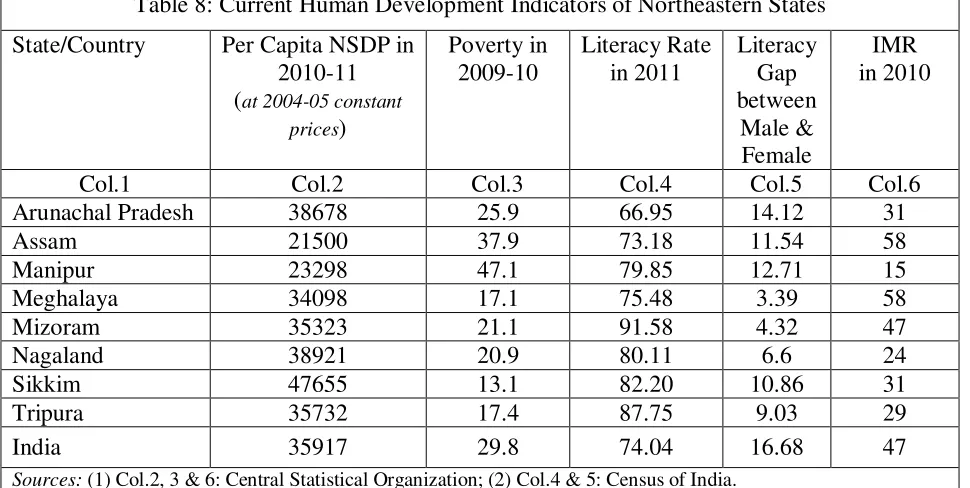
Table 8: Current Human Development Indicators of Northeastern States
State/Country Per Capita NSDP in 2010-11 (at 2004-05 constant
prices)
Poverty in 2009-10
Literacy Rate in 2011
Literacy Gap between
Male & Female
IMR in 2010
Col.1 Col.2 Col.3 Col.4 Col.5 Col.6 Arunachal Pradesh 38678 25.9 66.95 14.12 31
Assam 21500 37.9 73.18 11.54 58
Manipur 23298 47.1 79.85 12.71 15
Meghalaya 34098 17.1 75.48 3.39 58
Mizoram 35323 21.1 91.58 4.32 47
Nagaland 38921 20.9 80.11 6.6 24
Sikkim 47655 13.1 82.20 10.86 31
Tripura 35732 17.4 87.75 9.03 29
India 35917 29.8 74.04 16.68 47
Sources: (1) Col.2, 3 & 6: Central Statistical Organization; (2) Col.4 & 5: Census of India.
Per capita income data reveals that only three states in the region, namely, Sikkim,
Nagaland, and Arunachal Pradesh have surpassed the average per capita income of the country
(Table 8). Although Tripura was lagging behind in this dimension for a long time it has made a
tremendous progress and catching up with the country. The worst performer in this regard are
Assam and Manipur whose per capita income are Rs. 21,500/- and Rs. 23,298 respectively as
all other northeastern states have performed better than the country as a whole. Similar type of
situation and ranking prevailed as regards status of poverty in northeastern states. There was a
wide degree of variation of poor people across states. According to 2009-10 estimates Manipur
had the highest magnitude of poverty followed by Assam. Sikkim witnessed lowest magnitude of
poverty. While India, on an average, had 30 per cent of its people below poverty line the
corresponding figures for the states of Manipur and Assam were as high as 47.1 and 37.9
respectively. All other states in the region were having poverty below the national average.
Mizoram has been retaining consistently its first position in terms of literacy in the
region. While India achieved a literacy rate of only 74.04 per cent, Mizoram achieved literacy
rate as high as 91.58 per cent. The performance of northeastern states in the last decade has been
observed to be better in reduction of gender gap in literacy rates. Among the states that have
been able to reduce the literacy gap to a large extent are Meghalaya, Mizoram and Manipur.
Although infant mortality rate is quite high (47) in the country achievements of some
northeastern states in this regard is quite satisfactory. Excepting Assam, Meghalaya and
Mizoram all other states in northeast has been able to reduce infant mortality rate to a great
extent. There exists, however, further scope to reduce infant mortality rate in the region.
Conclusion and Policy Implications
The findings reveal that achievement of northeastern region has been quite satisfactory in
comparison to all India average situations in some dimensions of human development for both
the sexes. But the region has miserably failed in bringing commensurate economic growth
because of very poor performance of mainly two states, namely, Assam and Manipur of which
Assam is the largest state in the region. There exists widespread disparity of poverty and
socioeconomic achievements across different states and within, from urban to rural areas and
between male and female. If the problems of poor economic growth, poverty, gender disparities
and general health of the people are not properly addressed the region may fall into the trap of
vicious quadrant instead of moving to a virtuous one. To overcome this on priority basis, the
region has to adopt a two-pronged strategy of higher production and equitable distribution. To
move on a path of higher and sustainable economic growth, the region must emphasize on
productive activities instead of depending on central government for higher allocation of funds.
Higher allocation of fund to the region has not been a problem in the last decade. Rather the
There exists a great scope of development in the area of horticulture, particularly production of
fruits such as pine apple and orange, vegetables, mushrooms, culinary herbs and non-food crops
such as flowers and processing of some of these items. Need based scope for expansion of
activities in the areas of fisheries and poultry farming do exists. Initiative should be taken to
bring a change in the design and taste of the handloom and handicraft products of the region that
can attract the customers outside the region and the country. Besides, marketing strategy for
these products need to be devised with the help of experts to explore market of these products
outside the region. There should be an approach of balanced economic development. Emphasis
need to be made to reduce all forms of inequity that exists among different states, within the
states and among different sections and social groups. Since the governments have failed to a
large extent in the health sector NGOs have a great role to play to provide a healthy life to the
expectant mothers and the infants. Poverty reduction program needs revamping through plugging
of the holes in its execution process to ensure poor to be the real beneficiaries. These programs
have been successful in places where there has been political will to punish the officials who are
found guilty in the implementation of the program. In the absence of a strong political will in the
region the only way out to overcome the problem is to strengthen the hands of pressure groups
that have the power to influence the mindset of the politician. Although some pressure groups are
vigilant in the region and acting as watchdogs, they are concerned only with few issues,
sometimes non important and irrelevant issues. Therefore every individual in the region has a
role to play in her/his sphere to create awareness in the neighborhoods to be vigilant against all
such odds, inefficiency, illegal practices and injustice prevalent in the society.
References
Agarwal, A.K. (2010) ‘Human Development in Mizoram: An Overview’ in P. Nayak (ed.) Growth and Human Development in North East India, Oxford University Press, New Delhi, pp. 271-280.
Census of India (2011) [http://www.educationforallinindia.com/chapter6-state-of-literacy-2011-census.pdf], accessed on 13 August 2012.
Central Statistical Organization (2012) Online data on ‘Per Capita Income’ and ‘Infant Mortality Rate’ [http://www.indiastat.com/economy/8/stats.aspx], accessed on 13 August 2012.
Government of Assam (2003) Assam Human Development Report 2003, Planning and Development Department, Dispur, Assam.
Government of India (2002) National Human Development Report 2001, Planning Commission, New Delhi.
Government of Meghalaya (2008) Meghalaya Human Development Report 2008, Planning Department, Shillong, Meghalaya.
Government of Nagaland (2004) Nagaland State Human Development Report 2004, Department of Planning and Coordination, Kohima, Nagaland.
Government of Sikkim (2001) Sikkim Human Development Report 2001, Social Science Press, New Delhi.
Government of Tripura (2007) Tripura Human Development Report 2007, Agartala, Tripura.
Singh E. Bijoykumar (2010) ‘Human Development in Manipur’ in P. Nayak (ed.) Growth and Human Development in North East India, Oxford University Press, New Delhi, pp. 257-270.