A Solution for Preventing Fraudulent Financial
Reporting using Descriptive Data Mining Techniques
Rajan Gupta
Research Scholar, Dept. of Computer Sc. & Applications, Maharshi Dayanand University,
Rohtak (Haryana) – India.
Nasib Singh Gill
Head, Dept. of Computer Sc. & Applications, Maharshi Dayanand University, Rohtak (Haryana),
India.
ABSTRACT
In the present age of scams, financial statement fraud represents enormous cost to our economy. The deliberate misstatement of numbers in the accounting books with the help of well planned scheme by an intelligent squad of knowledgeable perpetrators in order to deceive the capital market participants is termed as financial statement fraud. In order to reduce fraud risk which comprehends both detection and prevention of financial statement fraud, this paper implements descriptive data mining techniques such as Association rules and clustering as opposed to predictive data mining techniques used in the literature. Each of these techniques is applied on dataset obtained from financial statements namely balance sheet, income statement and cash flow statement of 114 companies.
1. INTRODUCTION
Financial statement fraud is an intentional misapplication, deliberate misinterpretation and incorrect execution of accounting principles, policies and standards. These days, financial statement fraud is in news around the world because of high profile cases of fraud at large organisations such as Enron Corporation, WorldCom of U.S. and Satyam of India. This type of fraud is the most expensive type of management fraud perpetrated by top level management of an organisation. The Satyam collapse, which cost Rs. 78 billion caused by cooking of accounting books, is the biggest bankruptcy in the Indian history.
The Security Exchange Commission of U.S. charged two former executives of Basin Water, Inc., a company that built, sold, and leased water treatment systems that cleaned contaminated ground water, with fraudulently inflating its revenues, beginning with the company’s first financial report after it went public. The specific GAAP (Generally Accepted Accounting Principles) violations included improperly recognized revenue transactions where the company did not have a final sale, did not have the customer’s required acceptance of the system, allowed the customer to pay nothing until the customer resold the system, did not provide enough assurance that the customer would pay for the system, or had not yet shipped the system. As result, revenues were overstated in 2006 by 13% and in 2007 by 74%. The SEC also alleged insider trading violations by the CEO. In February 2009, the company restated its financial results and in July 2011 declared bankrupt [1]. A number of warnings of fraud in US listed Chinese companies have grown in recent months. On 11 April, 2011 the SEC suspended trading in RINO International due to questions surrounding the accuracy and completeness of information contained in RINO’s public filings, and the company’s failure to report the resignation of its chairman, directors of the board and an outside lawyer and forensic accountants brought in to investigate allegations of fraud. More recently, the unravelling of Longtop Financial
Technologies Ltd highlighted the scale of the problem. The company regularly reported income that was slightly higher than executives’ predictions [2].
Market participants such as investors, creditors have to make a wise decision about investing in a company on the basis of reliability, uniformity and transparency of the published financial information in the form of financial statements. Therefore, it is the responsibility of the society, accounting profession, business community and different regulators to prevent financial statement fraud because its occurrences undermine the confidence in the corporate world and has worst impact on the economy of a country.
Collapses of high profile companies have left a dirty smear on the effectiveness of corporate governance, quality of financial reports, and credibility of audit functions. An exponential increase in the use of technology has further aggravated the problem in 21st century and provides opportunities for crimes to be committed across borders. It has become a critical issue in the businesses around the world, which has significantly; dampen the confidence of the investors.
Traditional auditing procedures are not able to prevent financial statement fraud because it is not their primary objective. International Auditing and Assurance Standard Board (2007) [3] states that auditors' main responsibility is to express an opinion about whether financial statements are prepared within an acceptable accounting framework and thus provide assurance that financial statement are free from material misstatement, whether caused by fraud or error. Auditing Profession Act 26 (2005) defines audit as the examination of financial statements in accordance with applicable auditing standards with the objective of expressing an opinion as to their fairness and compliance with a financial reporting framework and any applicable statutory requirements. Failure to detect or prevent financial statement fraud can damage the reputation and the credibility of the audit profession [4]. In order to help auditors, data mining techniques can use past cases of fraud to build models to estimate the risk of fraud and help in understanding the reasons behind the fraudulent financial reporting.
opposed to the use of predictive data mining for prevention of financial statement fraud.
In this study we implements descriptive data mining techniques for preventing financial statement fraud because goal of descriptive data mining is to describe the dataset as a whole and underlying relationship in the dataset. Further, this paper aims at identifying behavioural characteristics in terms of financial ratios / items for prevention of financial statement fraud.
Descriptive data mining techniques namely association rule and clustering are tested for their applicability in preventing financial statement fraud in this study. The dataset used in this research consist of financial ratios based on prior research and behavioural characteristics obtained from publically available financial statements.
This paper is organized as follows. Section 2 discusses the prior research which indicates that most of the research has been done in the field of identification and detection of financial statement fraud. Section 3 reveals the reasons behind the fraudulent financial reporting and recipes for cooking the accounting books followed by Section 4 which provides an insight in to the descriptive data mining techniques used in this study. Section 5 provides an analytical review of the results. The paper ends with concluding remarks under Section 6.
2. RELATED WORK
Fraud is a cost too. It has been estimated that internal occupational fraud and abuse costs organizations around 7% of gross revenues. One-fourth of the fraud schemes involve losses greater than $1 million. Most of the frauds are committed by either employees (39.7%) or managers (37.1%) [7]. There are number of studies of the ability to identify and detect fraudulent financial reporting using publically available data. For example, Fanning and Cogger [8] used an artificial neural network to predict management fraud. Using publicly available predictors of fraudulent financial statements, they found a model of eight variables with a high probability of detection. It accurately classified 69% of the fraud companies, while misclassifying 20% of the non-fraud companies in their training data, and accurately identified 66% of the fraud companies, while misclassifying 41% of the non-fraud companies in their hold-out sample.
Spathis et al [9] compared multi-criteria decision aids with statistical techniques such as logit and discriminant analysis in detecting fraudulent financial statements. The results indicate that the investigation of financial information can be helpful towards the identification of FFS and highlight the importance of financial ratios such as the total debt to total assets ratio, the inventories to sales ratio, the net profit to sales ratio and the sales to total assets ratio.
Koskivaara [10] proposed NN based support systems as a possible tool for use in auditing. He demonstrated that the main application areas of NN were detection of material errors, and management fraud. Kirkos [11], carry out an in-depth examination of publicly available data from the financial statements of various firms in order to detect FFS by using Data Mining classification methods. In this study, three Data Mining techniques namely Decision Trees, Neural Networks and Bayesian Belief Networks are tested for their applicability in management fraud detection.
The Bayesian Belief Network model achieved the best performance managing to correctly classify 90.3% of the validation sample in a 10-fold cross validation procedure. The accuracy rates of the Neural Network model and the Decision Tree model were 80% and 73.6% respectively. The Type I error rate was lower for all models
Hoogs et al in 2007 [12] presents a genetic algorithm approach to detecting financial statement fraud. Time-based patterns detected by the genetic algorithm accurately classify 63% of the target class companies and 95% of the peer class companies. The genetic algorithm presented in this study misclassified 5% of the non-fraud companies.
In 2008, Belinna et al [13] examined the effectiveness of CART on identification and detection of financial statement fraud. They concluded by saying that CART is a very effective technique in distinguishing fraudulent financial statement from non fraudulent.
Further, Zhou & Kapoor [14] examined the effectiveness and limitations of data mining techniques such as regression, decision trees, neural network and Bayesian networks. They explore a self – adaptive framework based on a response surface model with domain knowledge to detect financial statement fraud. Johan Perols [15] compares the performance of six popular statistical and machine learning models in detecting financial statement fraud. The results show, somewhat surprisingly, that logistic regression and support vector machines perform well relative to an artificial neural network in detection and identification of financial statement fraud.
Recently, Gupta & Gill [16] examined the efficacy of three data mining techniques namely CART, Naïve Bayesian Classifier and Genetic Programming on detecting fraudulent financial statements. CART manages to classify 96% of the cases and outperforms other two methods in terms of sensitivity and specificity.
The review of existing literature reveals that the research conducted till date is solely in the field of detection and identification of financial statement fraud by classifying organizations into fraud and non – fraud. A very little or no research has been done in the field of prevention of fraudulent financial reporting.
Predictive data mining techniques have been used by most of the researchers for classifying organizations into fraud or non – fraud and input vector used consists of financial ratios related to profitability, liquidity, safety and efficiency. In order to prevent fraudulent financial reporting we enriched the input vector with behavioural characteristics such as age and size of the company. In this study, we implements descriptive data mining techniques for prevention of financial statement fraud.
3. RECIPES FOR COOKING THE
BOOKS
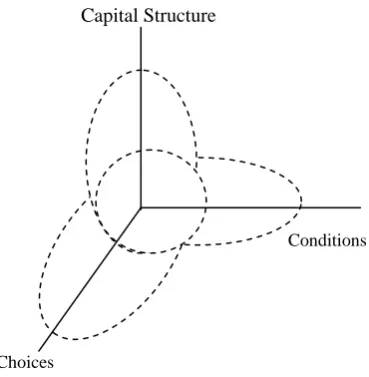
Figure: 1(3C’s Model for financial statement fraud)
Capital Structure
Conditions
Choices
The presence of any one of these three variables (3C’s) should be taken as a warning sign for the possibility of financial statement fraud. However certain combination of two or more variables at any point in time can increase the likelihood of management fraud because pattern exhibited by 3C’s provides enough opportunities, motivations and incentives for management to cook the accounting books.
“Conditions”, the first variable of 3C’s model refers to the motivation and pressure (financial and economical) that an organization faces. Financial pressure includes pressure to meet analysts’ earnings estimate which can play an important role in the unlawful activity known as financial statement fraud. Financial pressure such as decline in quantity and quality of earnings act as a motivation for the upper management in the commission of financial statement fraud. Second C of 3C’s model is “capital structure”. The likelihood of financial statement fraud may increases by the environment created by capital structure of an organization. It refers to the presence of effective corporate governance which includes effective internal control structure and fair audit committees. “Choice” is the third variable in the model given by Z. Reazee. Choice is an option to be exercised by the management between the use of ethical business strategies and the use of illegal earnings management schemes for achieving the continuous enhancement in quantity and quality of earnings. Financial statement fraud could be just one of the choices opted by the management.
The management of an organisation may use financial statement fraud as a strategic tool in spite of the corporate governance or environmental pressure because of its own characteristics in terms of loyalty, aggressiveness, control ineffectiveness and lack of moral principles.
The upper management of a company may choose to engage in fraudulent financial reporting if:
a) The personal assets or capital of the management is closely associated with the performance of the company in terms of profit sharing.
b) Enough opportunities are present for the management to commit the financial statement fraud.
c) The management is willing to maximize shareholder value for handling some internal or external pressure.
d) Top level executives are ready to take personal risk for corporate benefits.
e) The chances of detection of fraud are negligible. Once, the management has decided to be engaged in fraudulent financial reporting then they may use any of the following recipes for cooking the accounting books. 1. Overstatement of Revenue – Revenue may be
overstated by inflated sales. This can be achieved by entering fictitious sales or by entering a sale before the revenue is earned actually in the financial statements.
2. Understatement of Expenses – Holding expenses incurred during the current period over to the next financial period is termed as understatement of expenses. This can happen by wrongly capitalizing an expense over a number of periods, rather than properly expensing it immediately.
3. Overstatement of Assets – Assets could be overstated by not booking down the accounts receivables or by not writing down the assets with impaired values or obsolete inventory.
4. Understatement of Liabilities – Liabilities may be understated by improperly recording liabilities as equity or by moving them between short term and long term.
5. Improper Use of Reserves – Reserve accounts such as reserves for accounts receivables, warranties, inventory obsolescence and sales returns are intrinsically risky because a great deal of judgement is required to determine their balances at the end of the financial period.
6. Mischaracterization as one – time expenses – The management of an organization may remove one - time expenses from the accounting books for giving a false impression about the organization’s operating results to the capital market participants. 7. Misapplication of Accounting Rules – Financial
statement fraud may be perpetrated by exploiting loop holes present in the accounting rules.
8. Misrepresentation of Information – Management deliberately misrepresents or omits certain information in the financial statement to mislead the users of financial statement about the operations of the organisation.
4. RESEARCH METHODOLOGY
4.1
Dataset
The dataset used in this research is obtained from financial statements of 114 listed companies. The data has been collected from www.wikinvest.com. In order to identify companies accused of financial statement fraud, Accounting and Auditing Enforcement Releases published by S.E.C. (U.S. Securities and Exchange Commission) between 2007 and 2012 have been analysed. All the incidents of violation of the Foreign Corrupt Practices Act (FCPA) have been removed from the sample, because FCPA prohibits the practice of bribing foreign officials and most of the AAERs issued because of FCPA do not reflect which financial statement viz. balance sheet or income statement, is affected.
[image:3.595.56.241.98.287.2]However, absence of any proof does not guarantee that these firms have not falsified their financial statements or will not do the same in future. In order to identify organizations with probability of fraud, this research implements descriptive data mining methods. The results produced in this research will help the management of the organizations concerned in preventing financial statement fraud.
4.2
Variables
All the variables to be used as a candidate for participation in the input vector have been extracted from published financial statements such as income statement, cash flow statement and balance sheet. The dataset contain 62 financial ratios / items for each of the 114 companies. A list of these financial ratios / items is presented in Table 1. The selection of these financial variables is based on prior research and financial ratios on liquidity, safety, profitability and efficiency of the organisations under consideration. Behavioral characteristics such as age of the company, size on the basis of total assets and total revenue has been included in the list of input variables for preventing fraudulent financial reporting.
[image:4.595.308.550.70.358.2]During the preprocessing stage, data has been transformed in to an appropriate format for mining. Each of the independent financial variables has been normalized by using range transformation (min = 0.0, max = 1.0).
Table 1: Financial ratios to be used in prevention of financial statement fraud
S.No. Financial items / Ratios
1 Debt 2. Total assets 3 Gross profit 4 Net profit
5 Primary business income 6 Cash and deposits 7 Accounts receivable
8 Inventory/Primary business income 9 Inventory/Total assets
10 Gross profit/Total assets 11 Net profit/Total assets 12 Current assets/Total assets 13 Net profit/Primary business income
14 Accounts receivable/Primary business income 15 Primary business income/Total assets 16 Current assets/Current liabilities 17 Primary business income/Fixed assets 18 Cash/Total assets
19 Inventory/Current liabilities 20 Total debt/Total equity 21 Long term debt/Total assets 22 Net profit/Gross profit 23 Total debt/Total assets 24 Total assets/Capital and reserves 25 Long term debt/Total capital and reserves 26 Fixed assets/Total assets
27 Deposits and cash/Current assets 28 Capitals and reserves/Total debt 29 Accounts receivable/Total assets 30 Gross profit/Primary business profit 31 Undistributed profit/Net profit
32 Primary business profit/Primary business profit of last year 33 Primary business income/Last year's primary business
income
34 Account receivable /Accounts receivable of last year 35 Total assets/Total assets of last year
36 Debit / Equity
37 Accounts Receivable / Sales 38 Inventory / Sales
39 Sales – Gross Margin 40 Working Capital / Total Assets 41 Net Profit / Sales
42 Sales / Total Assets 43 Net income / Fixed Assets 44 Quick assets / Current Liabilities 45 Revenue /Total Assets 46 Current Liabilities / Revenue 47 Total Liability / Revenue 48 Sales Growth Ratio 49 EBIT
50 Z – Score
51 Retained Earnings / Total Assets
52 EBIT / Total Assets
53 Total Liabilities / Total assets
54 Cash return on assets
55 Interest expense / Total Liabilities
56 EBIT / sales
57 Age of the company (Number of years since first filing available from provider)
58 Change in cash scaled to total assets
59 Change in current assets scaled by current liabilities
60 Change in total liabilities scaled by total assets
61 Size of company on the basis of assets
62 Size of company on the basis of revenue
We compiled all the 62 input variables given in Table 1.In order to reduce dimensionality of the dataset we applied one way ANOVA. The variables with p – value <=0.05 are considered significant and informative and with high p – value are deemed to be non – informative. Informative variables are tested further using descriptive data mining methods. The input variables which are considered significant are given in Table 2 along with respective F- values and p – values.
Table 2: List of informative variables
S.No. Financial Items / Ratios F - value
P – value
1 Debt 1.345 .028 2 Inventory/Primary business income 3.031 .001 3 Inventory/Total assets 17.468 .000 4 Net profit/Total assets 3.035 .001
5
Accounts receivable/Primary business income
6.099 .018
6 Primary business income/Total assets 3.038 .001 7 Primary business income/Fixed assets 3.055 .001 8 Cash/Total assets 2.918 .001 9 Inventory/Current liabilities 6.744 .001 10 Total debt/Total assets 2.851 .001 11
Long term debt/Total capital and reserves
4.266 .014
21 Capital and Reserves / Total Debt 1.130 .049 22 Retained Earnings / total assets 3.039 .001 23 EBIT 4.363 .023 24 EBIT / Total Assets 3.043 .001 25 Z – score 3.054 .001 26 Total liabilities / Total Assets 3.154 .002 27 Cash flow from operations 1.720 .018 28 Cash return on assets 3.940 .002 29 Interest Expenses 1.806 .010 30 Interest exp / Total Liabilities 1.440 .042 31
Size of the company on the basis of assets
1.179 .043
32 Change in cash scaled by total assets 2.967 .001 33
Current Liabilities of the previous year
1.391 .028
34 Total Liabilities of the previous year 1.346 .022 35
Change in Total Liabilities scaled by Total Assets
3.188 .001
4.3
DESCRIPTIVE DATA MINING
TECHNIQUES
Descriptive data mining analyze the data from different dimensions in order to find interesting unknown patterns, underlying relationships and correlations among number of attributes in large relational databases. Descriptive data mining aims at describing the interesting general properties of data set in a concise and summative manner. One of the major advantages of using descriptive data mining techniques is that it is easier to apply on unsupervised data. This advantage of descriptive data mining techniques has been used in this research in order to prevent fraudulent financial reporting. Two descriptive data mining techniques of good repute viz. association rules and clustering have been employed in this research study.
4.3.1
Association Rule
The association rule is first introduced by Agrawal et al. [18] [19] Formal statement of the problem is as follows. Let I = {i1, i2, . . .,im} be a set of items. Let E be a set of transactions, where each transaction T is a set of items such that associated with each transaction is a unique identifier, called its TID. A transaction T contains X, a set of some items in I, if X T. An association rule is an implication of the form X=>Y where X, Y I and X Y= . The rule X=>Y holds in the transaction set E with confidence conf if conf% of transactions in E that contain X also contain Y. The rule X=>Y has support sup in the transaction set E if sup% of transactions in E contain X Y. Support is a measure of statistical significance of associations rules and confidence is the degree of correlation in the dataset between X and Y. Support of an association rule can be defined as :
No of transactions that contain both X, Y
Supp = ---
Total number of transactions in E
Confidence of a rule can be defined as
Conf(X => Y) = Supp (X Y) / Supp (X).
For selection of interesting rules among the set of all possible rules, lift and conviction are two constraints which can be used along with support and confidence. Lift of a rule can be defined as follows;
Supp (X Y)
Lift (X=>Y) = ---
Supp (Y) * Supp (X)
Conviction of a rule can be defined as:
1 – Supp(Y)
Conv(X=>Y) = ---
1 – Conf(X=>Y)
Generally, association rules are required to satisfy minimum support and minimum confidence specified by the user. The process of generation of association rules is divided into two steps. In the first step, minimum support is applied to find frequent itemsets from the dataset. These frequent itemsets along with the constraint of minimum confidence are used for creating association rules in the second step. The effectiveness of rule based system depends on the knowledge and expertise of the person designing the rules. The interestingness of a rule can be measured by using constraints such as lift and conviction. The disadvantage of association rule mining is that it can increase the probability of throwing many valid transactions as exceptions. This limitation can be overcome to some extent by prioritising the rules.
4.3.2
Clustering
5. RESULTS AND ANALYSIS
Two descriptive data mining techniques discussed above have been implemented on the dataset obtained from 114 organisations.
[image:6.595.310.549.71.205.2]In this study, association rules have been generated using RapidMiner version 5.2.3. All the informative variables have been converted into nominal variables. Nominal variables further converted into binomial variables because it is the preliminary requirement for using FP Growth algorithm for generation of frequent itemsets. The minimum support for FP Growth has been set to 0.95. The frequent itemsets generated has been used for creating the association rules. The minimum confidence for generating rules is 0.8.
Table 3: List of Association Rules
The ratios used in the association rules are the measure of efficiency and liquidity of an organization. The rules generated above can raise an alarm for the auditors and top level executive regarding financial statement fraud.
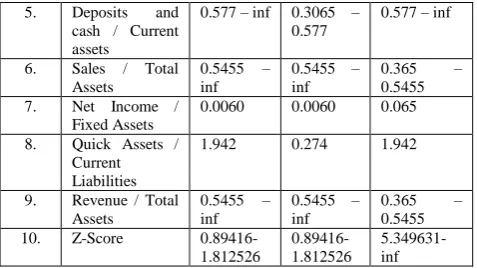
Clustering, the second descriptive data mining technique has been implemented using data mining software, Weka version 3. K –means clustering has been implemented by setting the value of K as 2. Test mode has been set to classes to cluster evaluation on training data. A binary variable has been selected as a class variable. K-mean clustering algorithm clustered 85% of the observations correctly. The cluster centroids for two clusters along with interesting variables are given below. (Table 4)
Table 4: Cluster Centroids S.No. Interesting
Attribute
Full Data (114)
Cluster
Non -
Fraud (68)
Cluster Fraud (46)
1. Inventory / Total Assets
0.051-inf 0.051-inf -inf – 0.0035 2. Accounts
receivable / Primary business income -0.0375-0.7875 .7875-1.764
-0.0375 - 0.7875
3. Primary business income
/ Fixed assets
0.105 0.072 0.105
4. Cash / Total Assets
0.1985 – inf
0.1985 – inf
0.1985 – inf
5. Deposits and cash / Current assets
0.577 – inf 0.3065 – 0.577
0.577 – inf
6. Sales / Total Assets
0.5455 – inf
0.5455 – inf
0.365 – 0.5455 7. Net Income /
Fixed Assets
0.0060 0.0060 0.065
8. Quick Assets / Current Liabilities
1.942 0.274 1.942
9. Revenue / Total Assets
0.5455 – inf
0.5455 – inf
0.365 – 0.5455 10. Z-Score
0.89416-1.812526 0.89416-1.812526 5.349631-inf
K – mean clustering algorithm classify 68 organisations out of 85 organisations as non fraud and 46 organisations as fraud in place of 29 fraudulent organisations available in the dataset. This means that 17 organisations (considered as non fraud in the dataset) have substantial indication of financial statement fraud.
6. CONCLUSION
The cost of financial loss and trust of capital market participants in the annual published results are the main driving force behind the motivation of organisations to investigate in the anti-fraud field. Internal fraud such as financial statement fraud must be controlled as any other costly threat to the organization.
In this study, descriptive data mining methods is implemented on dataset collected from financial statements of 114 companies for finding rules for prevention of financial statement fraud. We collected and compiled 62 financial variables / ratios. Then, one way ANOVA is used for finding informative variables on the basis of p –value. Then two descriptive data mining methods namely association rules and clustering are applied on 35 informative ratios. Seven association rules have been generated with a support and confidence greater than minimum values of 40% and 80% respectively. The financial ratios indicated in association rules generated in this research should be taken in to account carefully by the management and auditors for preventing fraudulent financial reporting. Moreover, these rules can be used by capital market participants for judging the actual financial status of the organization.
K – Means clustering identifies 17 non fraud organizations (out of 85 non fraud organizations in the dataset) as fraudulent. It means that these 17 organizations may be suffering from unnoticed financial frauds. These results can act as a whistle blower for management regarding financial statement fraud.
Hence, by using descriptive data mining, organizations can prevent fraudulent financial reporting.
The descriptive data mining methods used in this research for prevention of financial statement fraud should be reinforced following the best predictive data mining techniques for detection of fraudulent financial reporting.
The accuracy of the methods used in this research can be improved by including qualitative information such as composition of administrative board and presence or absence of lavish life style of the top level executives, along with financial ratios used in this research.
7. REFERENCES
[1] Floyd Advisory LLC, Summary of Accounting and auditing enforcement releases for three months ended September 30, 2011.
S. N
Association Rule Support Confidence Lift Conviction
1. Inventory / total assets > 0.033 Fraud
43% 86% 1.153 1.812
2. Cash / Total Assets <0.198 Fraud
42.1% 84.2% 1.129 1.611
3. Inventory / Current Liabilities >0.190 Fraud
43.9% 87.7% 1.176 2.071
4. Deposits and cash / Current Assets <0.408 Fraud
43.9% 87.7% 1.176 2.071
5. Sales / Total Assets >.553 Fraud
44.7% 89.5% 1.200 2.417
6. Revenue / Total Assets >.553 Fraud
44.7% 89.5% 1.200 2.417
7. Inventory / current Liabilities >0.190 && Deposits and cash / Current Assets < 0.408 Fraud
[2] Atkins Matt, Accounting Fraud in US listed Chinese companies (September 2011). Available at: http://www.financierworldwide.com
[3] International Auditing and Assurance Standards Board (IAASB). 2007. Objective and general principles governing an audit of financial statements (ISA200). http://www.ifac.orgiMembers/DownLoads/2007_IAASB _ Handbook.pdf
[4] Chui, L., and B. Pike. 2011. Auditors’ responsibility for fraud detection: New wine in old bottles? In Proceedings of the American Accounting Association 2011 Annual Meeting.Denver.
[5] Kantardzi1 c M. (2002), Data Mining: Concepts, Models, Methods, and Algorithms’, Wiley – IEEE Press. [6] Han Jiawei & Kamber Micheline, Data Mining: Concepts
and Techniques, Morgan Koufmann Publishers
[7] Access your organizations fraud control policies, management and practices, Published by Certified
Information Security. Available at:
http://www.certifiedinfosec.com/fraud-control/establishing-the-fcms-fraud-risk-assessment [8] Fanning, K., & Cogger, K. (1998). Neural network
detection of management fraud using published financial data. International Journal of Intelligent Systems in Accounting, Finance & Management, 7(1), 21–24. [9] C. Spathis, M. Doumpos, C. Zopounidis, Detecting
falsified financial statements: a comparative study using multicriteria analysis and multivariate statistical techniques, European Accounting Review 11 (3) (2002) 509–535.
[10]E. Koskivaara, Artificial neural networks in auditing: state of the art, The ICFAI Journal of Audit Practice 1 (4) (2004) 12–33.
[11]Efstathios Kirkos, Charalambos Spathis & Yannis Manolopoulos (2007). Data mining techniques for the
detection of fraudulent financial statements. Expert Systems with Applications 32 (23) (2007) 995–1003 [12]Hoogs Bethany, Thomas Kiehl, Christina Lacomb and
Deniz Senturk (2007). A Genetic Algorithm Approach to Detecting Temporal Patterns Indicative Of Financial Statement Fraud, Intelligent systems in accounting finance and management 2007; 15: 41 – 56, John Wiley & Sons, USA, available at: www.interscience.wiley.com [13]Belinna Bai, Jerome yen, Xiaoguang Yang, False
Financial Statements: Characteristics of china listed companies and CART Detection Approach, International Journal of Information Technology and Decision Making , Vol. 7, No. 2(2008), 339 - 359
[14]Wei Zhou, G. Kappor, Detecting evolutionary financial statement fraud, Decision Support Systems 50 (2011) 570 – 575.
[15]Johan Perols, Financial Statement Fraud Detection: An Analysis of Statistical and Machine Learning Algorithms, A Journal of Practice & Theory 30 (2), 19 (2011), pp. 19-50
[16]Gupta R. and Gill N.S. (2012). “Data Mining Techniques – A Key for detection of financial statement fraud”, International Journal of Computer Science and Information Security, Vol. 10, No. 3, pp. 49 – 57. [17]Z. Rezaee, Financial Statement Fraud-Prevention and
Detection, John Wiley &Sons, Inc., 2002.
[18]Agrawal, R. and Srikant, R. (1993): Fast algorithms for mining association rules. In Proc. of the 20th Intl. Conf. on Very Large Data Bases, pp.478–499. Santiago, Chile. [19]R. Agrawal, T. Imielinski, and A. Swami. Mining