Brain Mapping using Compressed Sensing with
Graphical Connectivity Maps
S. Archana
PG Scholar-M.Tech Biomedical Engg
Amrita University Coimbatore, Tamilnadu
K. A. Narayanankutty,
PhD.
Professor- Dept of E.C.E Amrita University Coimbatore, Tamilnadu
Anand Kumar,
M.D; D.S., Head-Neuroscience Amrita Institute of Medical
Sciences
ABSTRACT
Utility of graphical representation of EEG data and colour-maps are now well established. Research on localisation and activity in neuronal pathway are also progressing. The EEG data could be visualized simultaneously as colour-maps and as connected neuronal pathways simultaneously as a movie on a GUI for diagnosis and understanding of the brain activity. The colour-maps are generally constructed using ICA. In this paper, the same is constructed using a compressed sensing technique. A GUI with the connected graph and magnitudes are also generated from EEG.
General Terms
Color mapping, Compressed Sensing, Connectivity
Keywords
EEG compressed sensing, colour map, connectivity, GUI.
1.
INTRODUCTION
The only non-invasive methodology which is involved in measuring the electrical activity of brain is Electroencephalogram. EEG waves under excitement and depression are not regular and not deterministic. As such apart from EEG; the existing functional investigations include fMRI, SPECT, Magneto-encephalography and PET. Each area in the brain is responsible of a particular task, it is necessary to know the area involved for task done, since brain functions can be evaluated using electrical activity of the brain. Locating the functional area in the brain for a particular task is the ultimate aim of this paper. There is functional brain atlases available mainly based on PET and fmRI studies. Main problem with functional brain atlasing is the uniformity of paradigms used for eliciting functional activity and the inconsistency of responses. Brain activity is dynamic and network based. Brain atlases are constructed from the EEG time series data does not render diagnosis but helps in a way to make diagnosis by the clinicians. The same function will have components in different areas with one nodal area or a governor. In order to understand more in detail about the brain functionality, connectivity play a major role in neuroscience. Usage of graph theory [1] is involved in connectivity analysis in case of seizure. Studying the functional connectivity in the brain through a crude test such as EEG especially looking at the daily activity of an individual will be gross generalization. This network regularization is analyzed using coherence and synchronization likelihood [2]. Besides simple potential mapping connectivity provide information to understand more about brain activity. The functional connectivity is estimated using high resolution EEG [3]. Connectivity provides information regarding the connection among the spatially
remote regions of the brain, which is of much importance in neuroscience.
Visualizing EEG data in the form of colour maps is applied in many of the research to study the activity of the brain. In response to certain medication such as psychotropic medication brain mapping provide information which is used to study the response of the brain. Brain mapping also is used to study the insomnia characteristics. In certain cases the cortical activity and mapping power are compared and coherence and asymmetry measures are also examined.
The technique of Brain mapping is useful in many applications, an individual response for a particular medication; understand about emotional responses etc… Functional area with respect to EEG signal been mapped which is responsible for a particular task and the functionality of brain can be studied in detailed through connectivity in this work, but brain mapping is not a substitute for EEG. Christopher Wilke (2008) estimated time-varying connectivity patterns through the use of an adaptive directed transfer function [4], similarly Pieter van Mierlo and colleagues (2009) studied time-variant functional connectivity pattern during an epileptic seizure [5]. Brain is a complex organ, whose functions and responses are still a miracle. These potential studies and connectivity pattern would serve as a limelight to understand the functionalities of brain.
Brain colour mapping is a pseudo colour representation to know the region of maximum functionality at a certain instant for a particular human task. This work mainly used by the people to visualize the EEG activity over the scalp to understand the electrical activity on the scalp. Only by visualizing the colour map, much information about the brain activity cannot be obtained, so a work taken up in the area of connectivity to know the areas which functionally connect the other remote areas of the brain. By determining the flow of information the connection or the links between the remote regions of the brain at the specific time instant can be identified.
coefficients obtained from a multivariate adaptive autoregressive (MVAAR) model.
2.
POTENTIAL MAPPING
2.1
Pseudo color map
Scalp potential map is colour mapping the whole scalp with respect to the amplitude of the EEG signal at distinct interval of time. Colour bar is created for the amplitude value of the EEG signal. There are two types of colour bar, including global colour bar and local colour bar. The global colour bar is defined by the maximum absolute value of the entire EEG dataset, while the local colour bar is defined by the maximum absolute value at the current time point. Through this colour map visual representation of EEG signals can be viewed, by utilizing GUI in MATLAB.
Graphic representation are essential in these technique in order to visualize the bio electric signals from which responses of the brain can be made out and medication can be proceeded.
Compressed sensing technique is employed in mapping technique, since in recent research areas it’s been widely employed. It is techniques which uses only few data points from the original signals and reconstruct the whole sequence by employing Sparsity technique. The main advantage is that it doesn’t require sampling done at nyquist rate.
The interpolated points are into the compressed sensing module and the colour map is done on the realistic scalp image. By utilizing the amplitude values on the electrode location on the scalp image, other points are interpolated. With only few data points among the whole data, maps are visualized on the scalp image which employs GUI technique. Such graphical representation of the EEG data is essential in visualizing the activity of the EEG data over the scalp.
2.2
Interpolation
This gridding method is especially applicable for producing smooth surface from data sets with unevenly-distributed points [6]. This interpolation is used to interpolate irregular spaced data at the grid points specified by XI and YI.
VI=griddata(model.X,model.Y,values,model.XI,model.YI,'v4' );
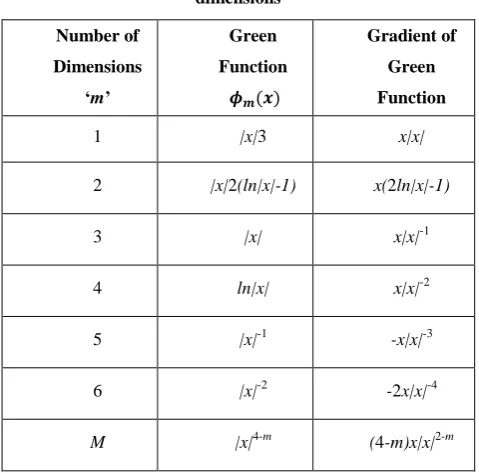
Advantage of this technique is that it is easily applied to interpolation problems in three dimensions. The algorithm used for interpolation in ‘v4’ is for finding minimum curvature surface that pass through a set of no uniformly spaced data points and it’s based on green function of the biharmonic operator. The biharmonic green function, , is provided in the Table 1 [7].
The interpolating curve or surface that satisfies the biharmonic equation, has minimum curvature.
( ) ∑ ( ) (2.1)
( ) (2.2)
Where the biharmonic operator and x is is a position in m-dimensional space. The general solution is:
( ) ∑ ( ) (2.3)
The ’s are found by solving the linear system.
[image:2.595.309.549.89.326.2]( ) ∑ ( ) (2.4)
Table 1. Biharmonic Green Function and gradient for dimensions
Number of Dimensions
‘m’
Green Function
( )
Gradient of Green Function
( )
1 |x|3 x|x|
2 |x|2(ln|x|-1) x(2ln|x|-1)
3 |x| x|x|-1
4 ln|x| x|x|-2
5 |x|-1 -x|x|-3
6 |x|-2 -2x|x|-4
M |x|4-m (4-m)x|x|2-m
The biharmonic green function, , for each dimension is provided. In this slope measurements can be used as data. In higher dimensions each slope is associated with a direction n.
2.3
Convex optimization in Mapping
A signal or image is sparse then it is said to be compressible. In this work, the interpolated value are compressed sensed using l1 norm minimization procedure is applied.
A brief background on compressed sensing theory is provided in this section. Given a signal x and a dictionary Ψ, x is said to be sparse if x can be well approximated by a linear combination of a small set of vectors from Ψ,
∑ (2.5)
Where K << N, the Compressed Sensing theory which states that it is possible to construct an M × N measurement matrix Φ, where M << N, and reconstruct x from the measurements [8 - 11]
(2.6)
The signal can be recovered from its measurements when the measurement matrix is incoherent with the dictionary that the signal is sparse over. Recovery of any signal that is K-sparse in the dictionary Ψ from its projection onto Φ is possible. Several algorithms have been proposed for recovering x from the measurements y by solving the following optimization problem:
(2.7)
A colour map is reconstructed out of limited number of input data as shown in Fig. 1.
3.
FUNCTIONAL CONNECTIVITY
Connectivity results in elucidating link among spatially remote regions of the brain.
Functional connectivity [12] is highly time-dependent; In general, functional connectivity captures deviations from statistical independence between distributed and often spatially remote neuronal units. It can be estimated by measuring correlation or covariance, spectral coherence or phase-locking. Functional connectivity is often calculated, regardless of whether these elements are connected by direct structural links.
Initially connectivity was calculated using correlation method using NodeXL in MS Excel. Electrode positions are located using specific layout as shown in Fig. 2, then connectivity matrix is then includes in the Excel sheet to view the connectivity as shown in Fig. 3
Connectivity determined through above mentioned methods such as correlation or covariance, spectral coherence or phase-locking does not involve any directional influence. Adaptive directed transfer function is used to determine directional influences between any given pair of signals in a multivariate data set. It is computed on a multivariate autoregressive model (MVAR) that simultaneously models the whole set of signals.
3.1
Multivariate Adaptive Autoregressive
Modeling
MVAAR model constructed for each time series, which is denoted as
( ) ∑ ( ) ( ) ( ) (3.1)
Where X (t) is the data vector over time, (i, t) are the matrices of time-varying model coefficients, E (t) is multivariate independent white noise, and p is the model order. The time-varying coefficient matrices established by the Kalman filter algorithm. With the time-varying model coefficients, the transfer function H(f,t) can thus be obtained from the time-varying transfer matrix. The adaptive DTF [13] ,[14] values were then defined as a function of both time and frequency as follows
( )
( )
∑ ( ) (3.2)
The DTF function, H (f), can be obtained from the MVAR model and is described by transforming, where is a function of t, into the frequency domain. The DTF is computed by
( ) ( ) ( ) (3.3)
( ) ( ) ( ) ( ) ( ) (3.4)
Where ( ) ∑ and . Since we are able to characterize the time-varying model coefficients, (i, t), the function H (f, t) can thus be obtained from the time-varying transfer matrix. Its elements, Hij , represent the connection between the jth and ith elements of the system for each time point. The normalized ADTF is defined by the elements of the transfer matrix in the spectral domain, which describes the directional causal interaction from the jth to the ith element as
( )
( )
∑ ( ) (3.5)
ADTF functions yield arbitrary values representing the functional connectivity, which, however, are still subject to statistical assessments of their significance. Since the ADTF measures have a highly nonlinear relation to the time series from which they are derived, it is difficult to apply traditional parametric statistical methods. Instead, a nonparametric
method based on surrogate data is used to assess the significance of the estimated connectivity measures. In this method, the original time series were transformed to the Fourier space, in which the phases are randomly shuffled without changing the magnitude. The surrogate data in the Fourier space are then transformed back to the time domain. This process of phase shuffling preserves the spectral structure of the time series, which is suited for ADTF analysis as it is a measure of frequency-specific causal interactions. After shuffling, the connectivity estimation is applied to the surrogate data.
4.
RESULT
[image:3.595.329.535.273.428.2]The colour represents the activity involved in that area. As when the line tag (green) is placed over the EEG time data the corresponding colour map is displayed over the scalp region. The selection can be made for visualizing the connectivity over the realistic scalp, in Fig 1, by clicking ‘connectivity’ in the menu bar.
Fig 1: Pseudo colour map using compressed sensing
Here in NODEXL the electrode locations were placed approximately and the layout is saved. Then when the connectivity matrix imported, the connectivity is viewed connecting the regions involved the underlying activity. These connectivity matrixes which were imported are based on correlation between in the data. Fig 2 shows the layout of placement of 19 electrodes in the graph section. The Fig 3 shows the connectivity visualized through NodeXL.
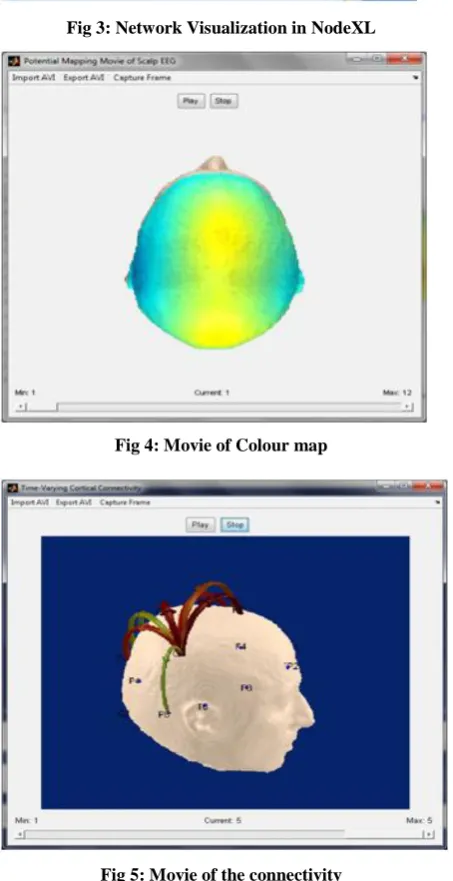
[image:3.595.317.533.561.720.2]Fig 3: Network Visualization in NodeXL
Fig 4: Movie of Colour map
Fig 5: Movie of the connectivity
Individual movies for both mapping as well as connectivity created as shown in Fig 4 and Fig 5. Movies been viewed in the same window later for better understanding as shown in Fig 6.
Fig 6: Movie in a Single Window
5.
CONCLUSION
It is a novel concept and seems to be a promising non-invasive tool. This method does bring out hidden data in the routine EEG, and can work out specific paradigms and test this method for consistency and reproducibility. As such there is not enough support to claim that localizing functional active area for neither given action or to define the connectivity; it can be made useful for the clinician by working out simple and complex paradigms.
6.
ACKNOWLEDGEMENT
Our sincere thanks to the Amrita School of Engineering, for providing necessary facilities in completing the work.
REFERENCES
[1] S.C. Ponten, F. Bartolomei , C.J. Stam, “Small-world networks and epilepsy: Graph theoretical analysis of intracerebrally recorded mesial temporal lobe seizures”, Elsevier in Clinical Neurophysiology, Vol. 118, pp.918– 927,2007.
[2] S.C. Ponten, L. Douw, F. Bartolomei, J.C. Reijneveld, C.J. Stam, “Indications for network regularization during absence seizures: Weighted and unweighted graph theoretical analyses”, Elsevier in experimental neurology, Vol.217, pp.197-204, 2009.
[3] F. Babiloni, F. Cincotti, C. Babiloni, F. Carducci, D. Mattia, L. Astolfi, A. Basilisco, P.M. Rossini, L. Ding, Y. Ni, J. Cheng, K. Christine, J. Sweeney, and B. Heg, “Estimation of the cortical functional connectivity with the multimodal integration of high-resolution EEG and fMRI data by directed transfer function”, Elsevier in neuroimage, Vol.24, pp.118-131,2005.
[image:4.595.56.283.247.688.2][6] Martin H. Trauth, R. Gebbers, N. Marwan, ‘Spatial Data’ in Matlab Recipes for Earth Sciences, 3rd ed. Springer,
2010, ch.7, sec.7, pp.193-240.
[7] Sandwell, T. David, ‘Biharmonic Spline Interpolation of GEOS-3 and SEASAT Altimeter Data’, Geophysical Research Letters, vol. 14, no. 2, pp. 139–142, 1987. [8] C. J. James, C. W. Hesse,“Mapping Scalp Topographies
of Rhythmic EEG Activity using Temporal Decorrelation based Constrained ICA”, Proceedings of the 26th Annual International Conference of the IEEE EMBS, pp.994-997,September 2004.
[9] E. Candes and T. Tao, “Near-optimal signal recovery from random projections: universal encoding strategies,” IEEE Trans. on Information Theory, Vol. 52, pp.5406– 5425, 2004.
[10]D. Donoho, “Compressed sensing,” IEEE Trans. on Information Theory, vol. 52, pp. 1289–1306, 2006. [11]Ge wang, Guest Editor, “Guest Editorial Compressive
Sensing for Biomedical Imaging”,IEEE transactions on medical imaging, vol. 30, no. 5, pp. 1013-1016,may 2011.
[12]Jean-Philippe Lachaux, Eugenio Rodriguez, Jacques Martinerie, Francisco J. Varela, “Measuring Phase Synchrony in Brain Signals”, Science direct in Human Brain Mapping, Vol.8(4),pp.194-208,1999.
[13]M. J. Kaminski and K. J. Blinowska, ‘A new method of the description of the information flow in the brain structures’, Biological Cybernetics, vol. 65, no. 3, pp. 203–210, 1991.